NorESM SST pacemaker precipitation plots

N2_FF 200hPa Velocity Potential plots
P1: 1980-2000
p2: 2000-2020
N2_FF 200hPa Velocity Potential plots
P1: 1980-2000
p2: 2000-2020
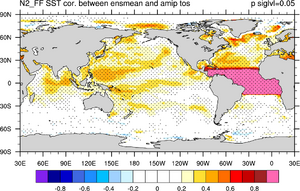
N2_FF and AMIP sst correlation
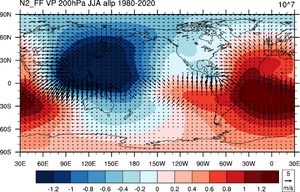
N2_FF 200hPa Velocity Potential plots P1: 1980-2000 p2: 2000-2020

N2_FF 850hPa Velocity Potential plots
P1: 1980-2000
p2: 2000-2020
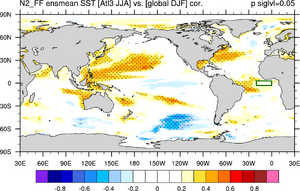
N2_FF sst correlation plots
Period is 1980 to 2020
contact: pgchiu (Ping-Gin.Chiu_at_uib.no)