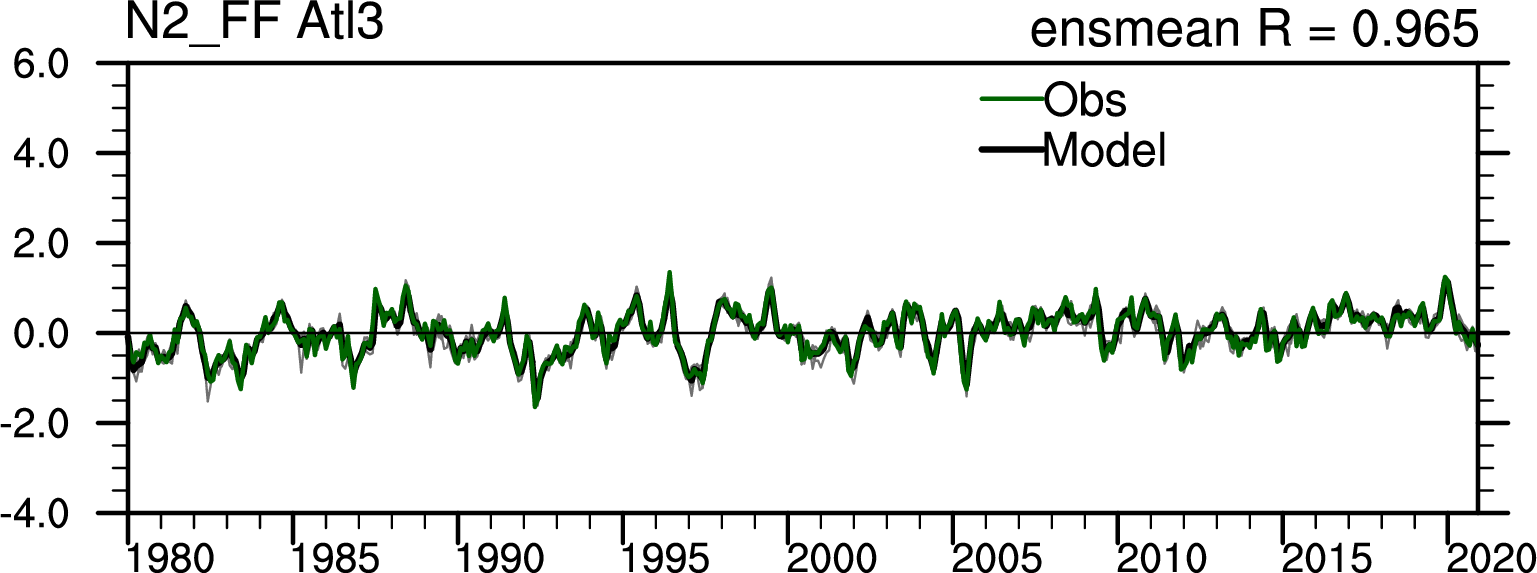
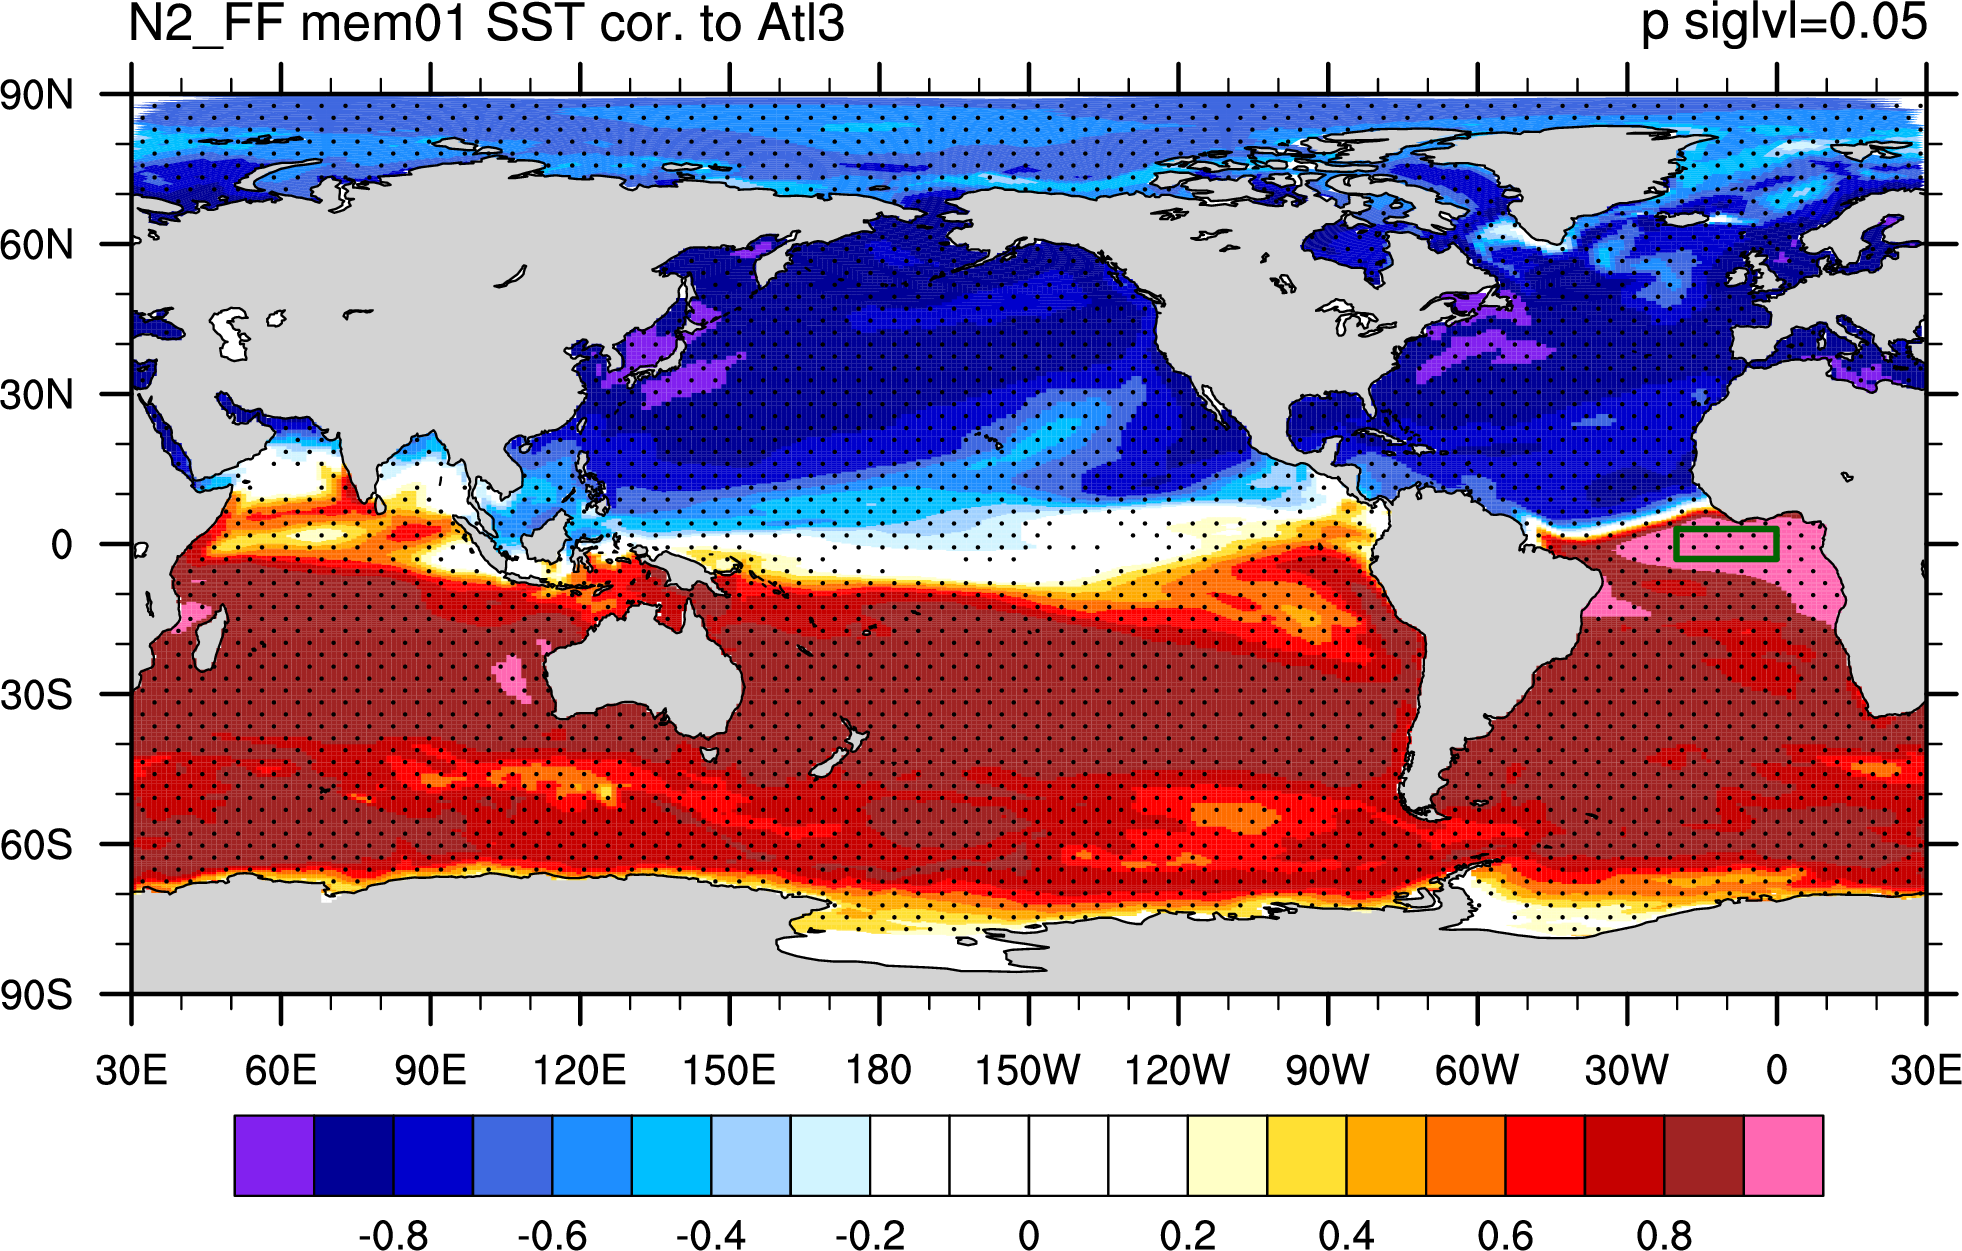
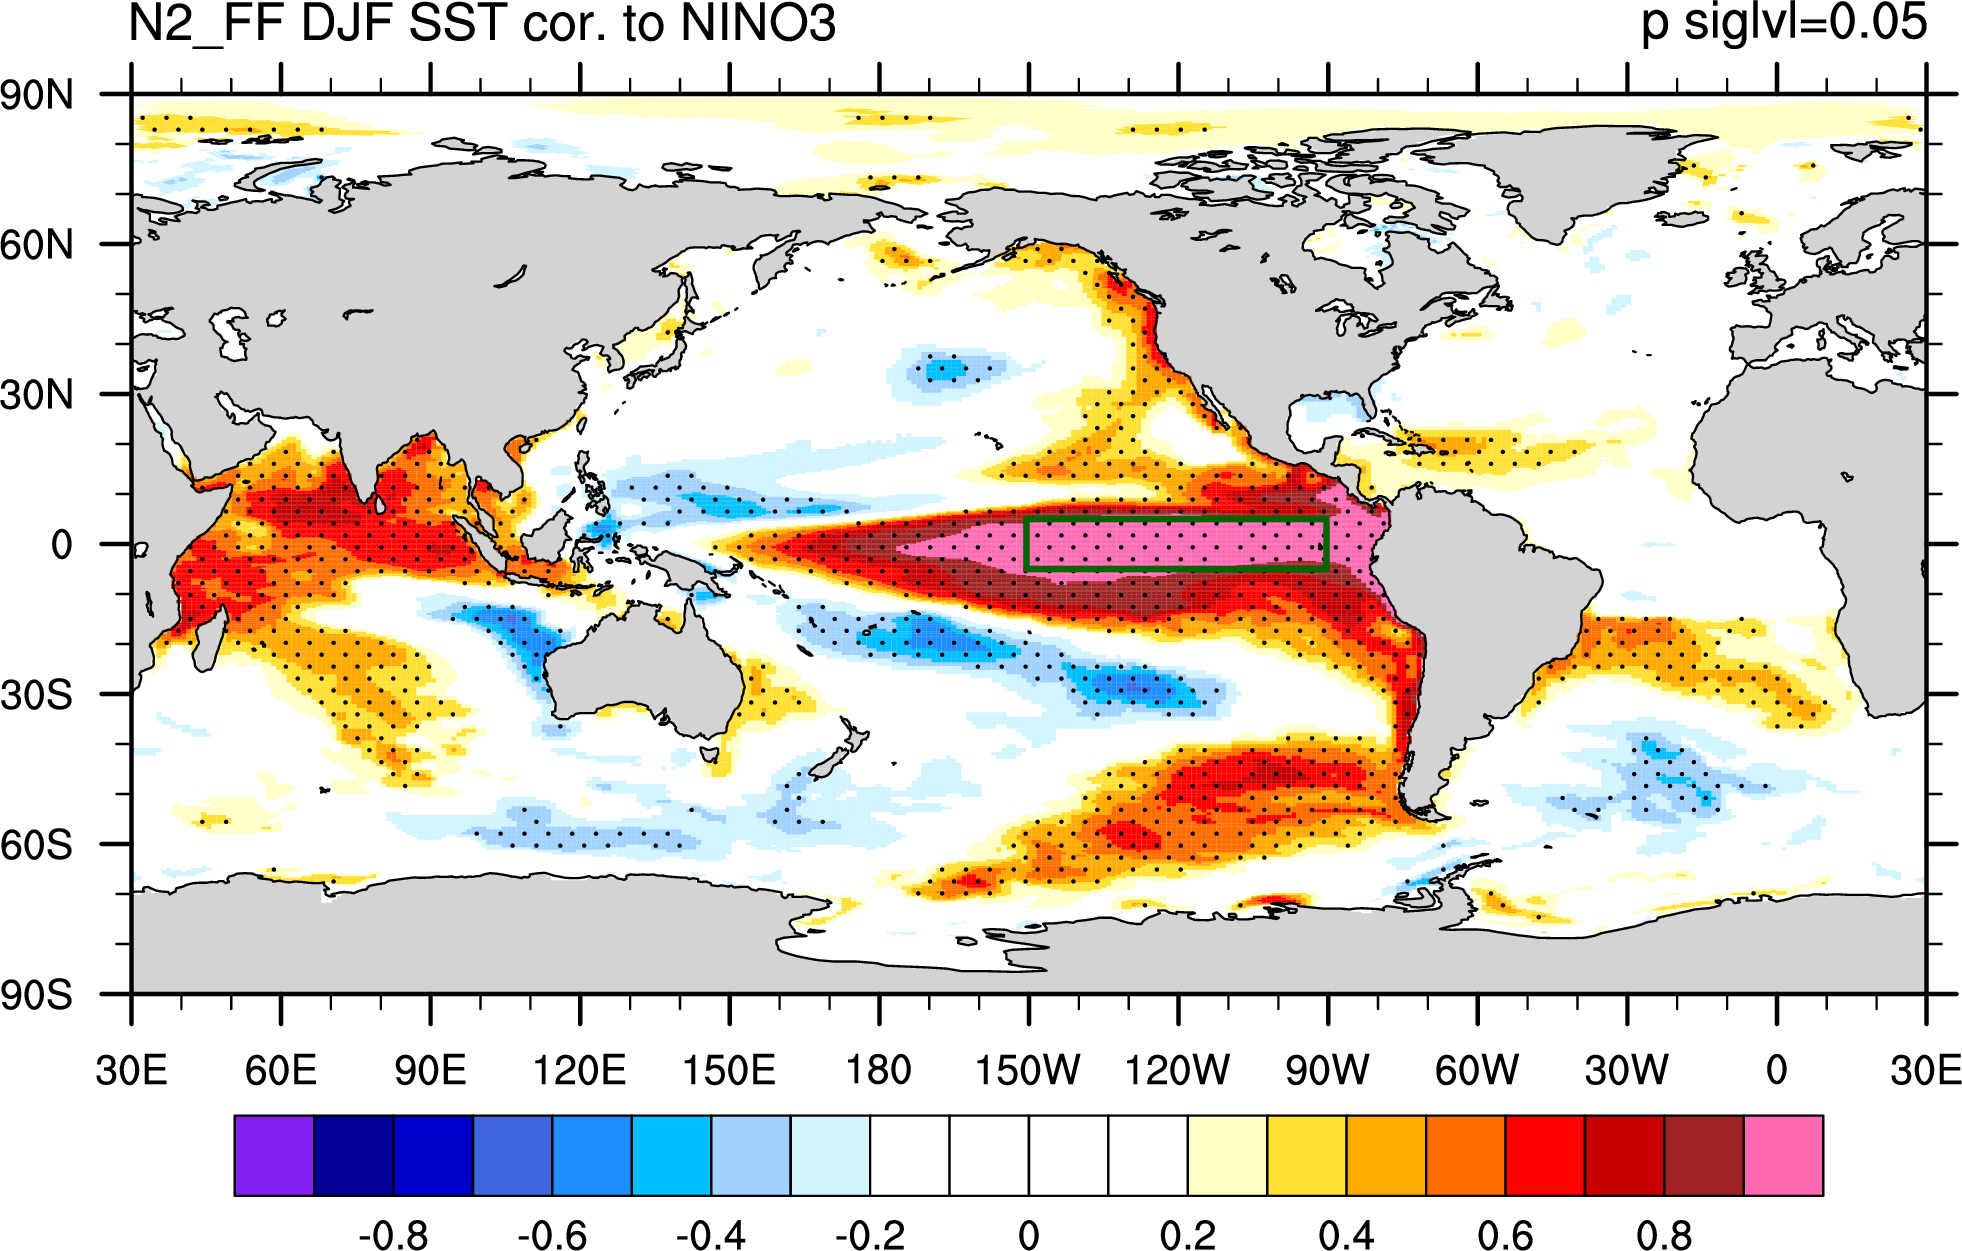
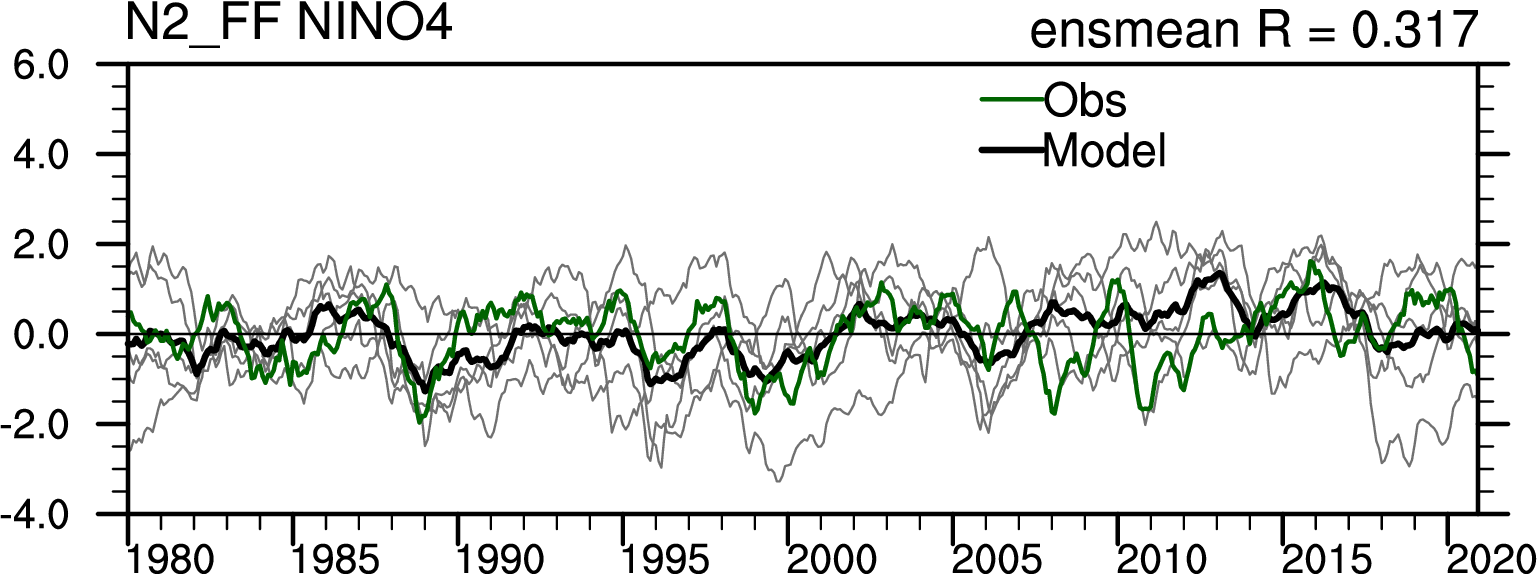
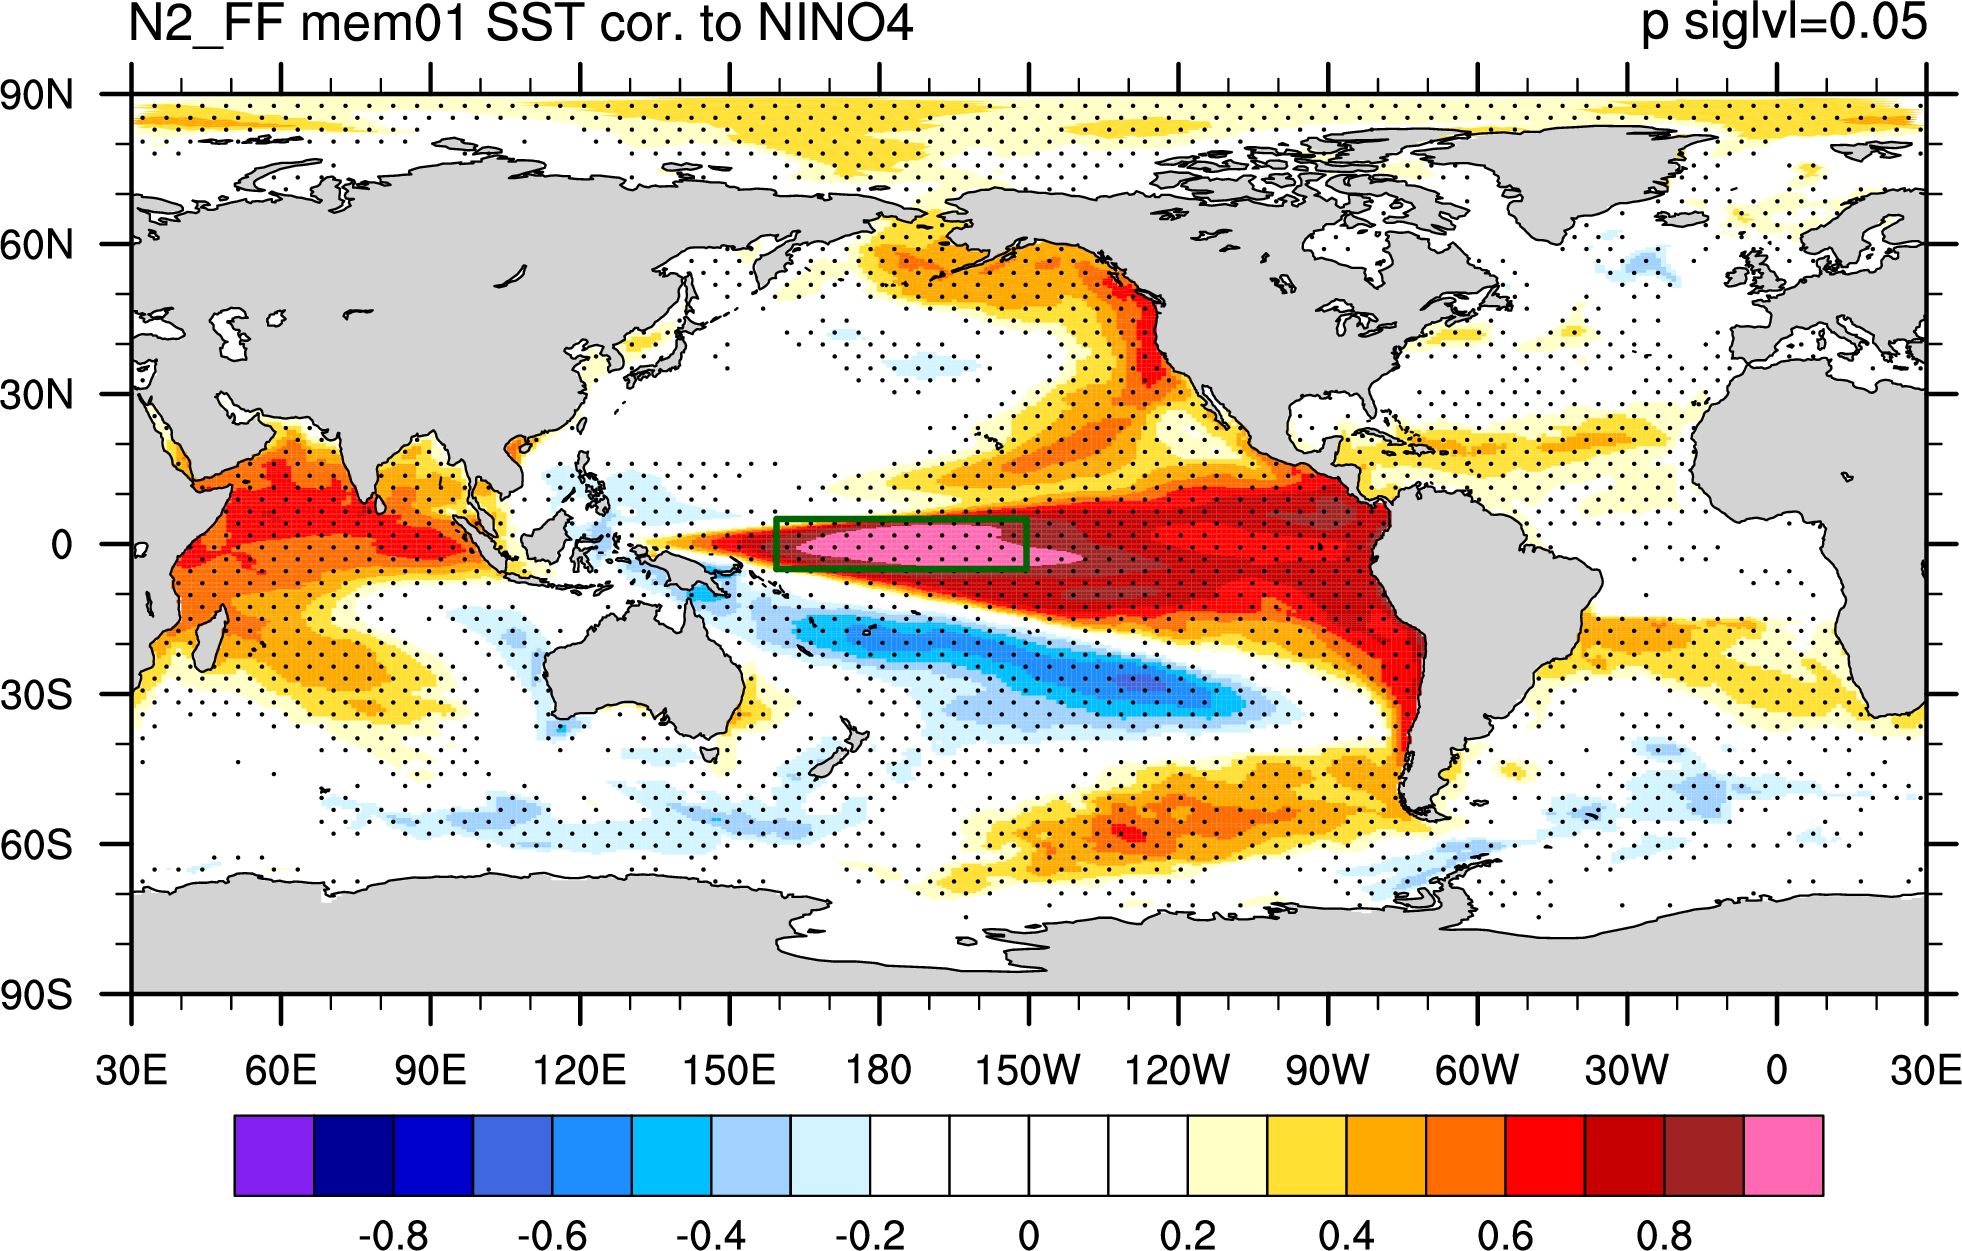
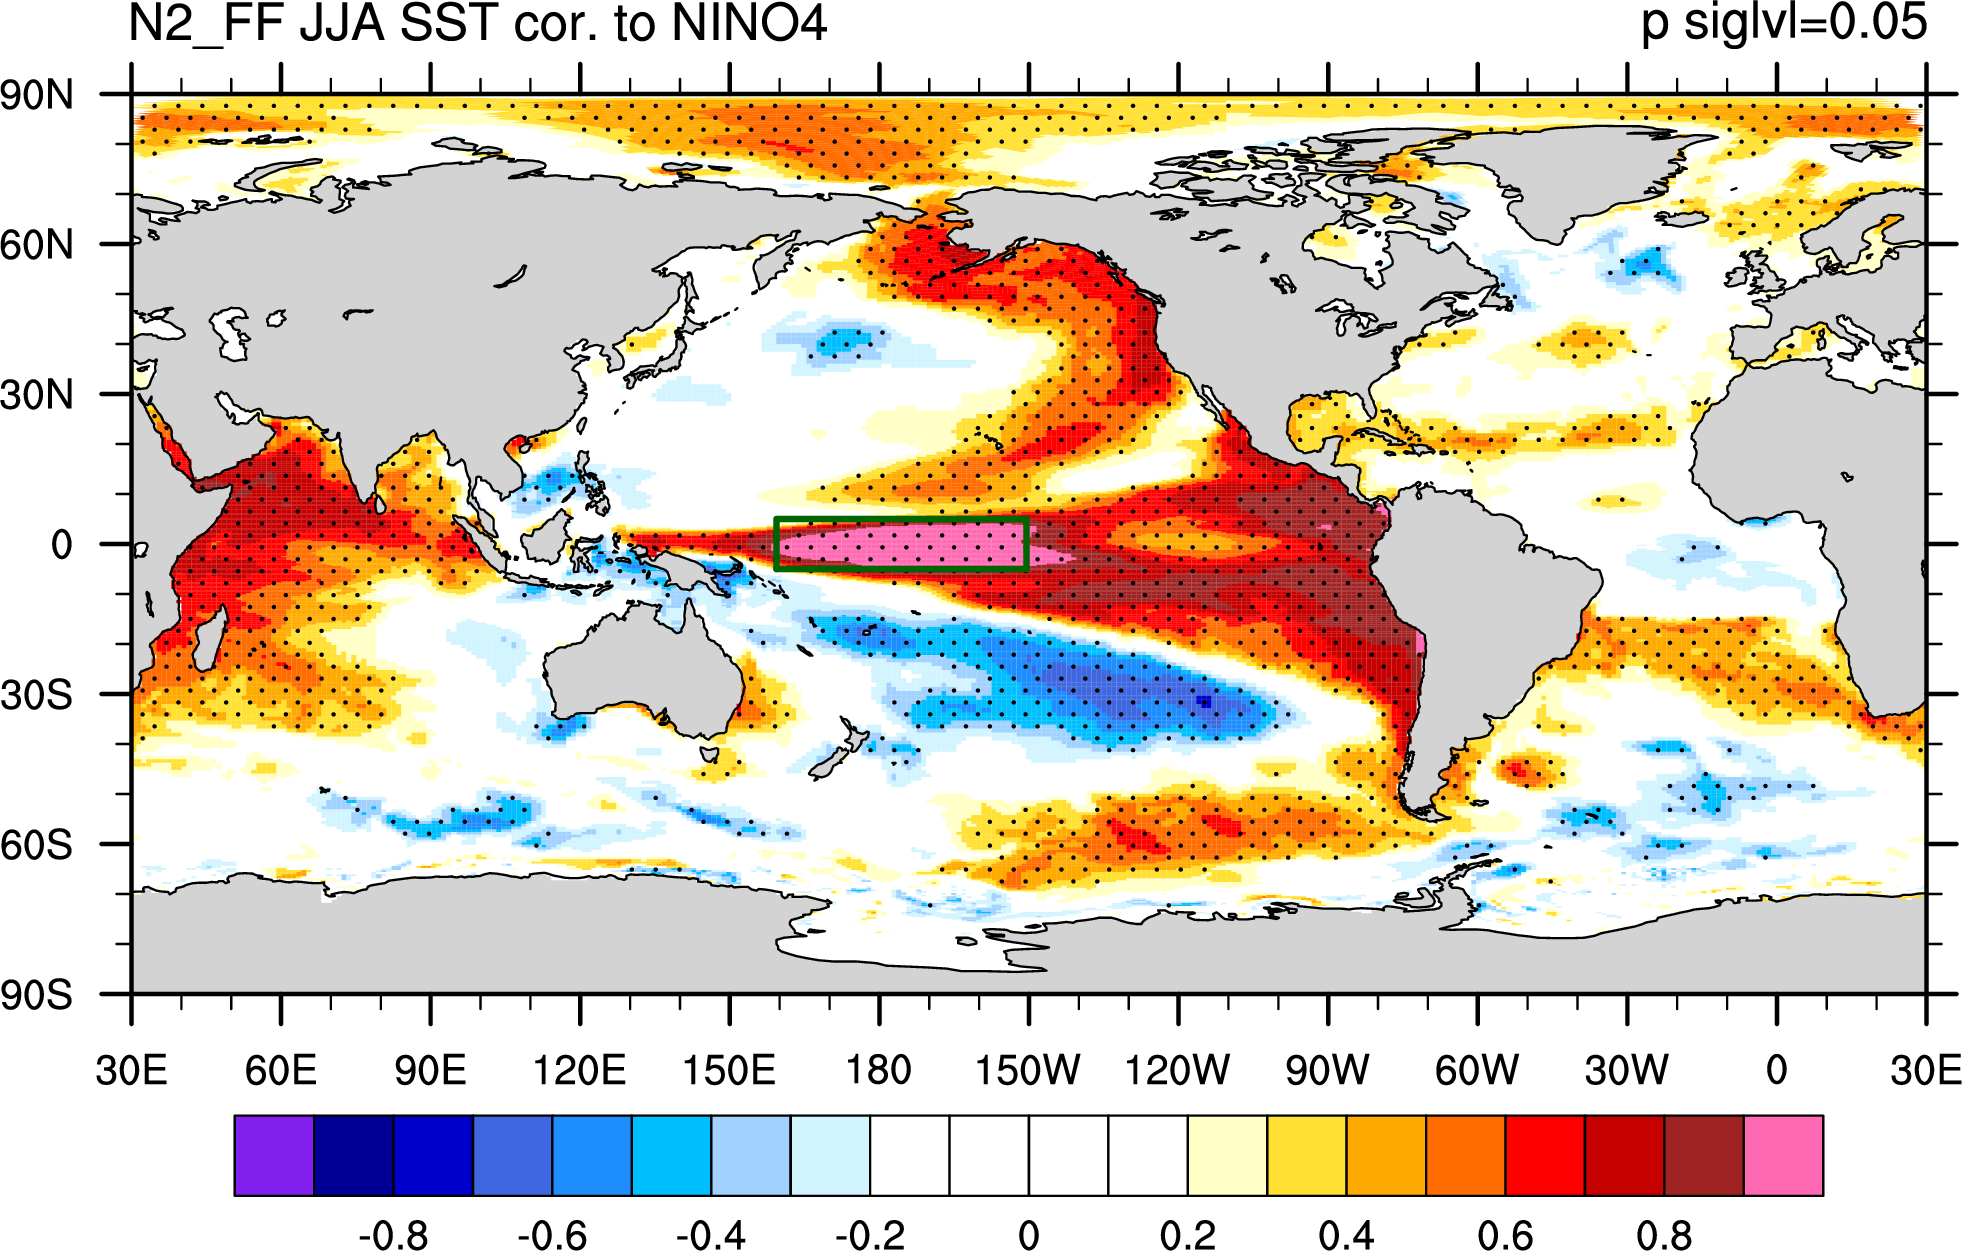
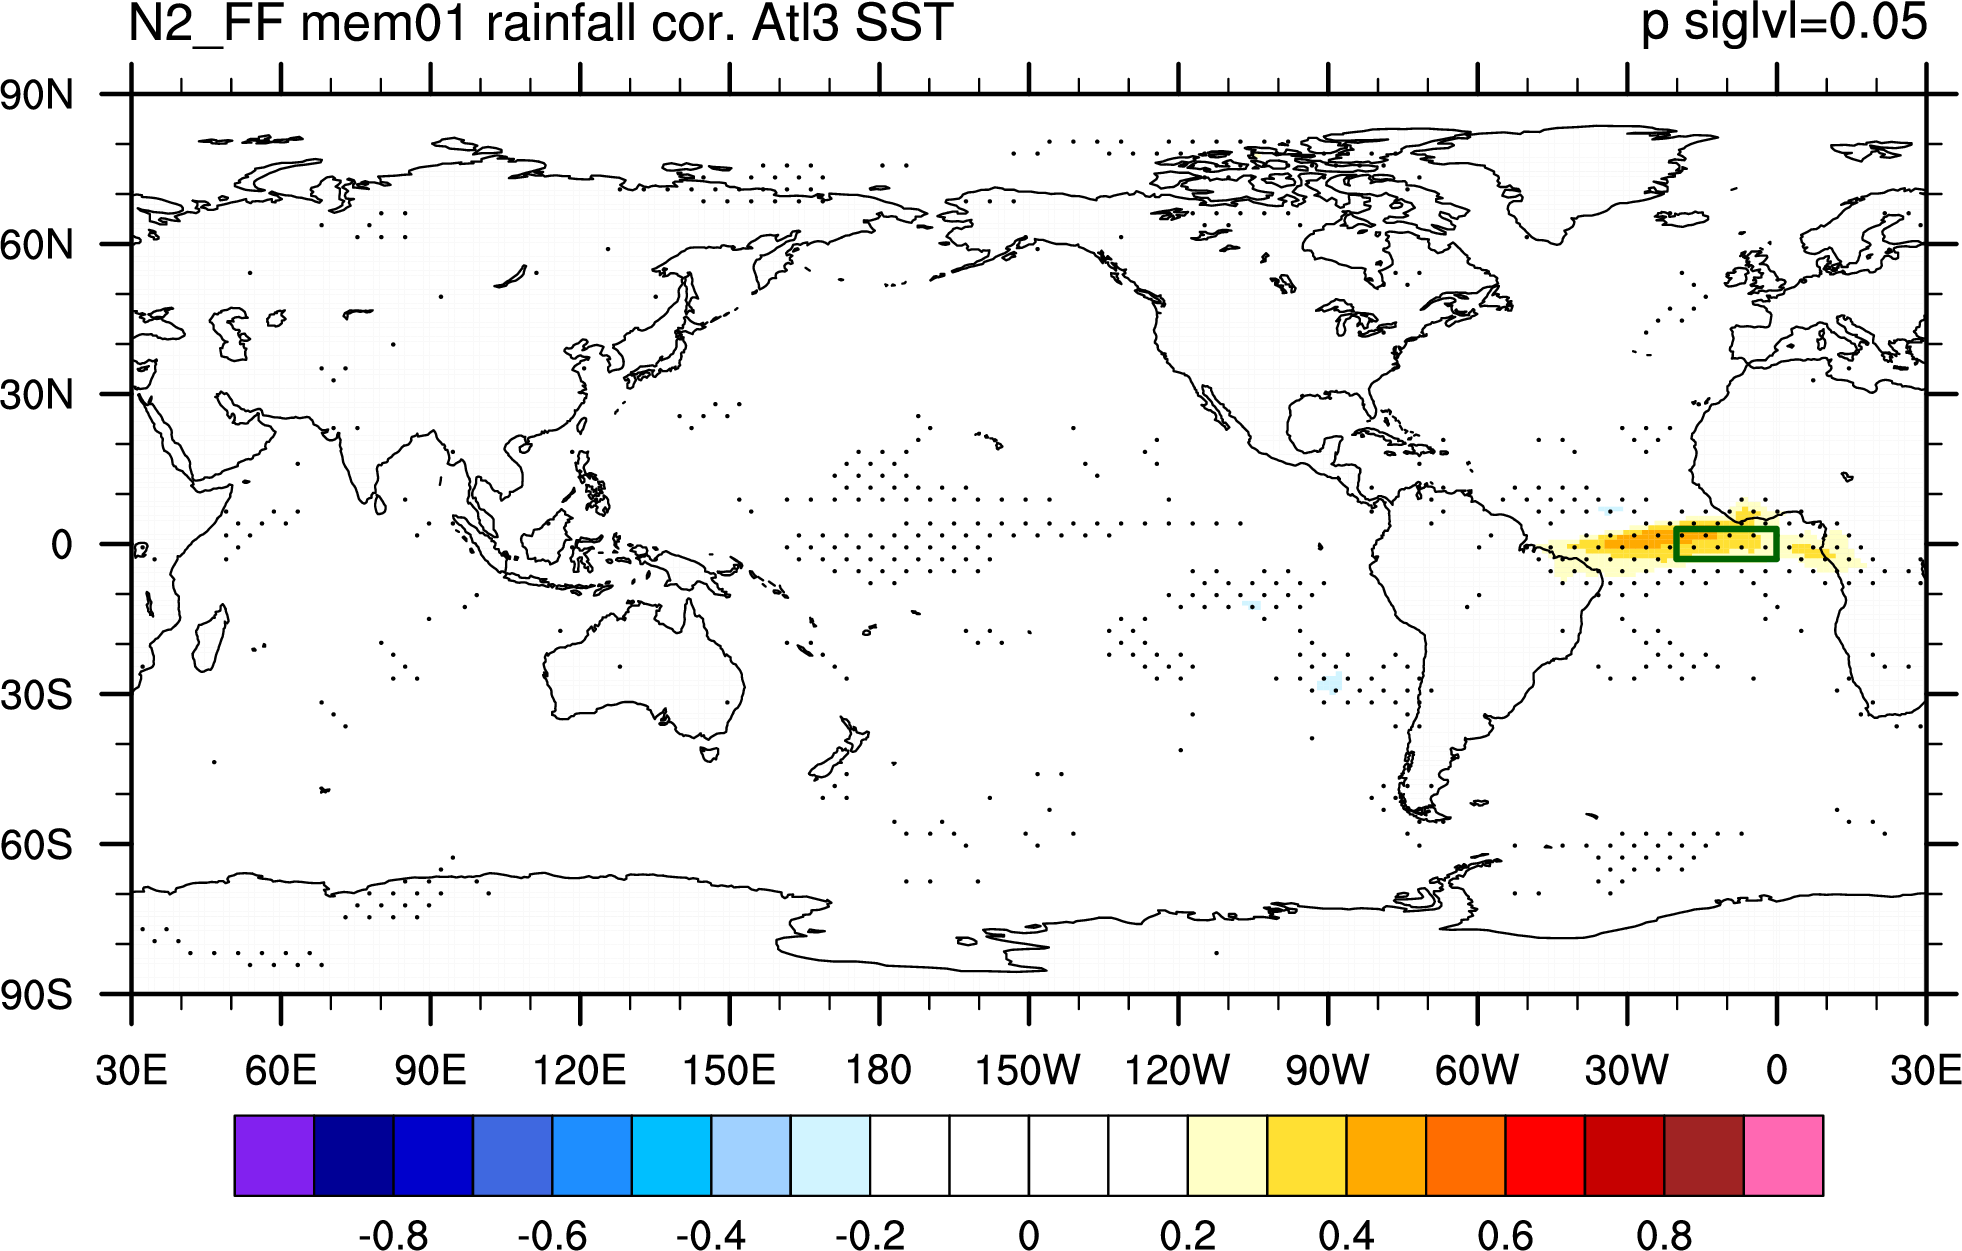
N2_FF sst correlation plots
Period is 1980 to 2020
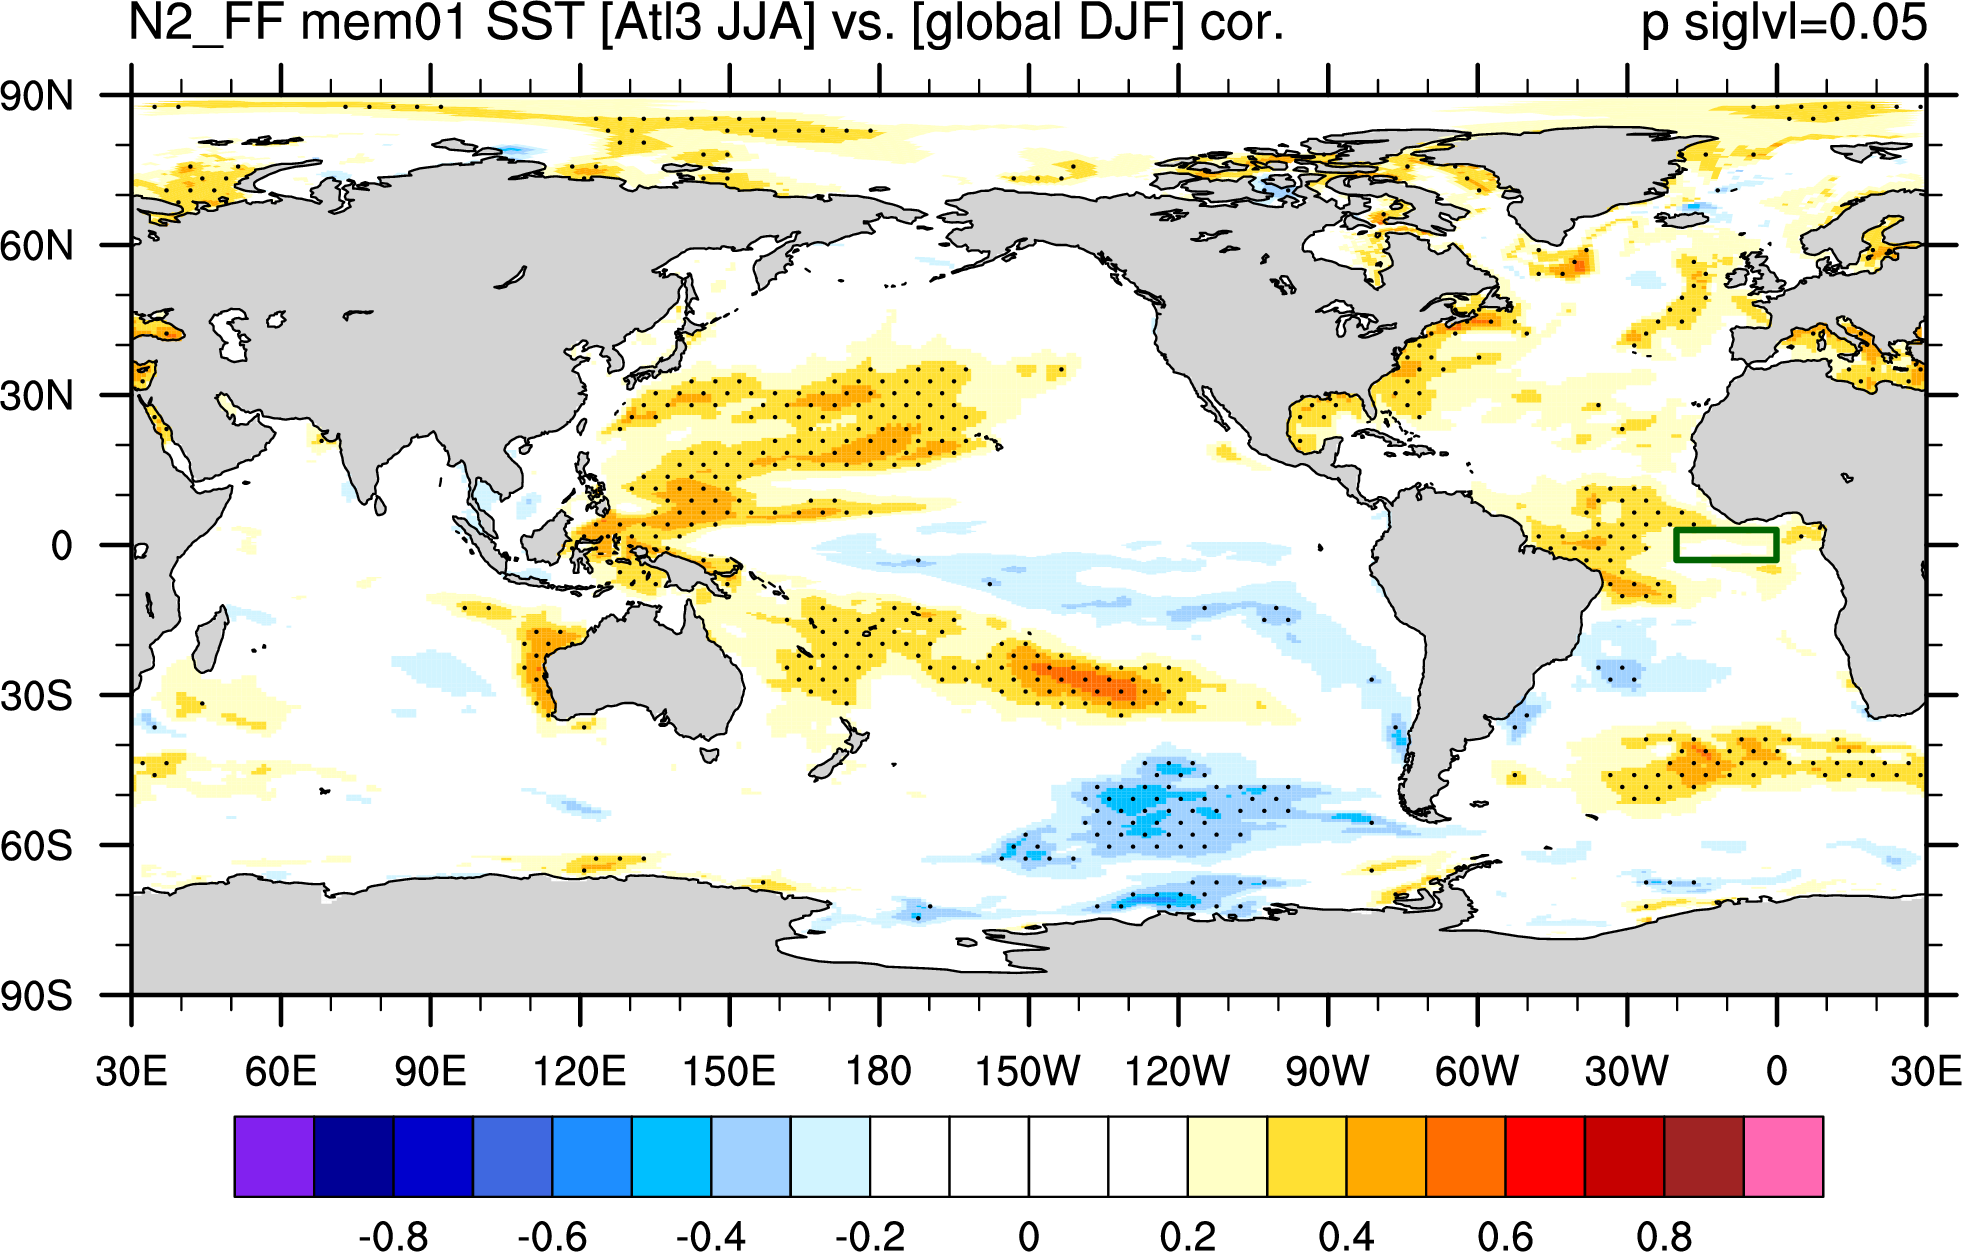
| Most of the figs are use 1st member | |||||
|---|---|---|---|---|---|
| Correlation of global and regional mean | |||||
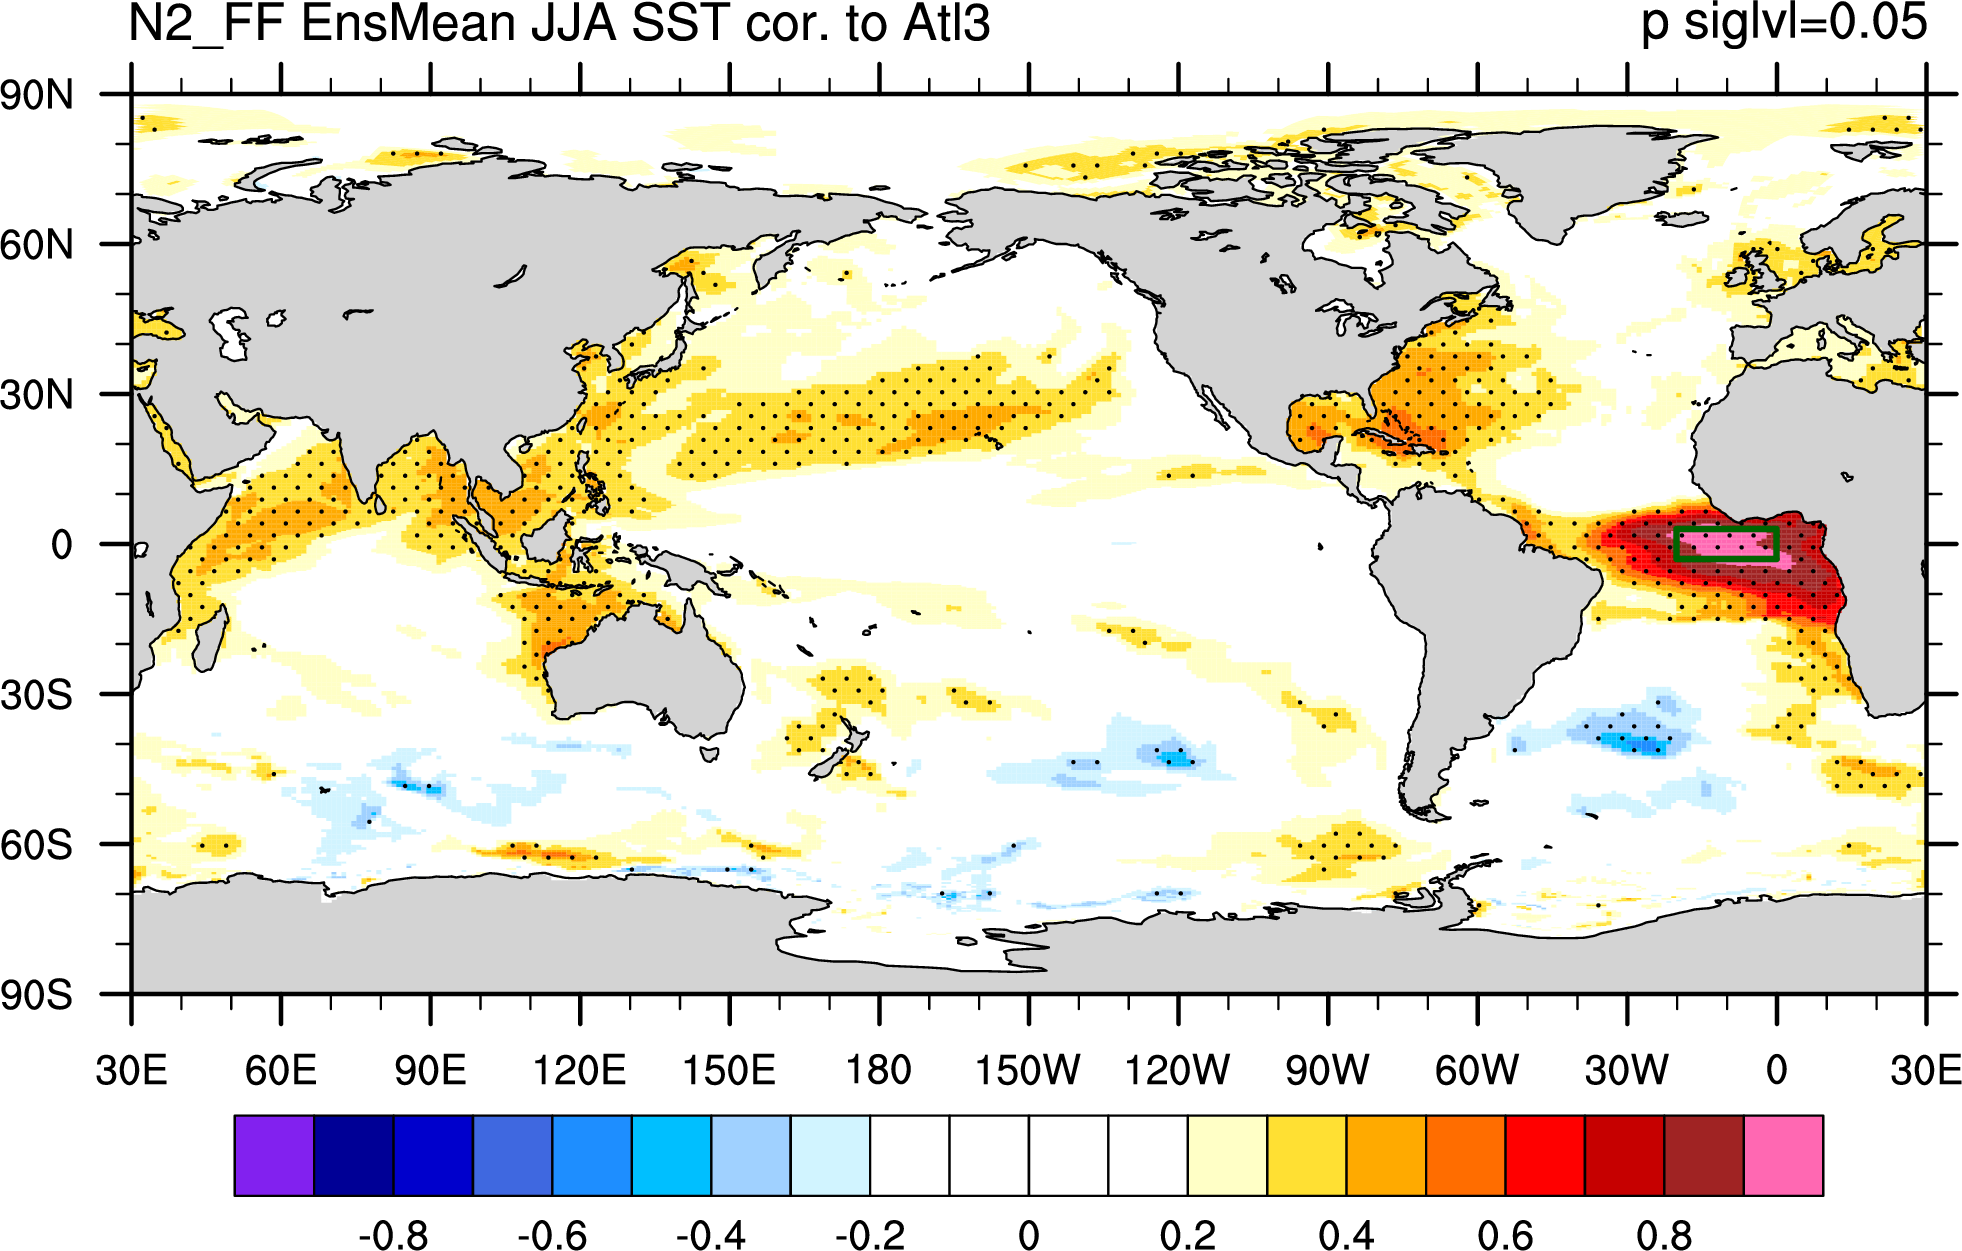
| Atl3 | |||||
|
|||||
| seasonal | seasonal remove | ||||
|
|
||||
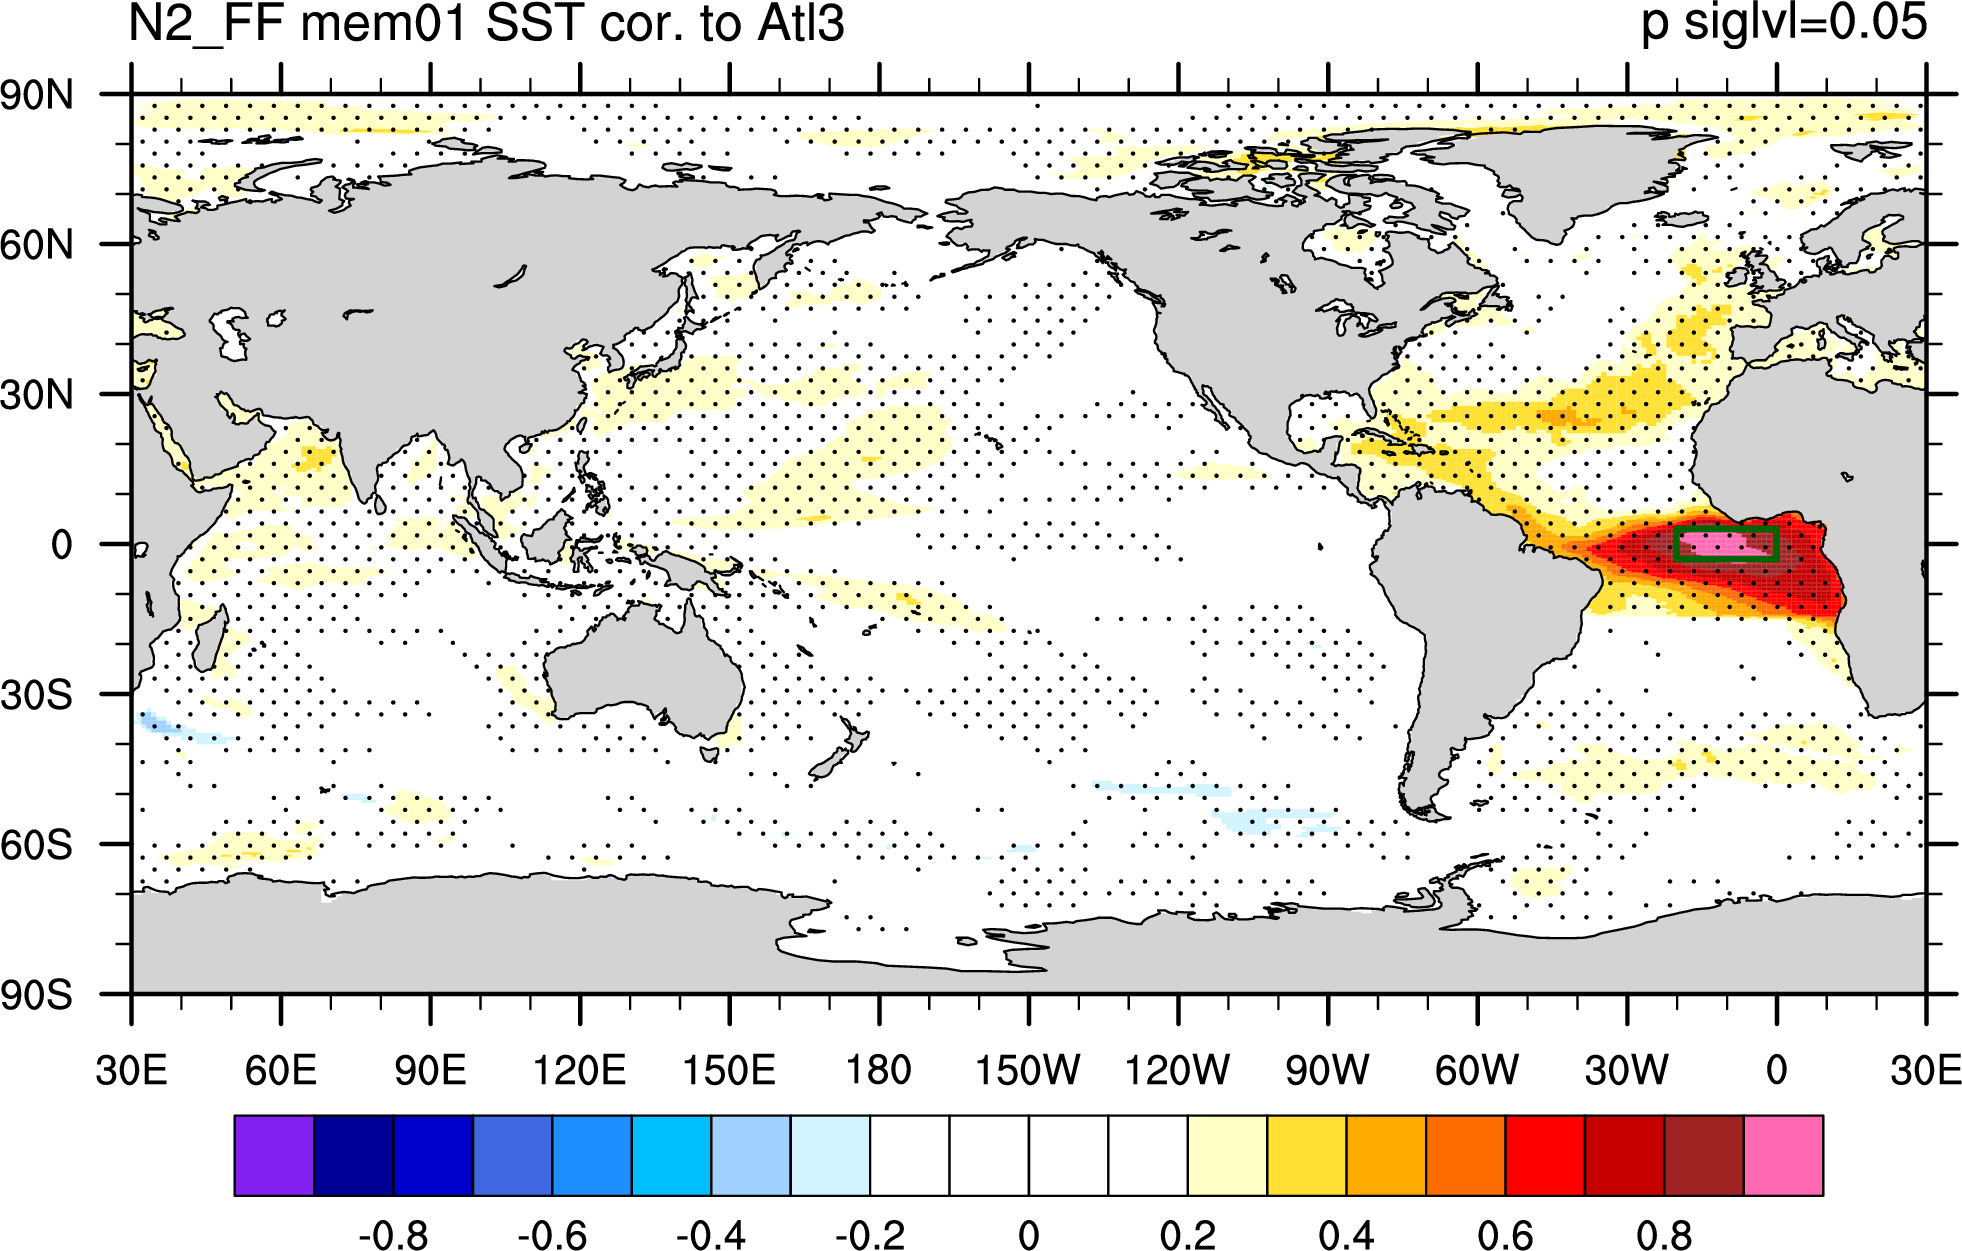
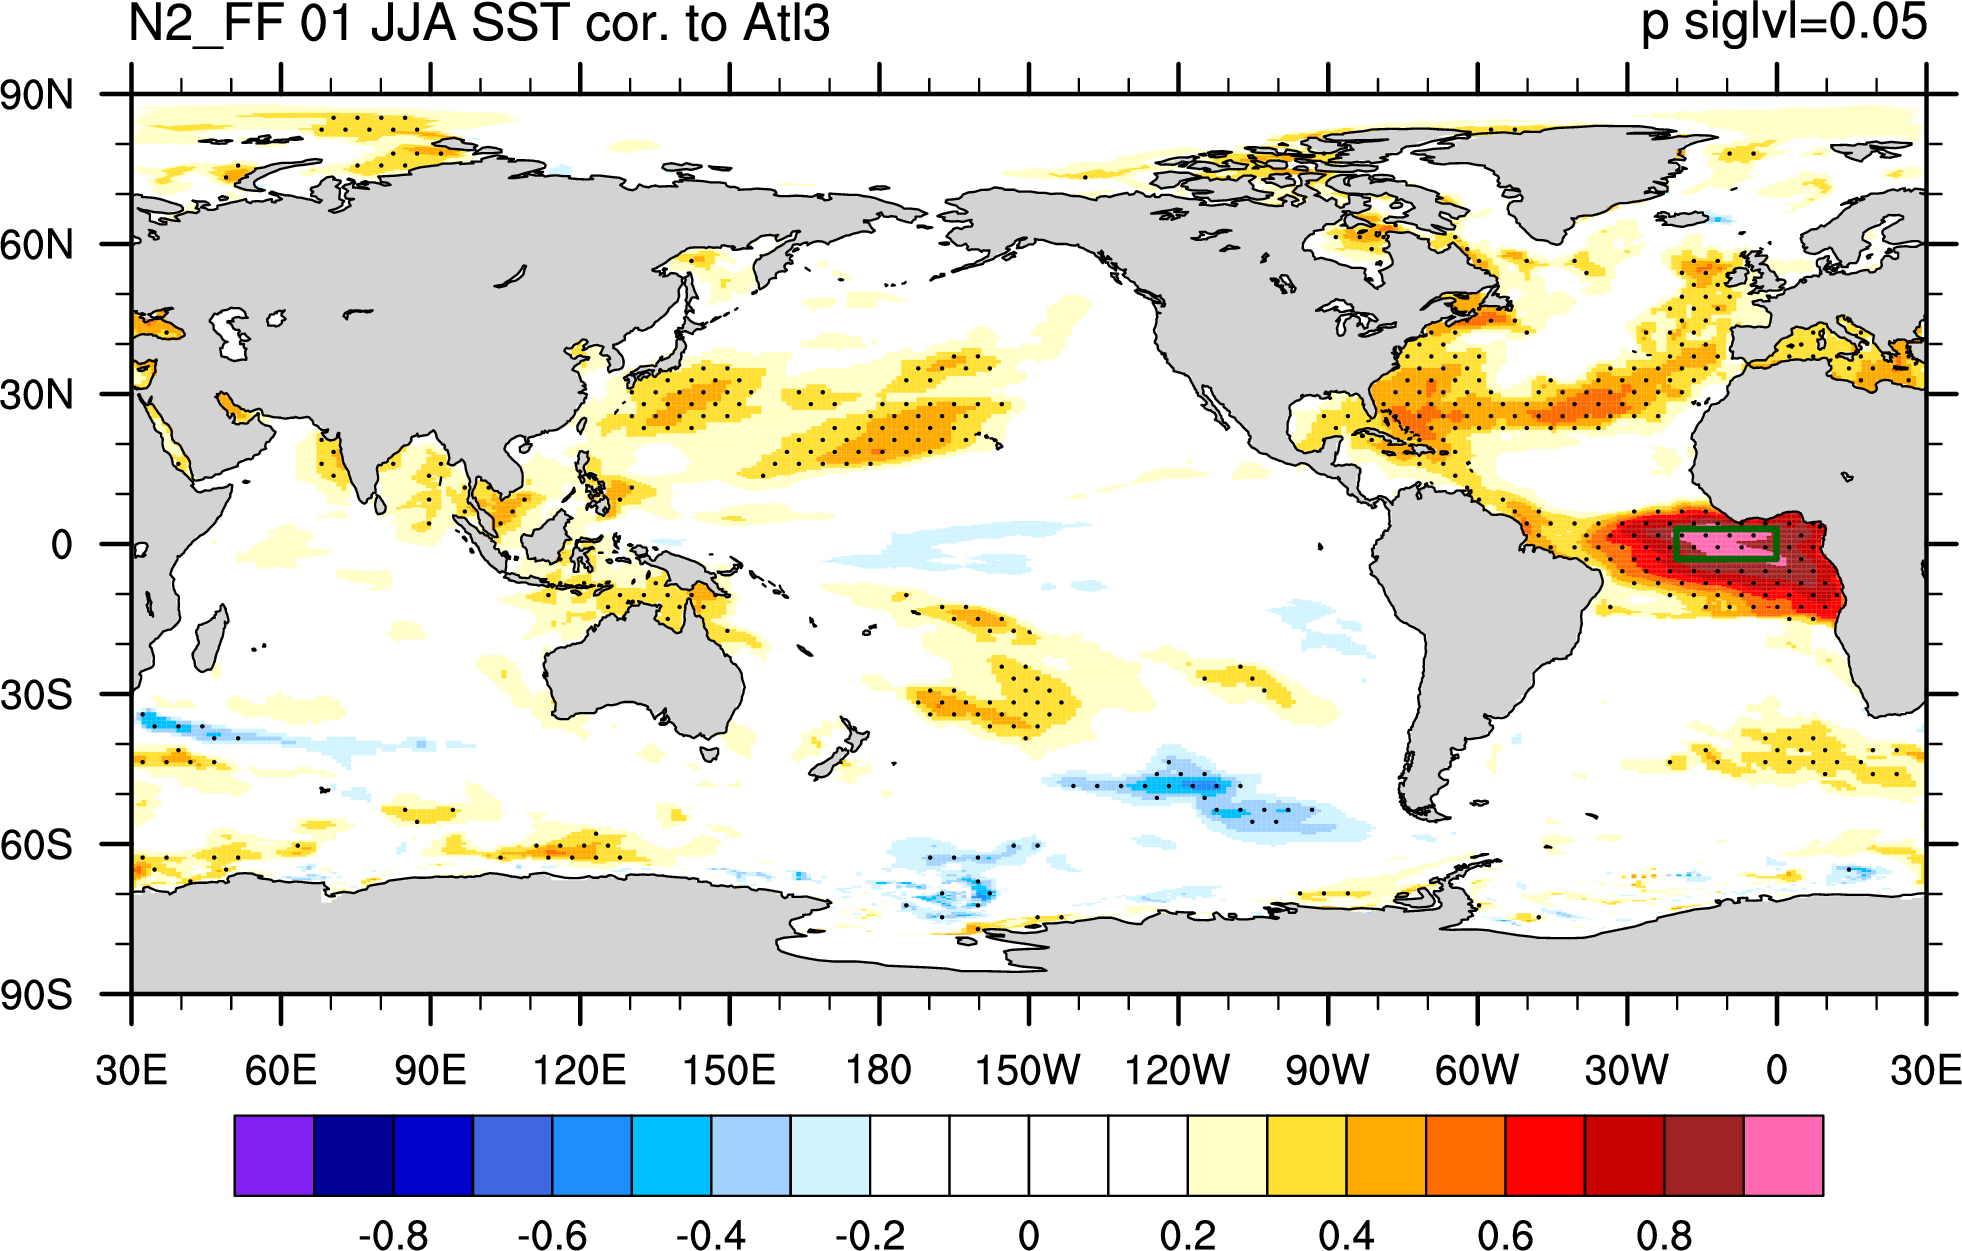
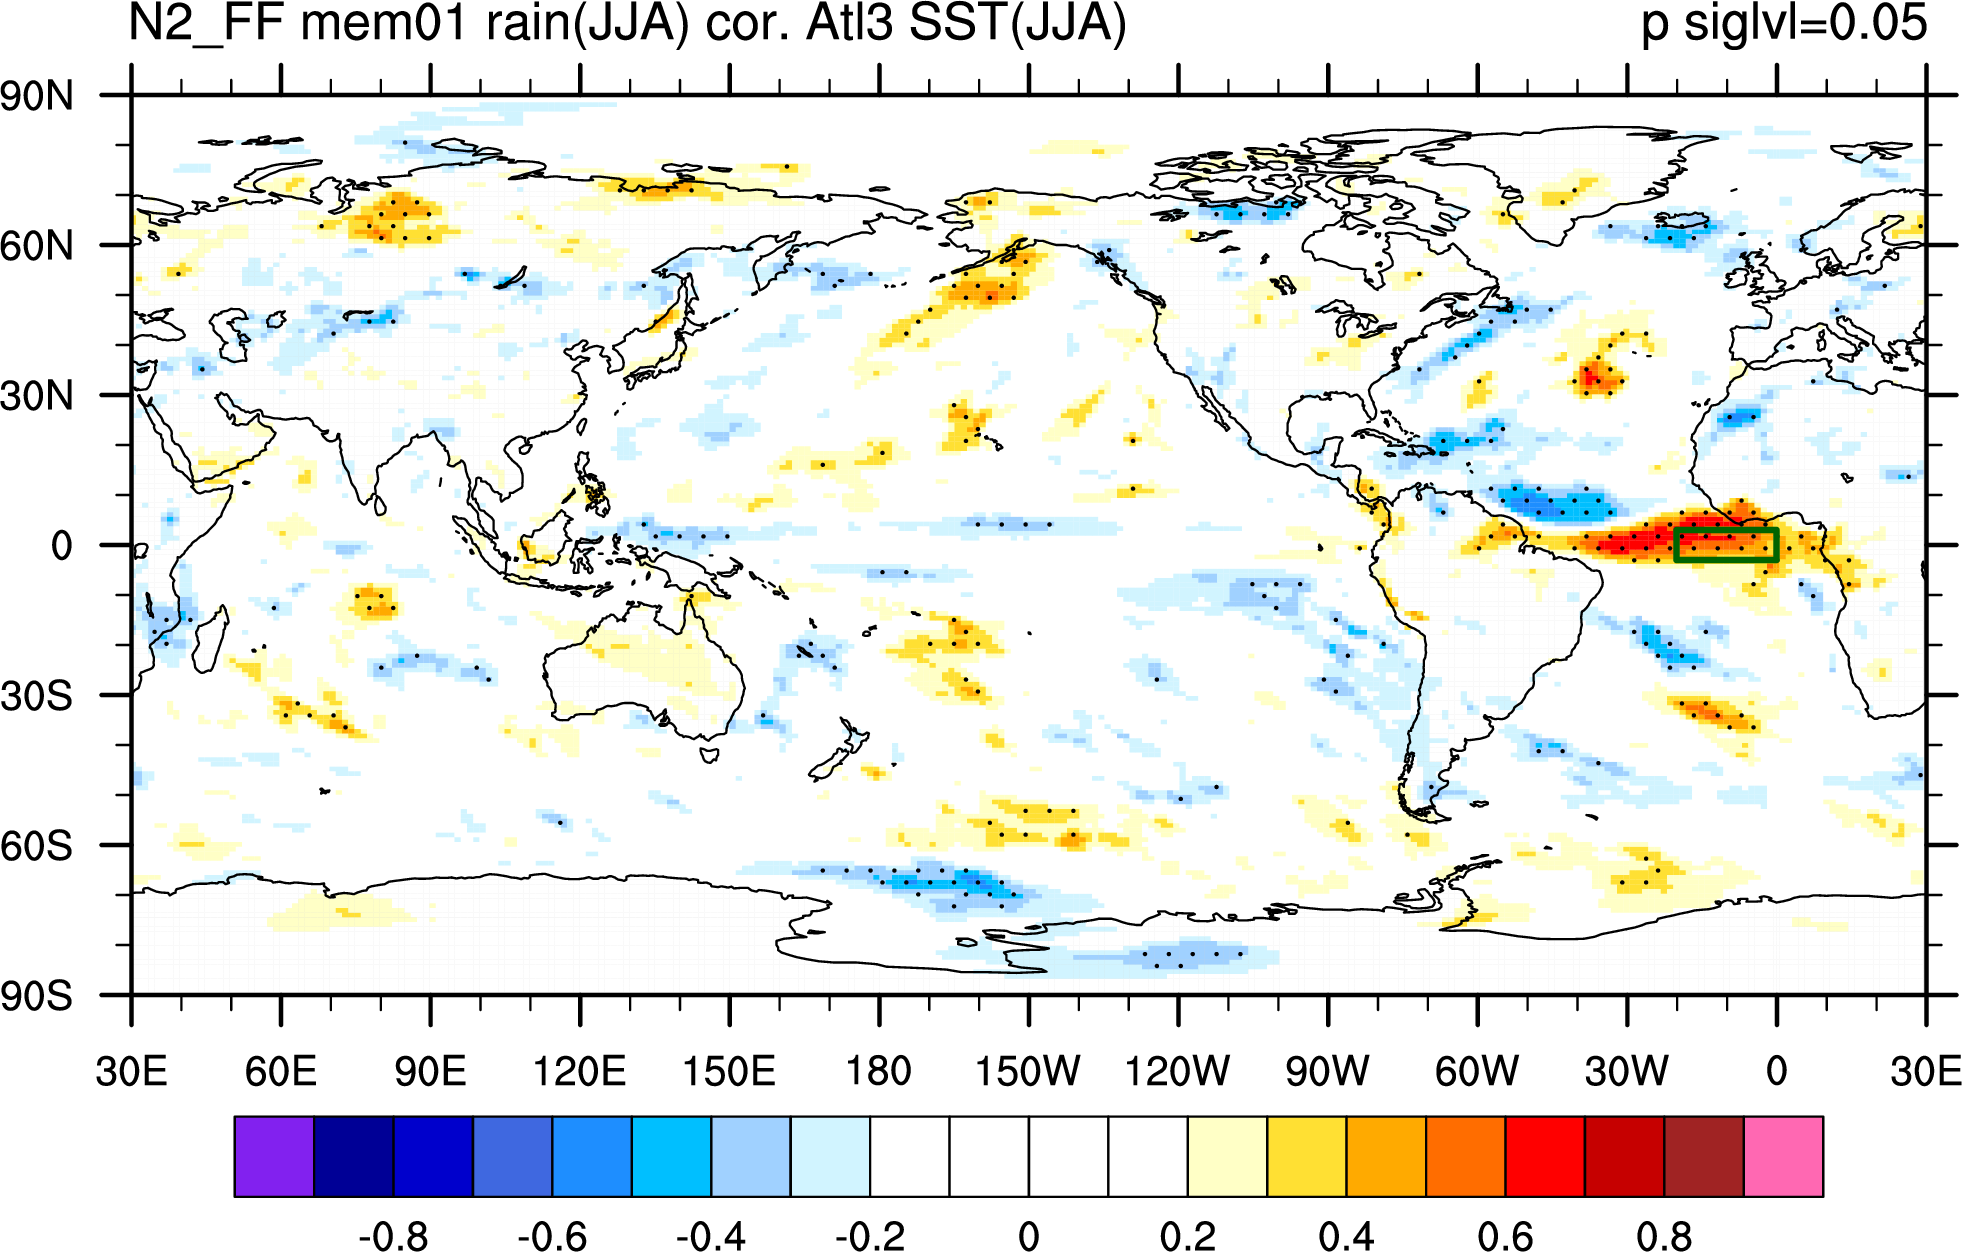
| JJA | |||||
|
|
||||
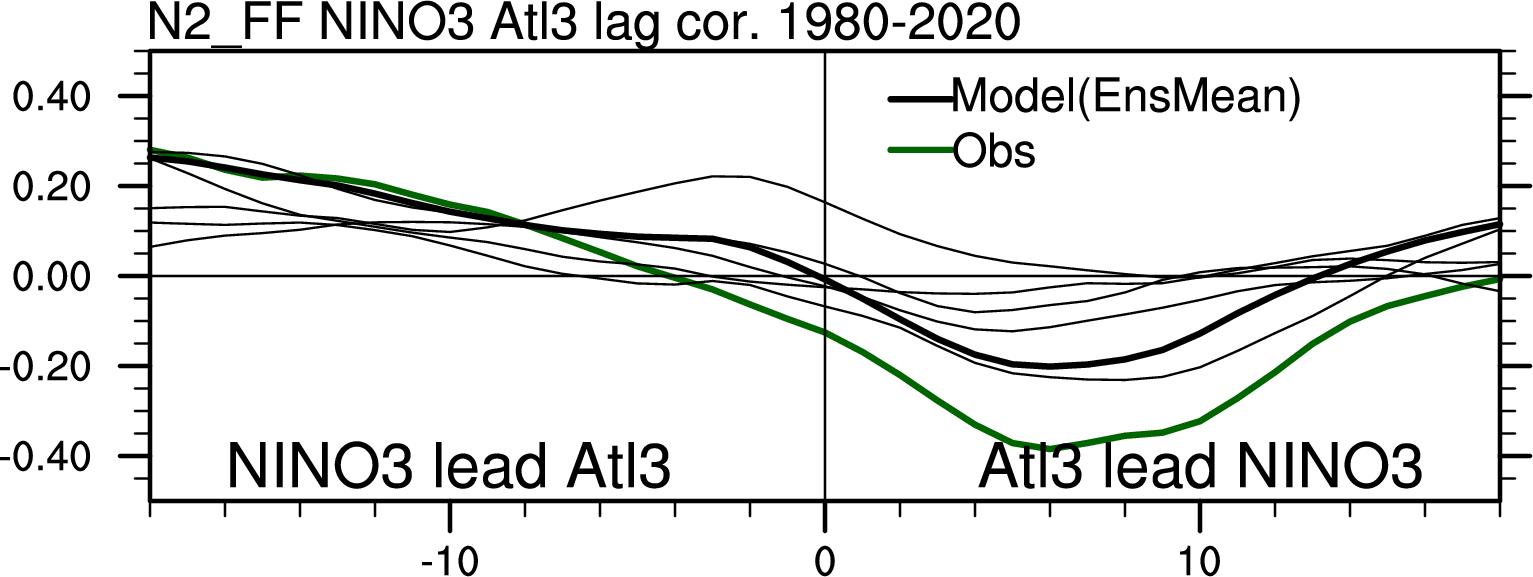
| Monthly Lag-Cor. of Atl3 vs. NINO3 | NINO4 | ||||
|
lagcor_NINO4_Atl3 | ||||
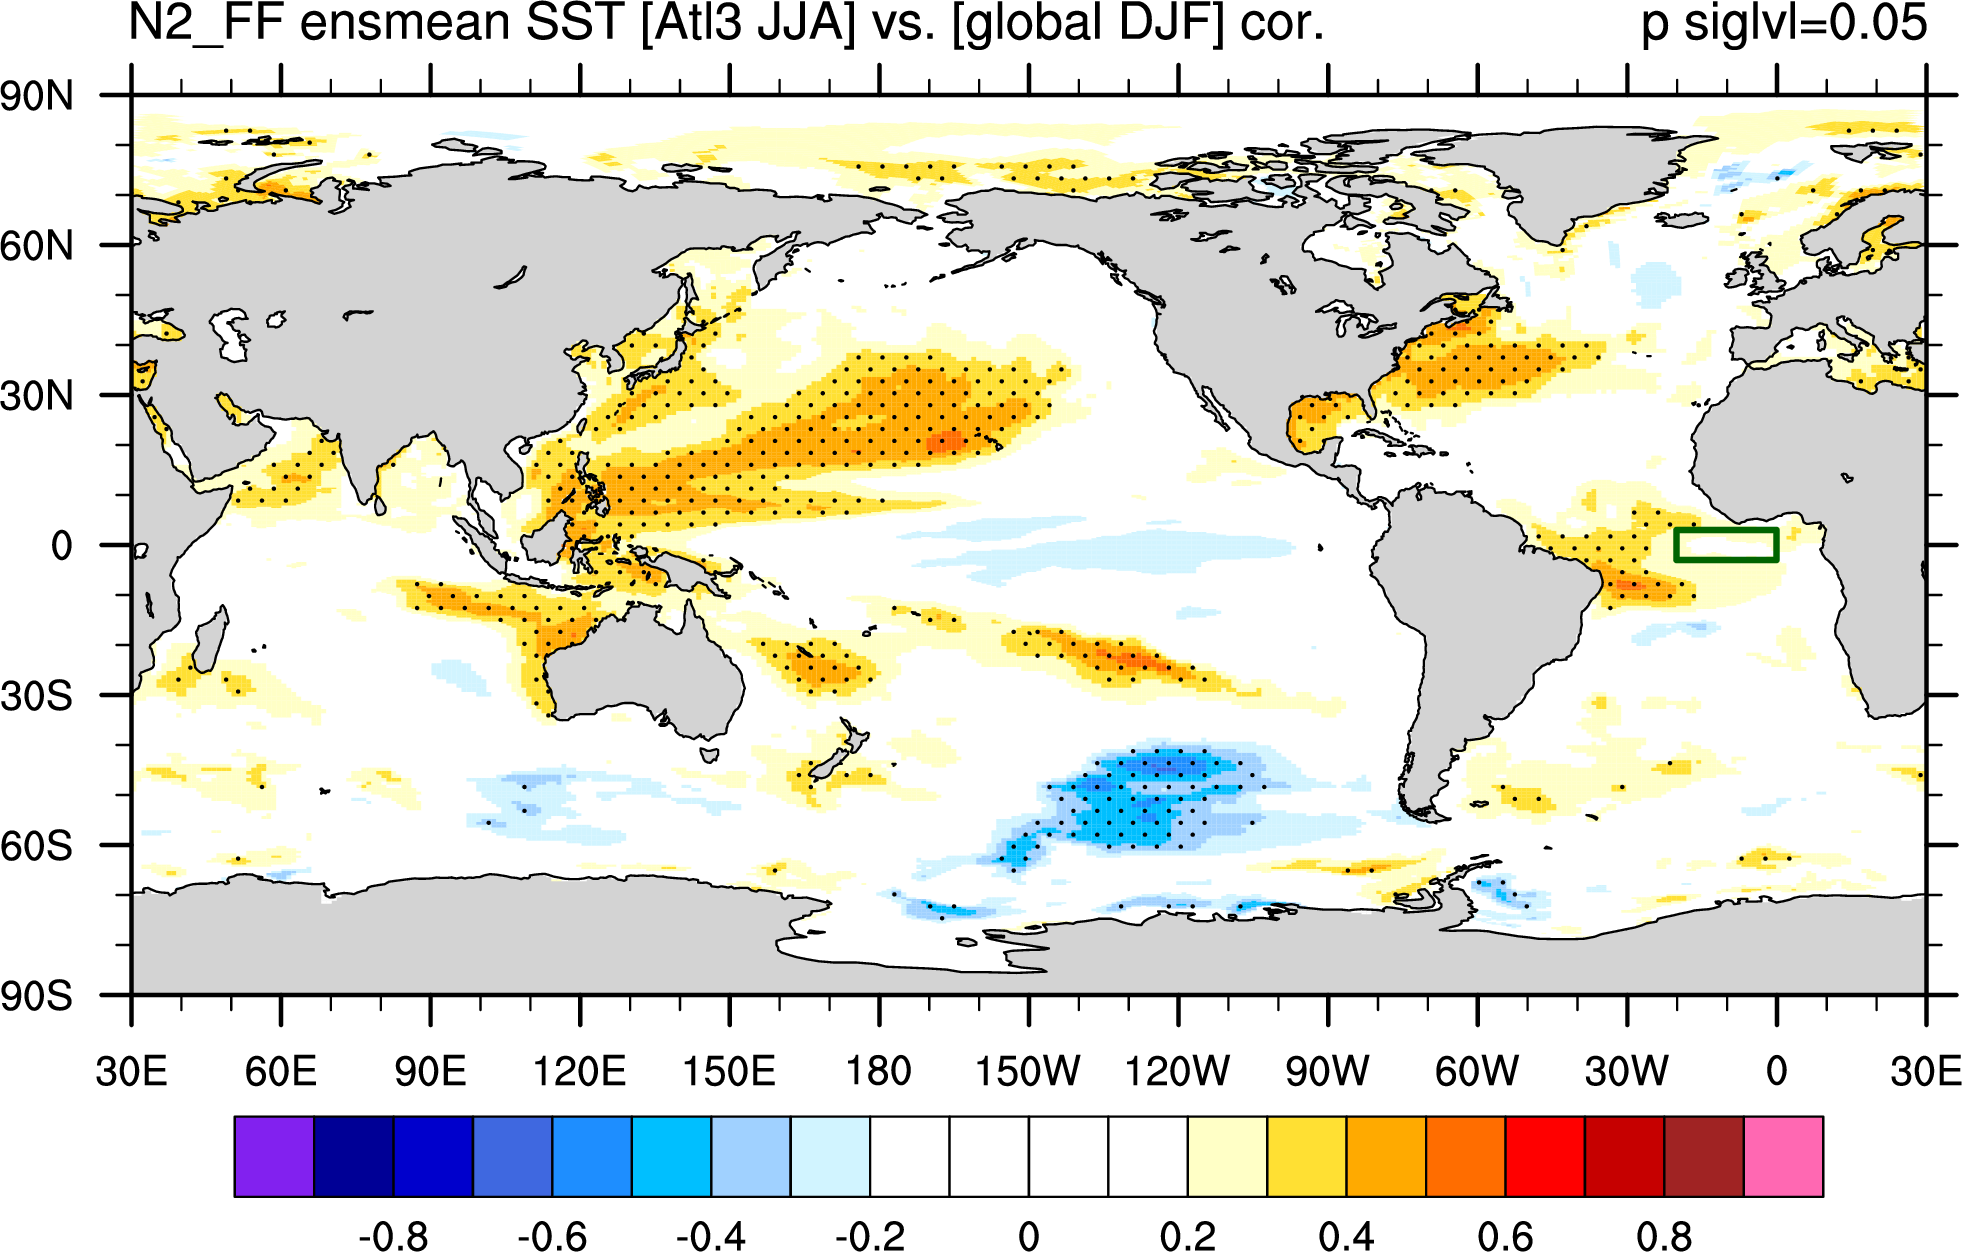
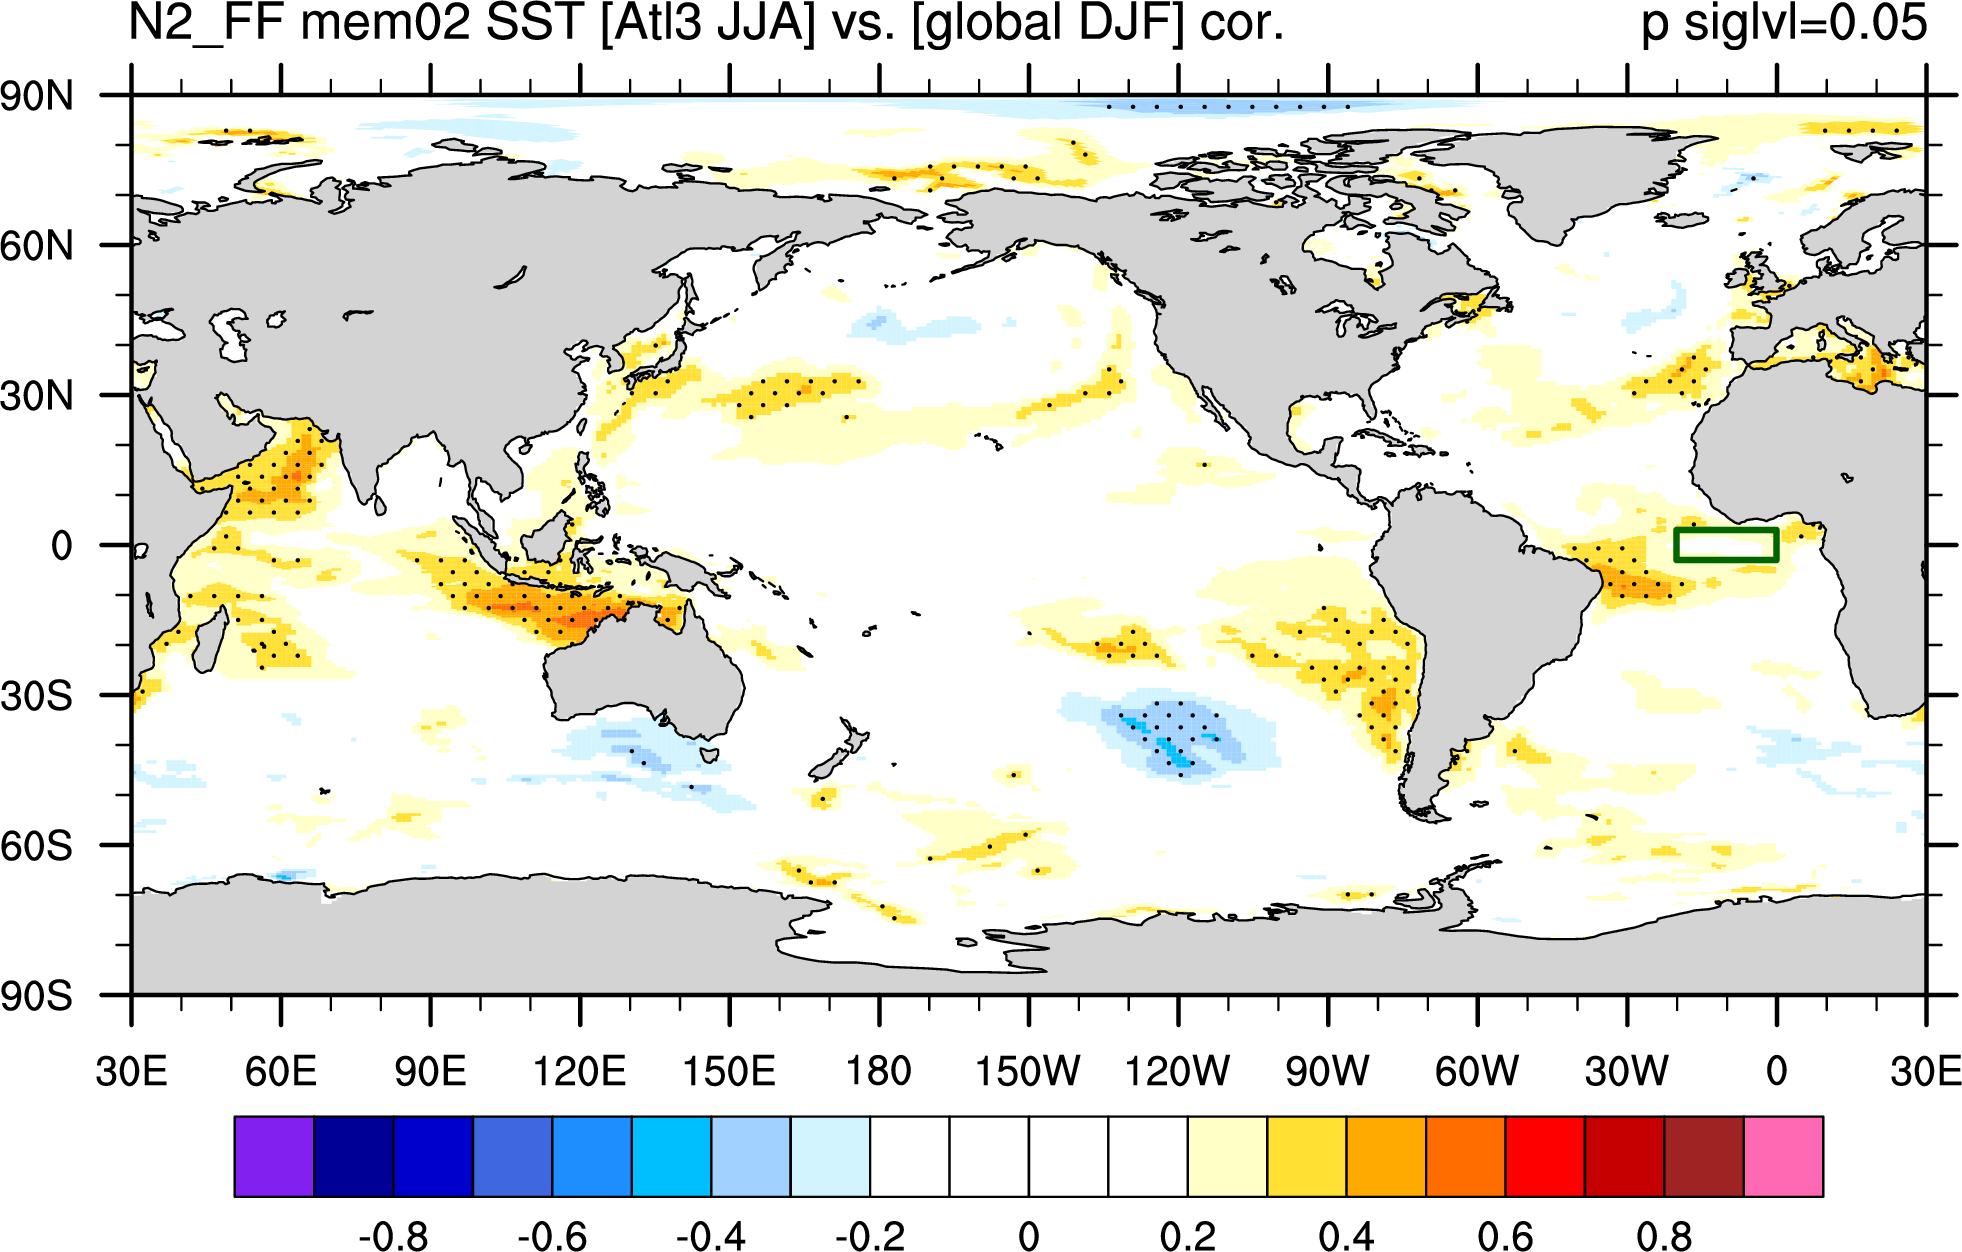
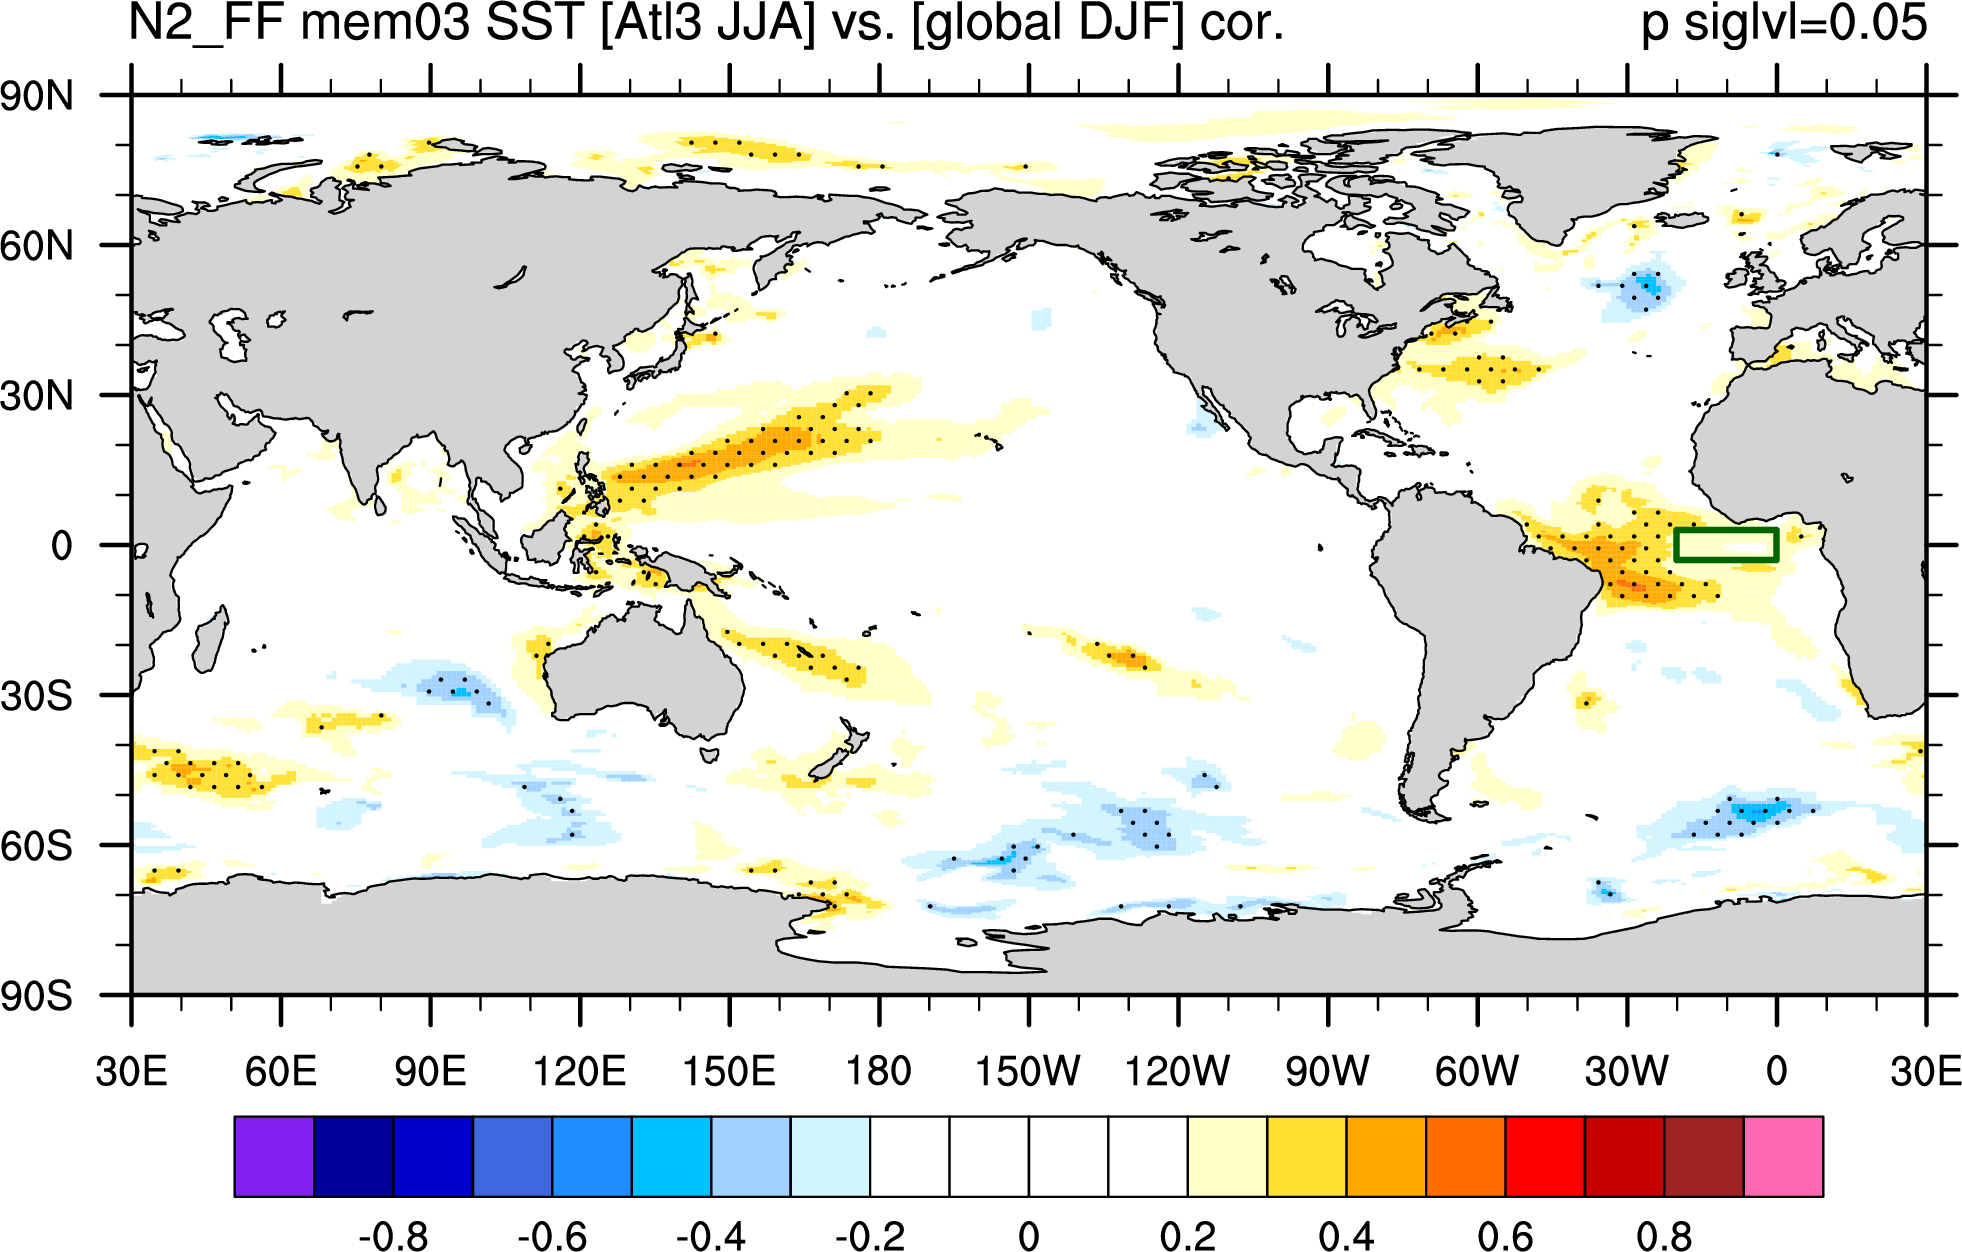
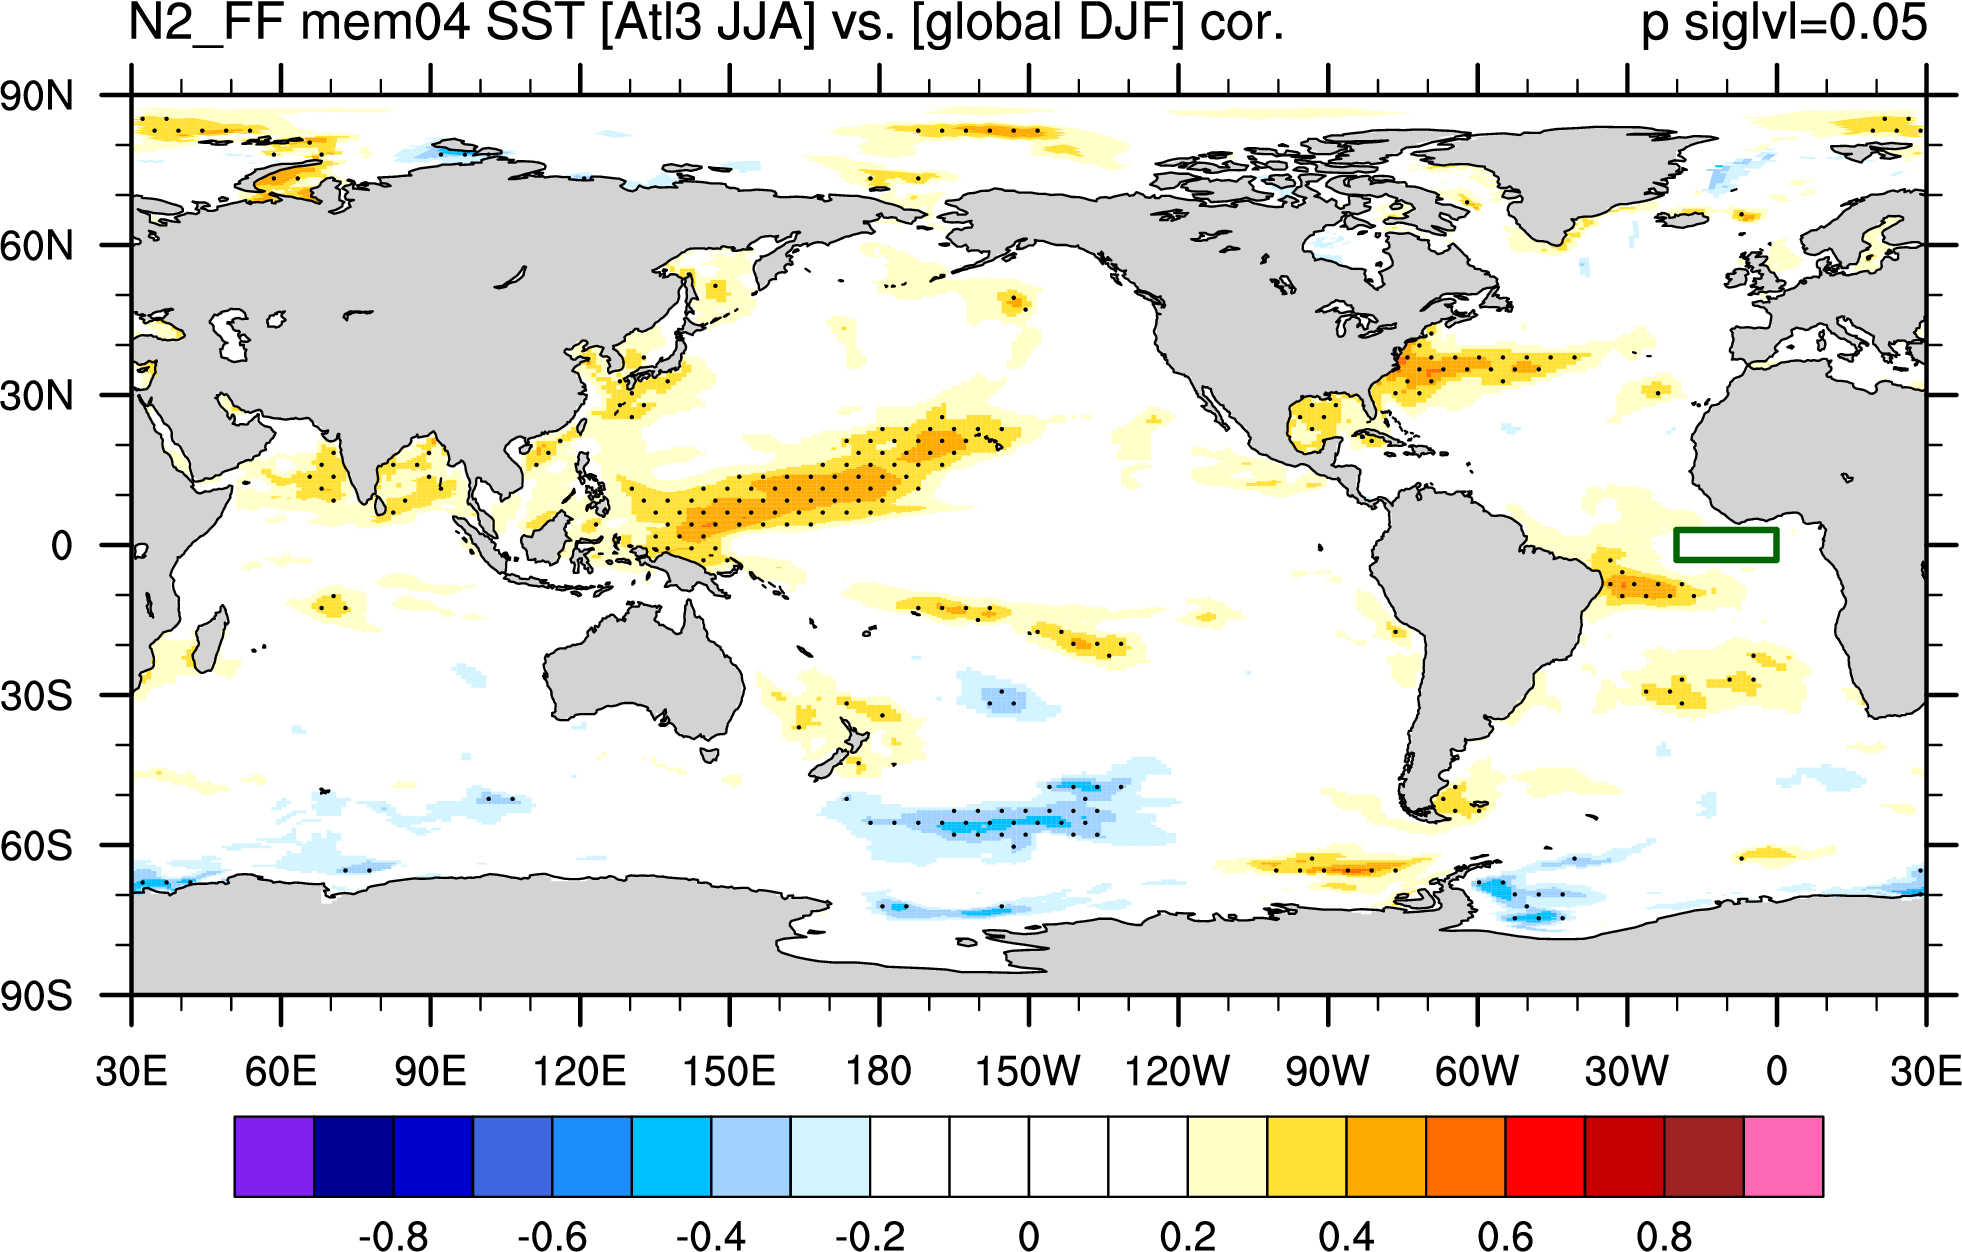
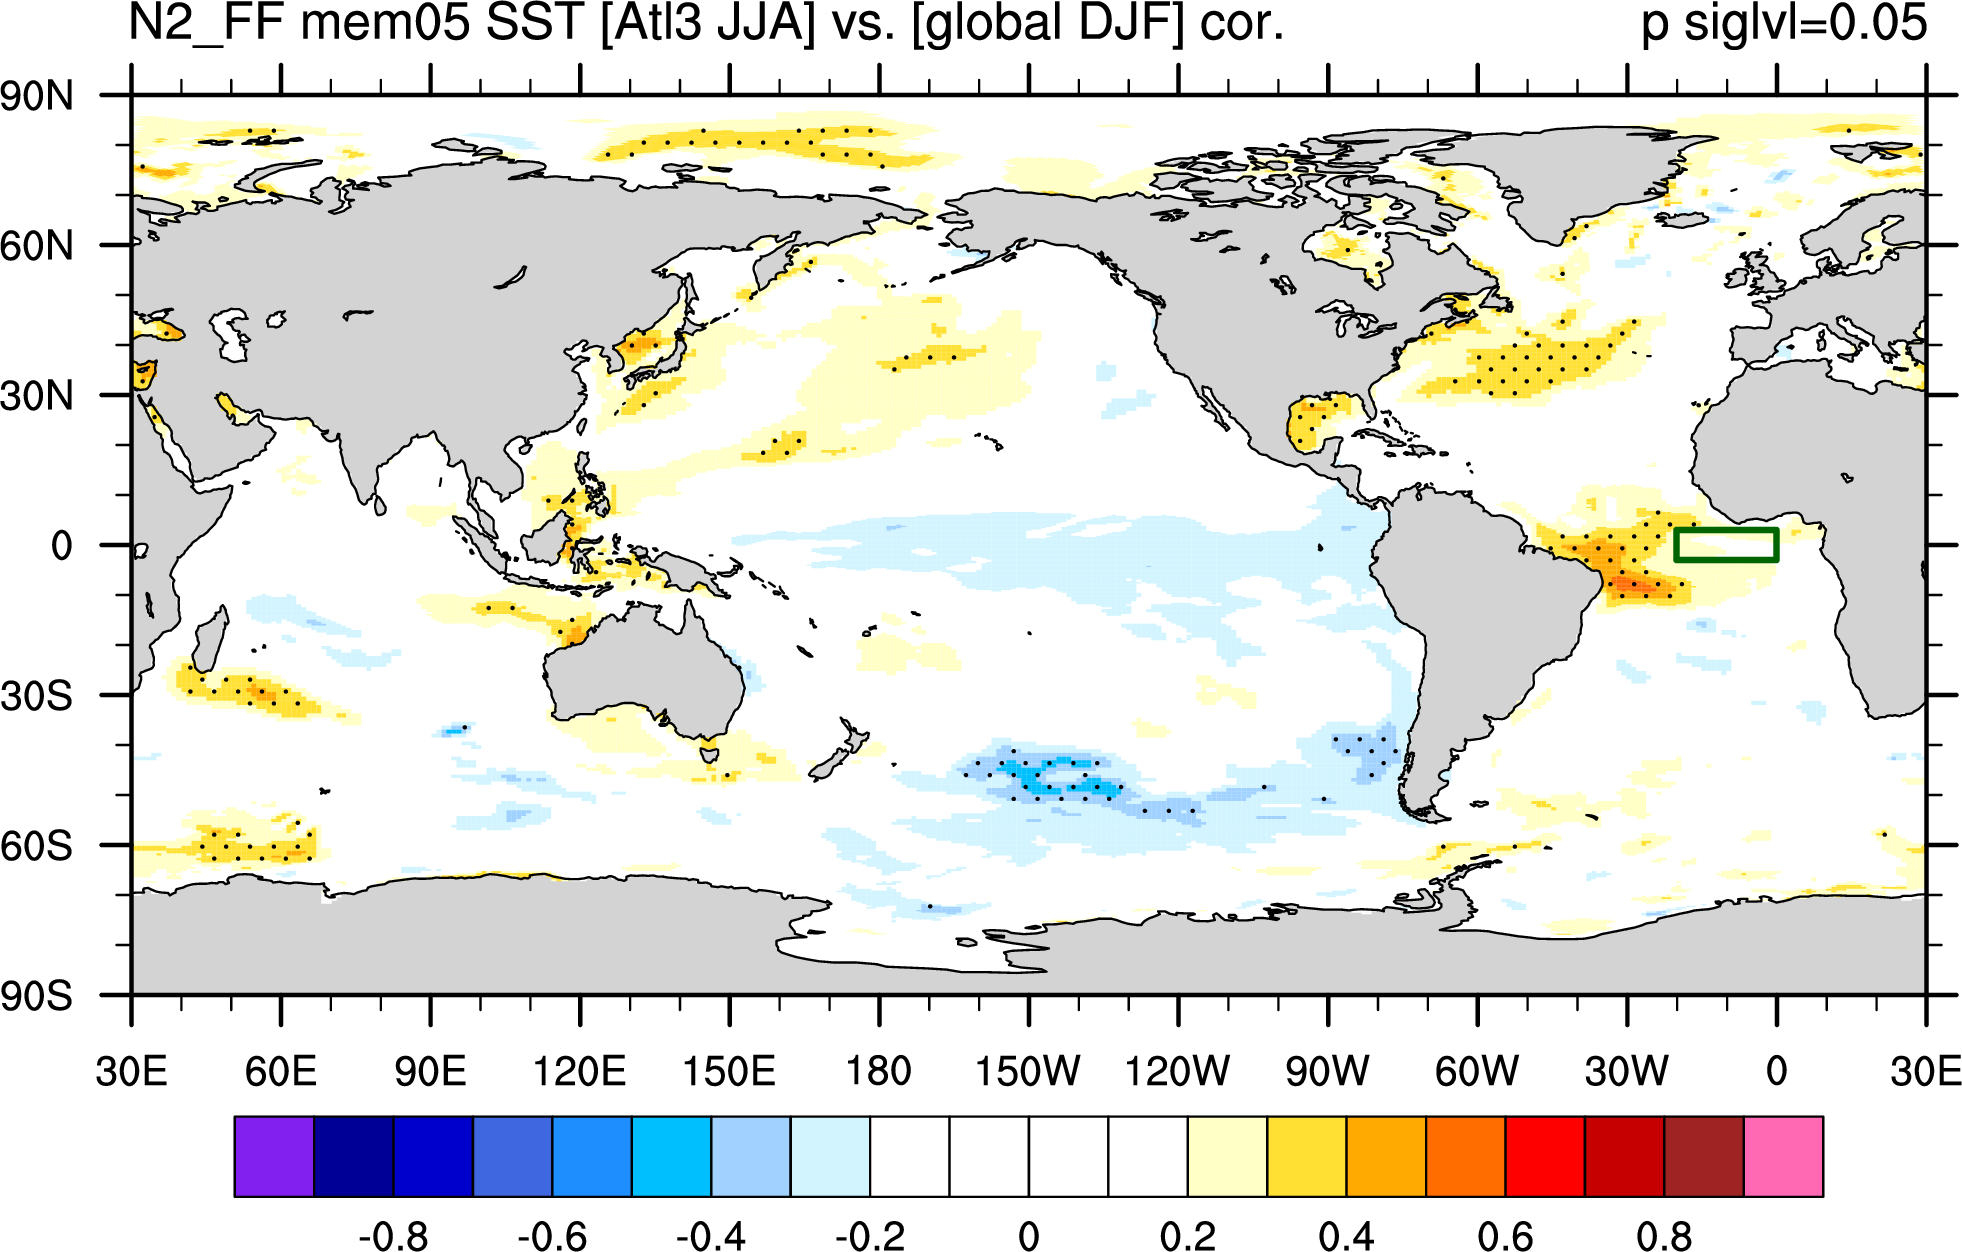
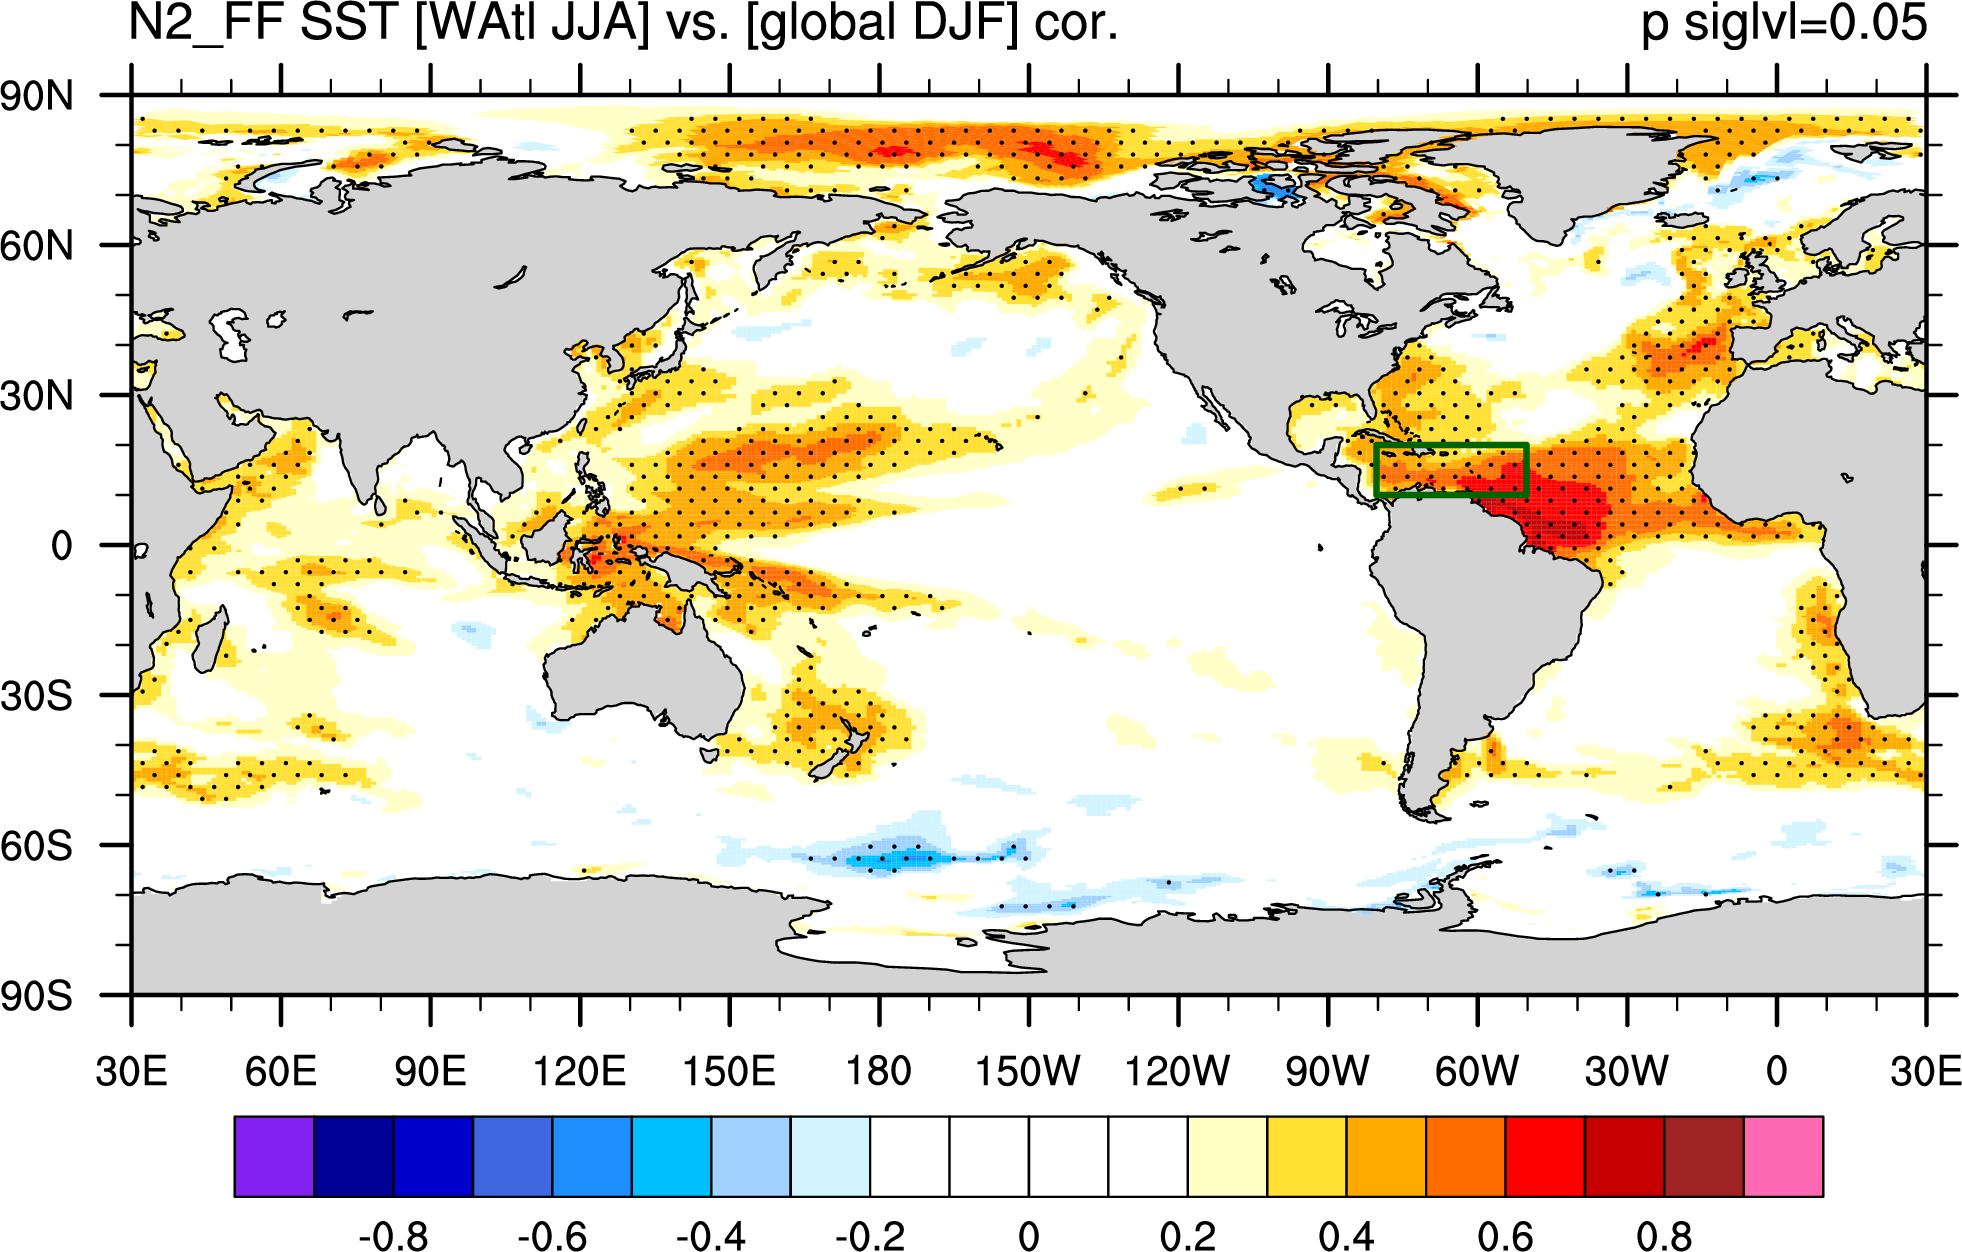
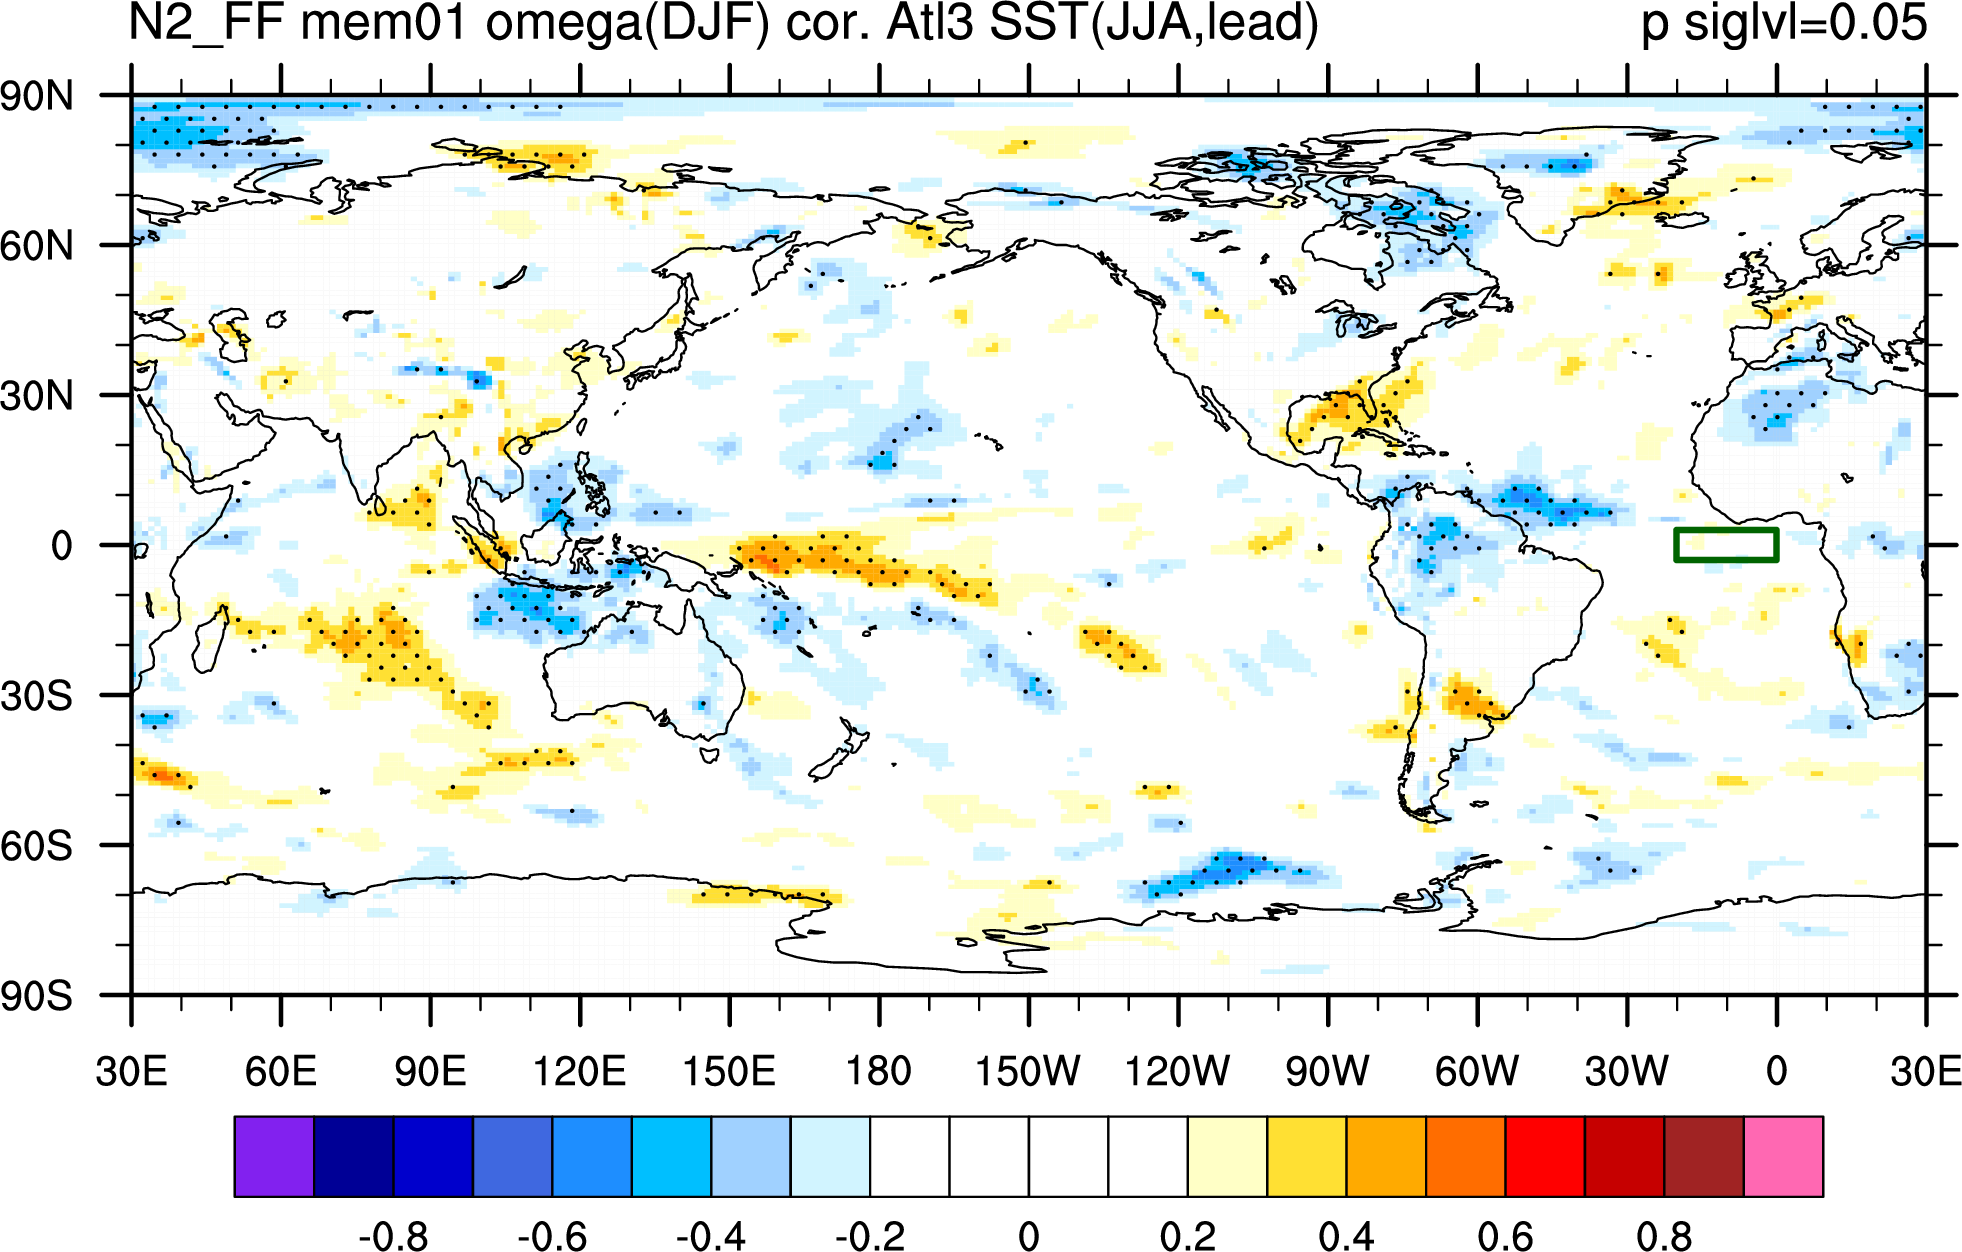
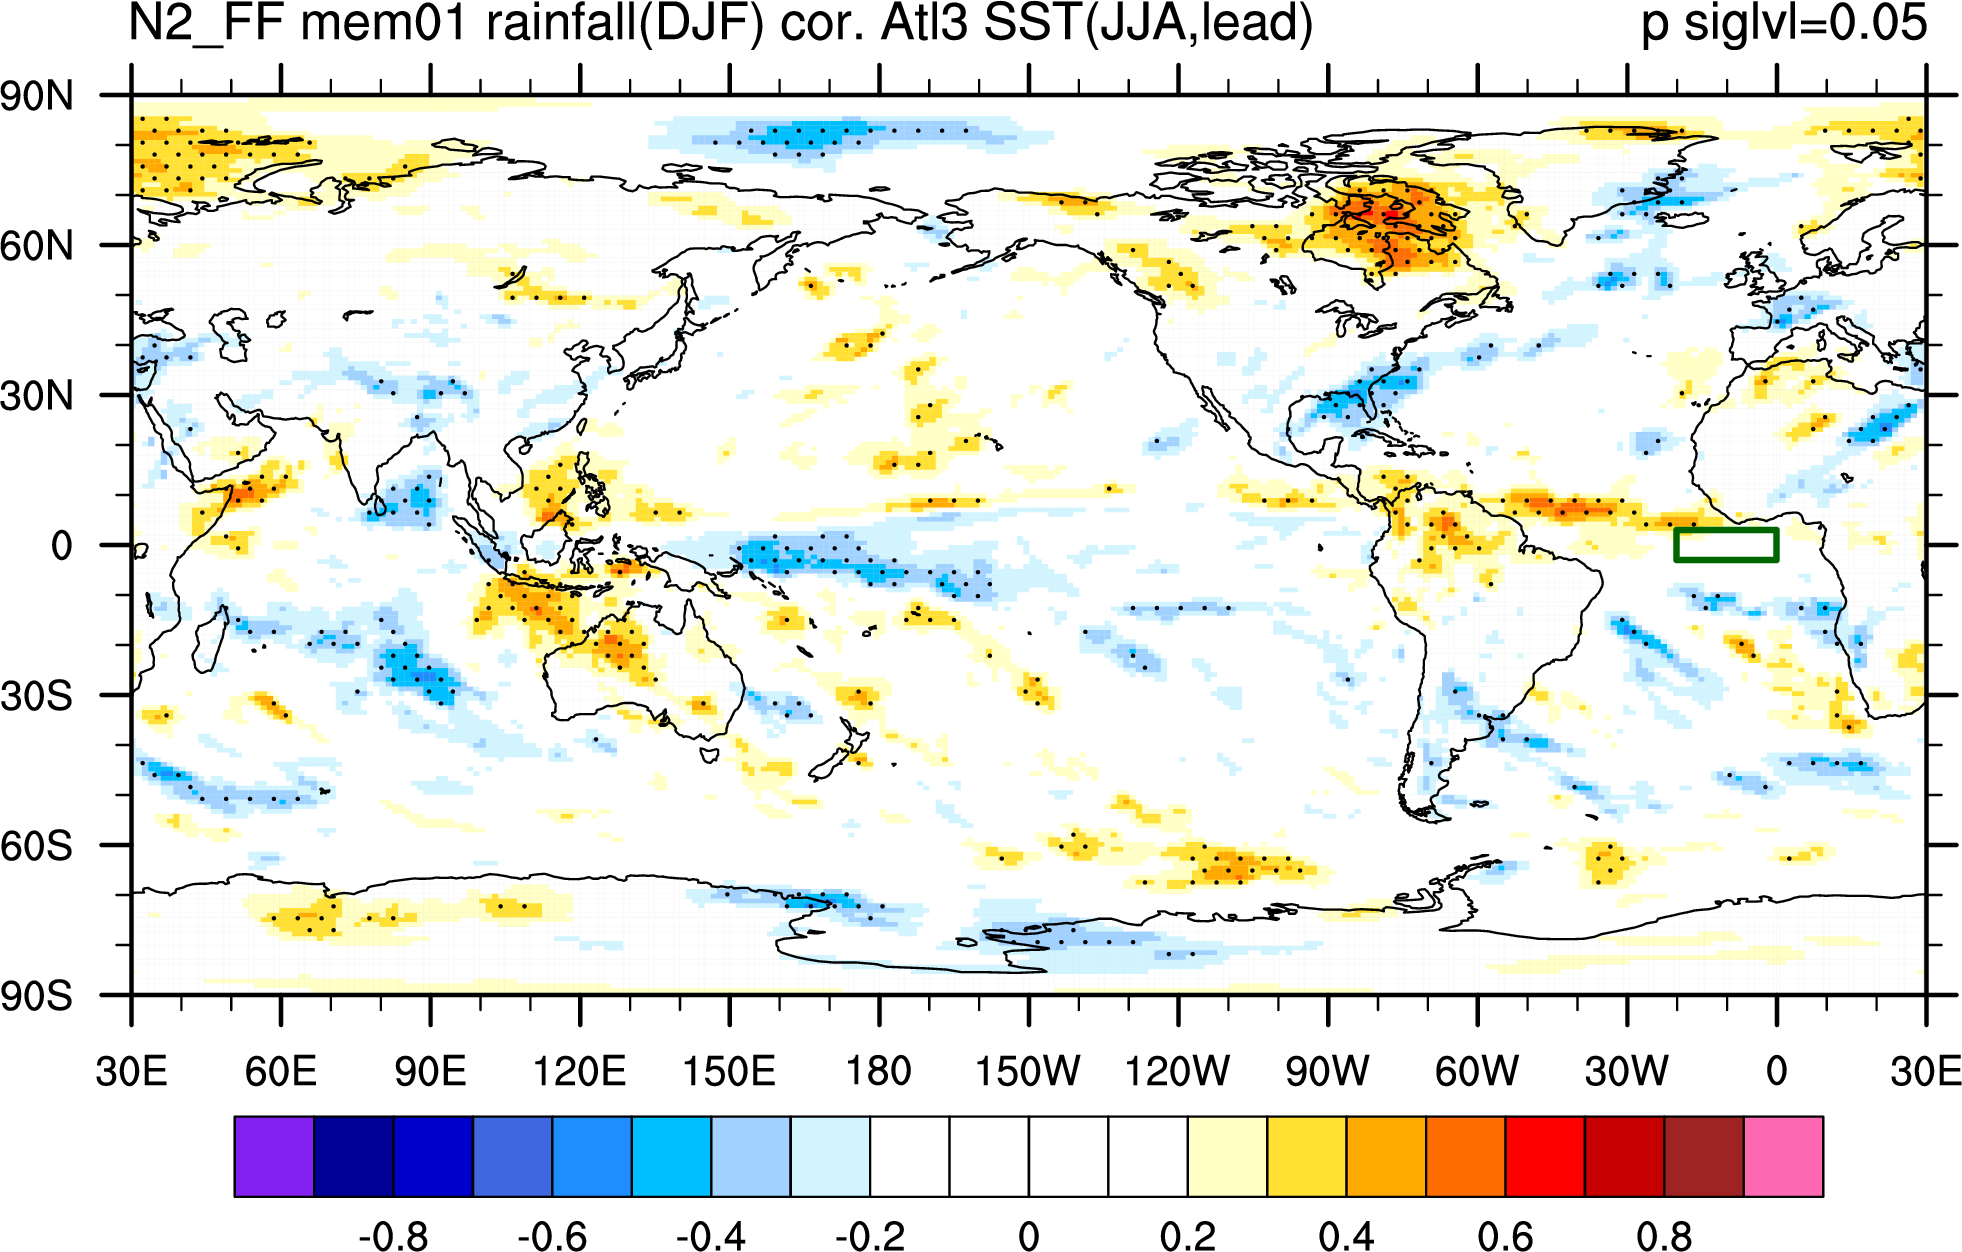
| Atl3 JJA vs. Global DJF (Atl3 lead) | |||||
|
|||||
|
|
|
|
|
|
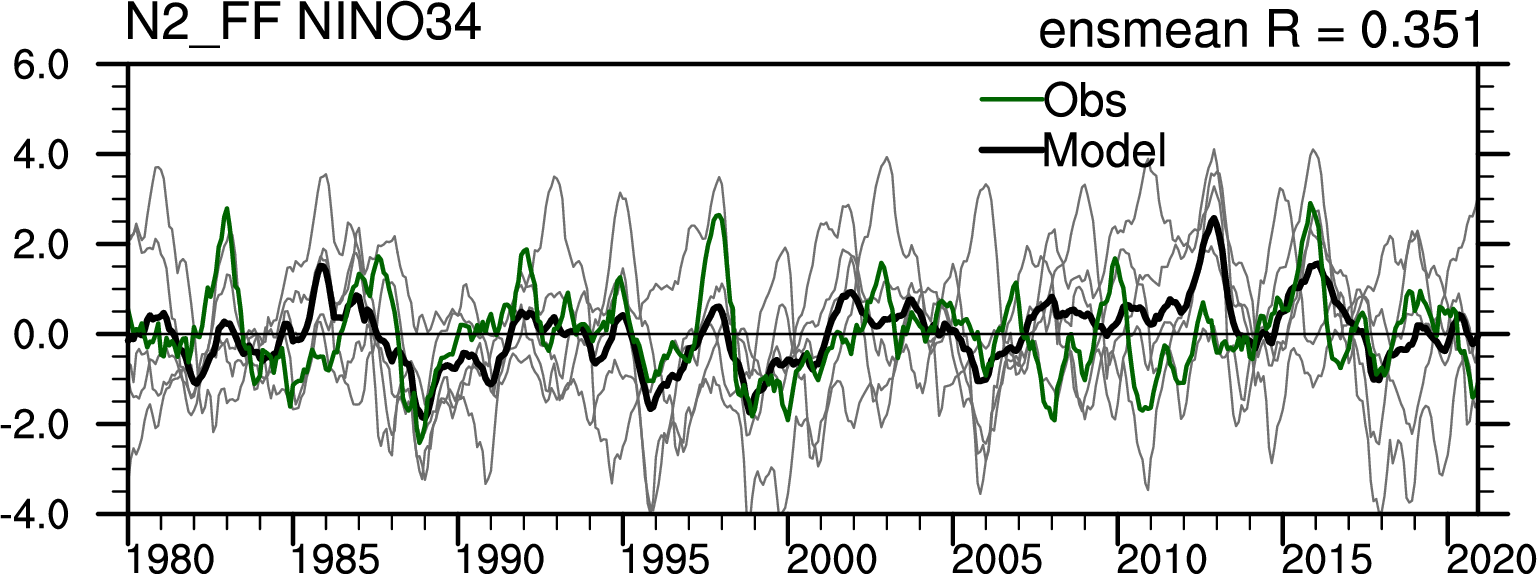
| NINO34 | |||||
|
|||||
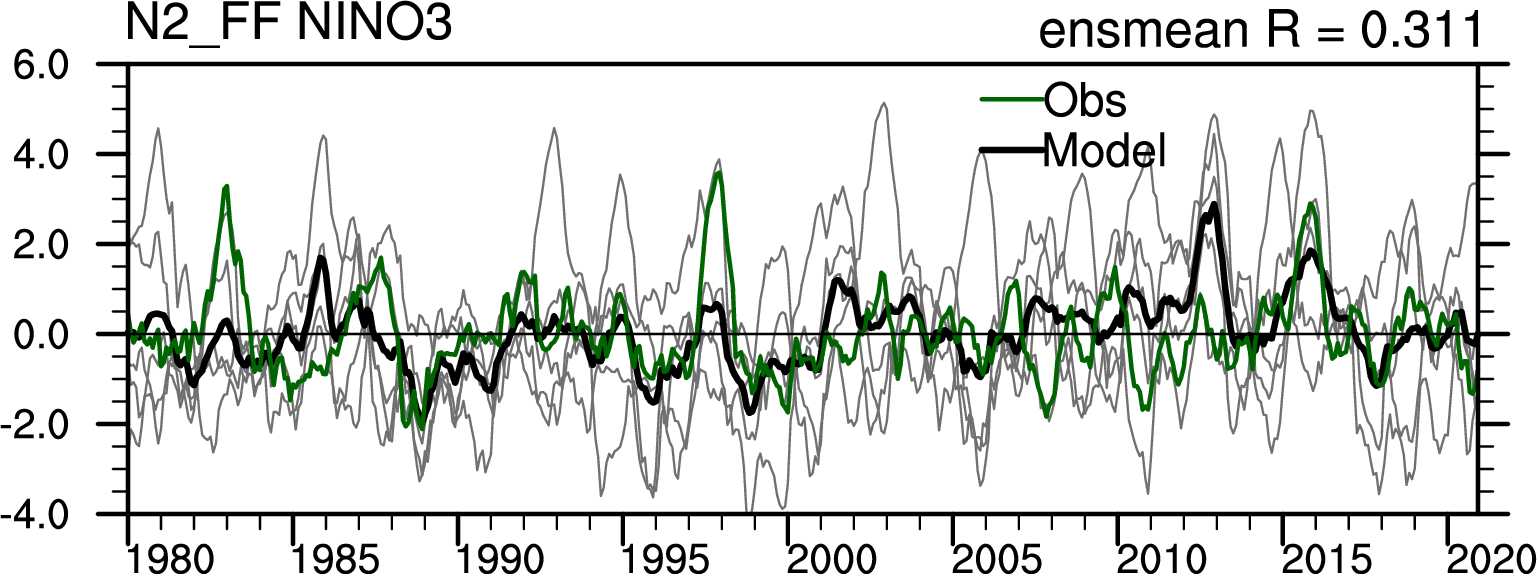
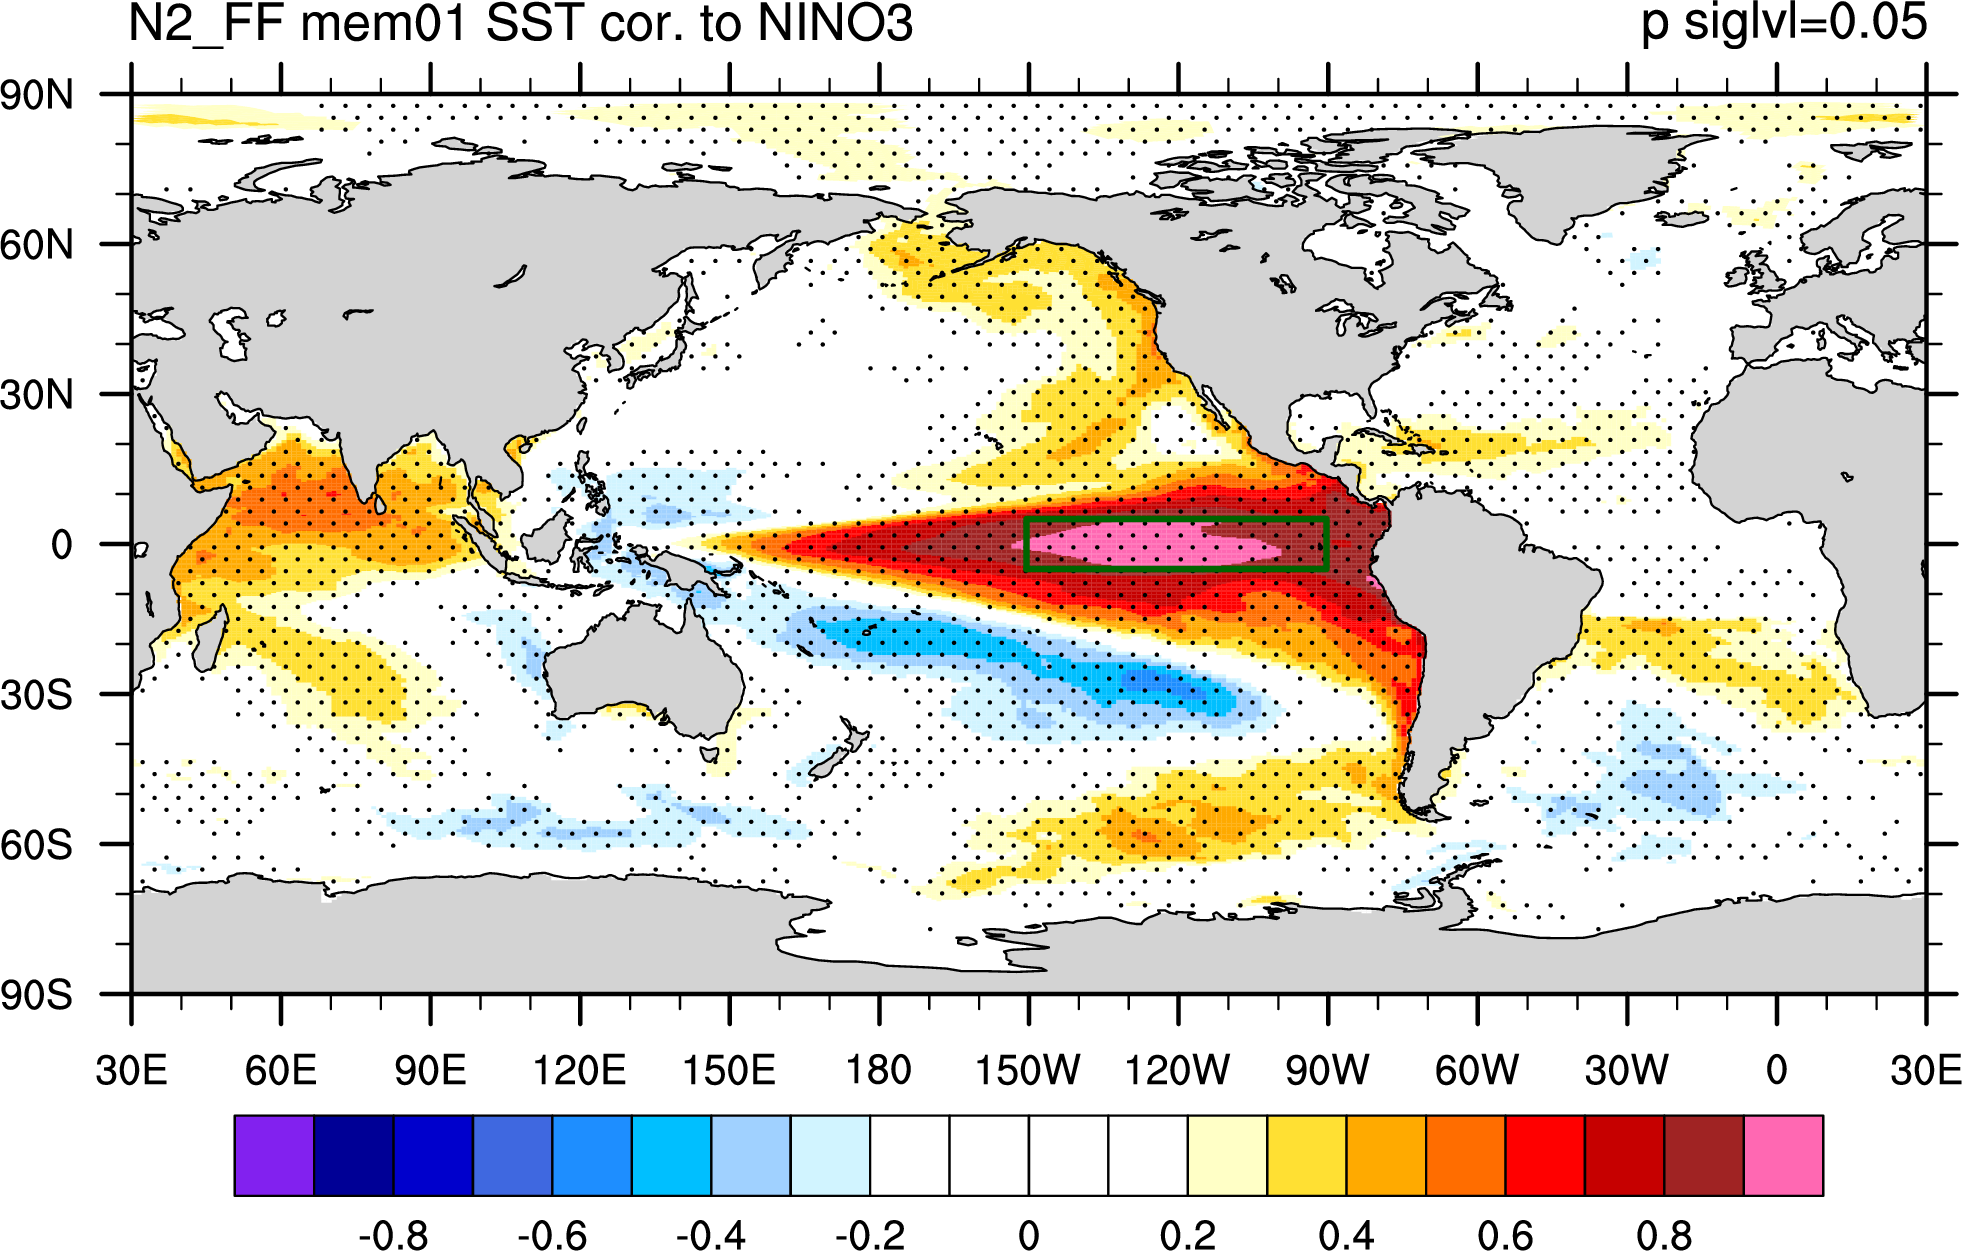
| NINO3 | |||||
|
|||||
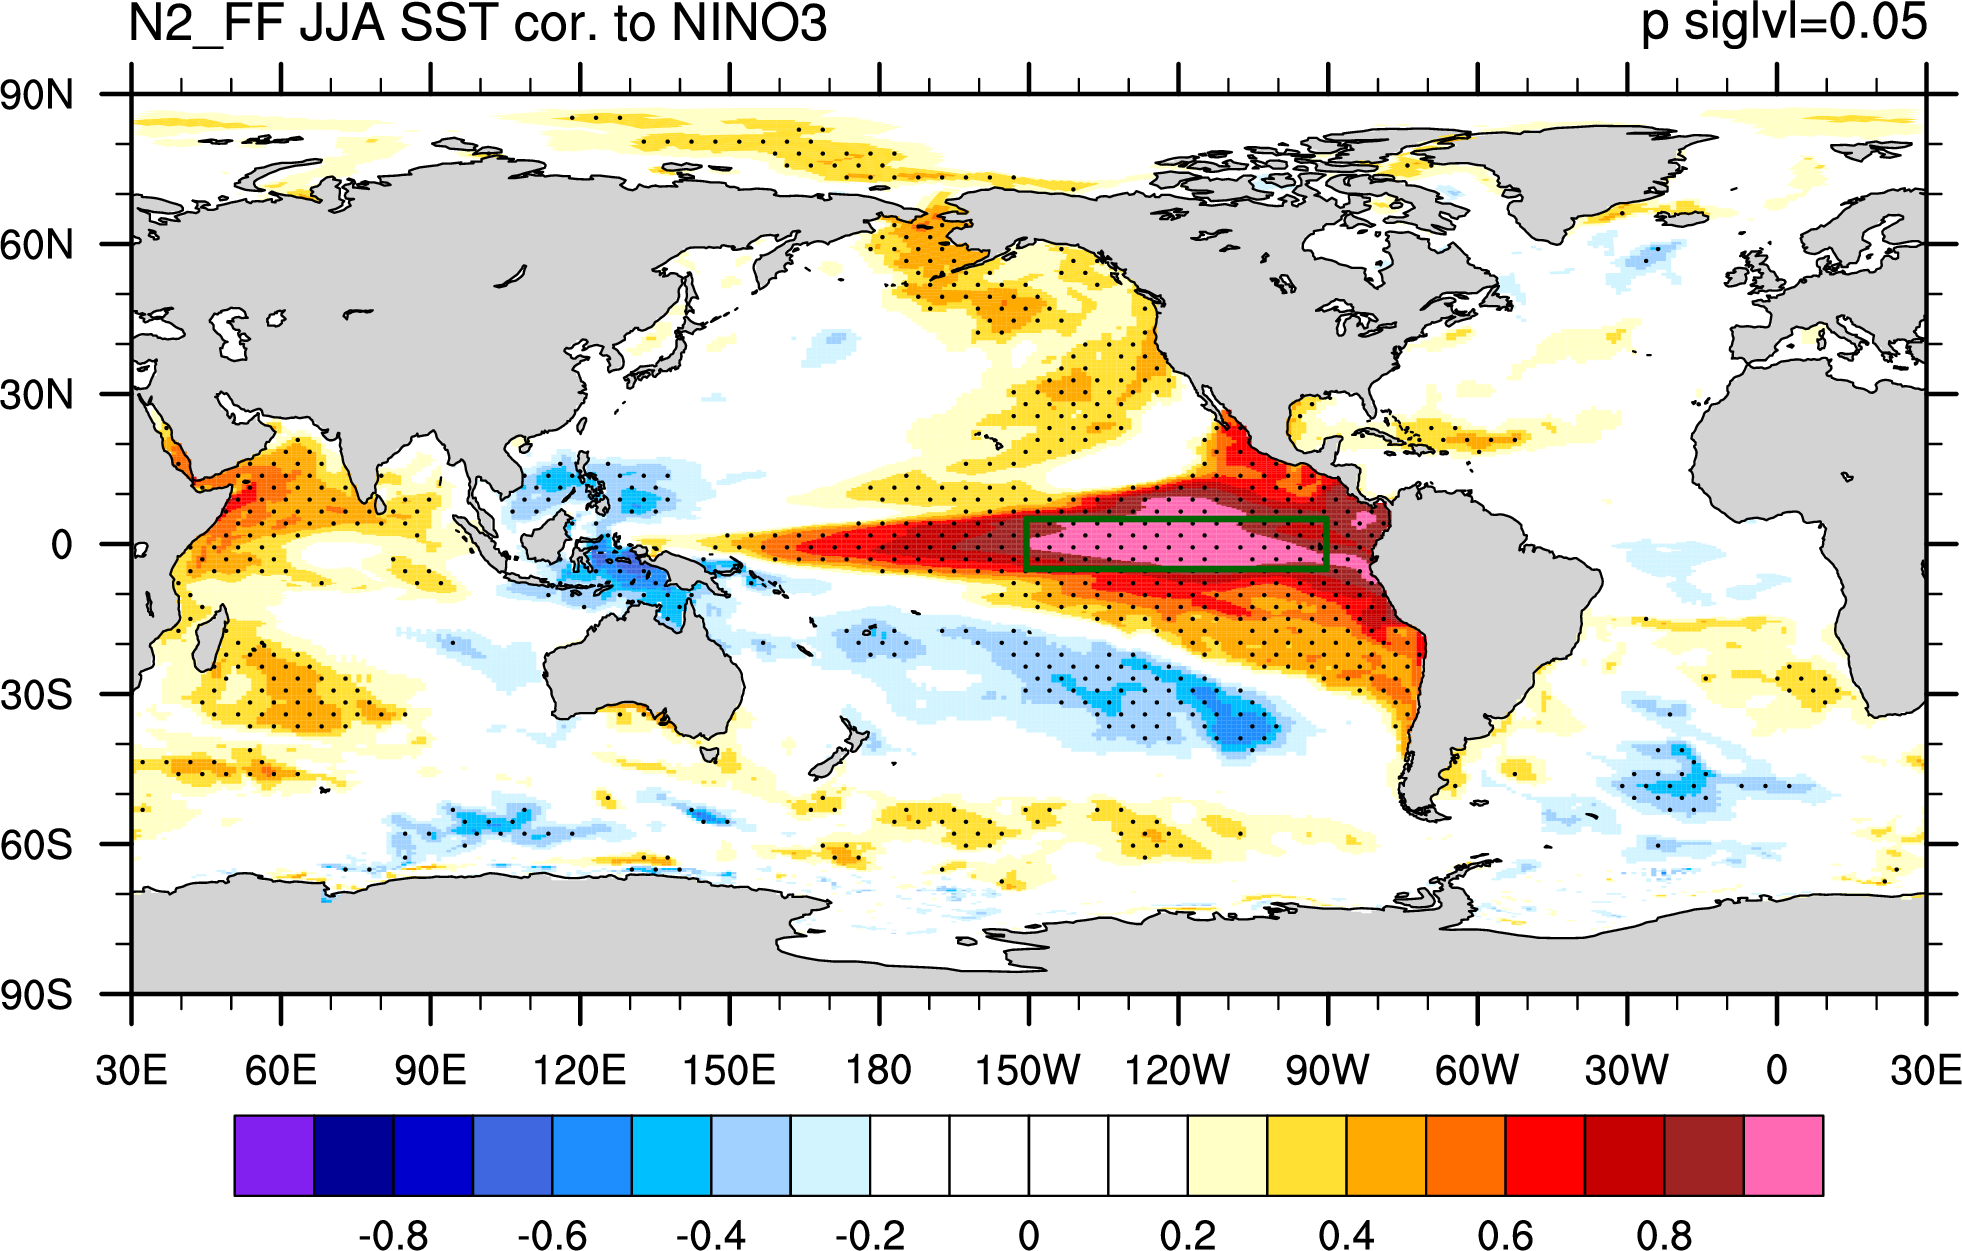
| NINO3 | JJA | DJF | |||
|
|
|
|||
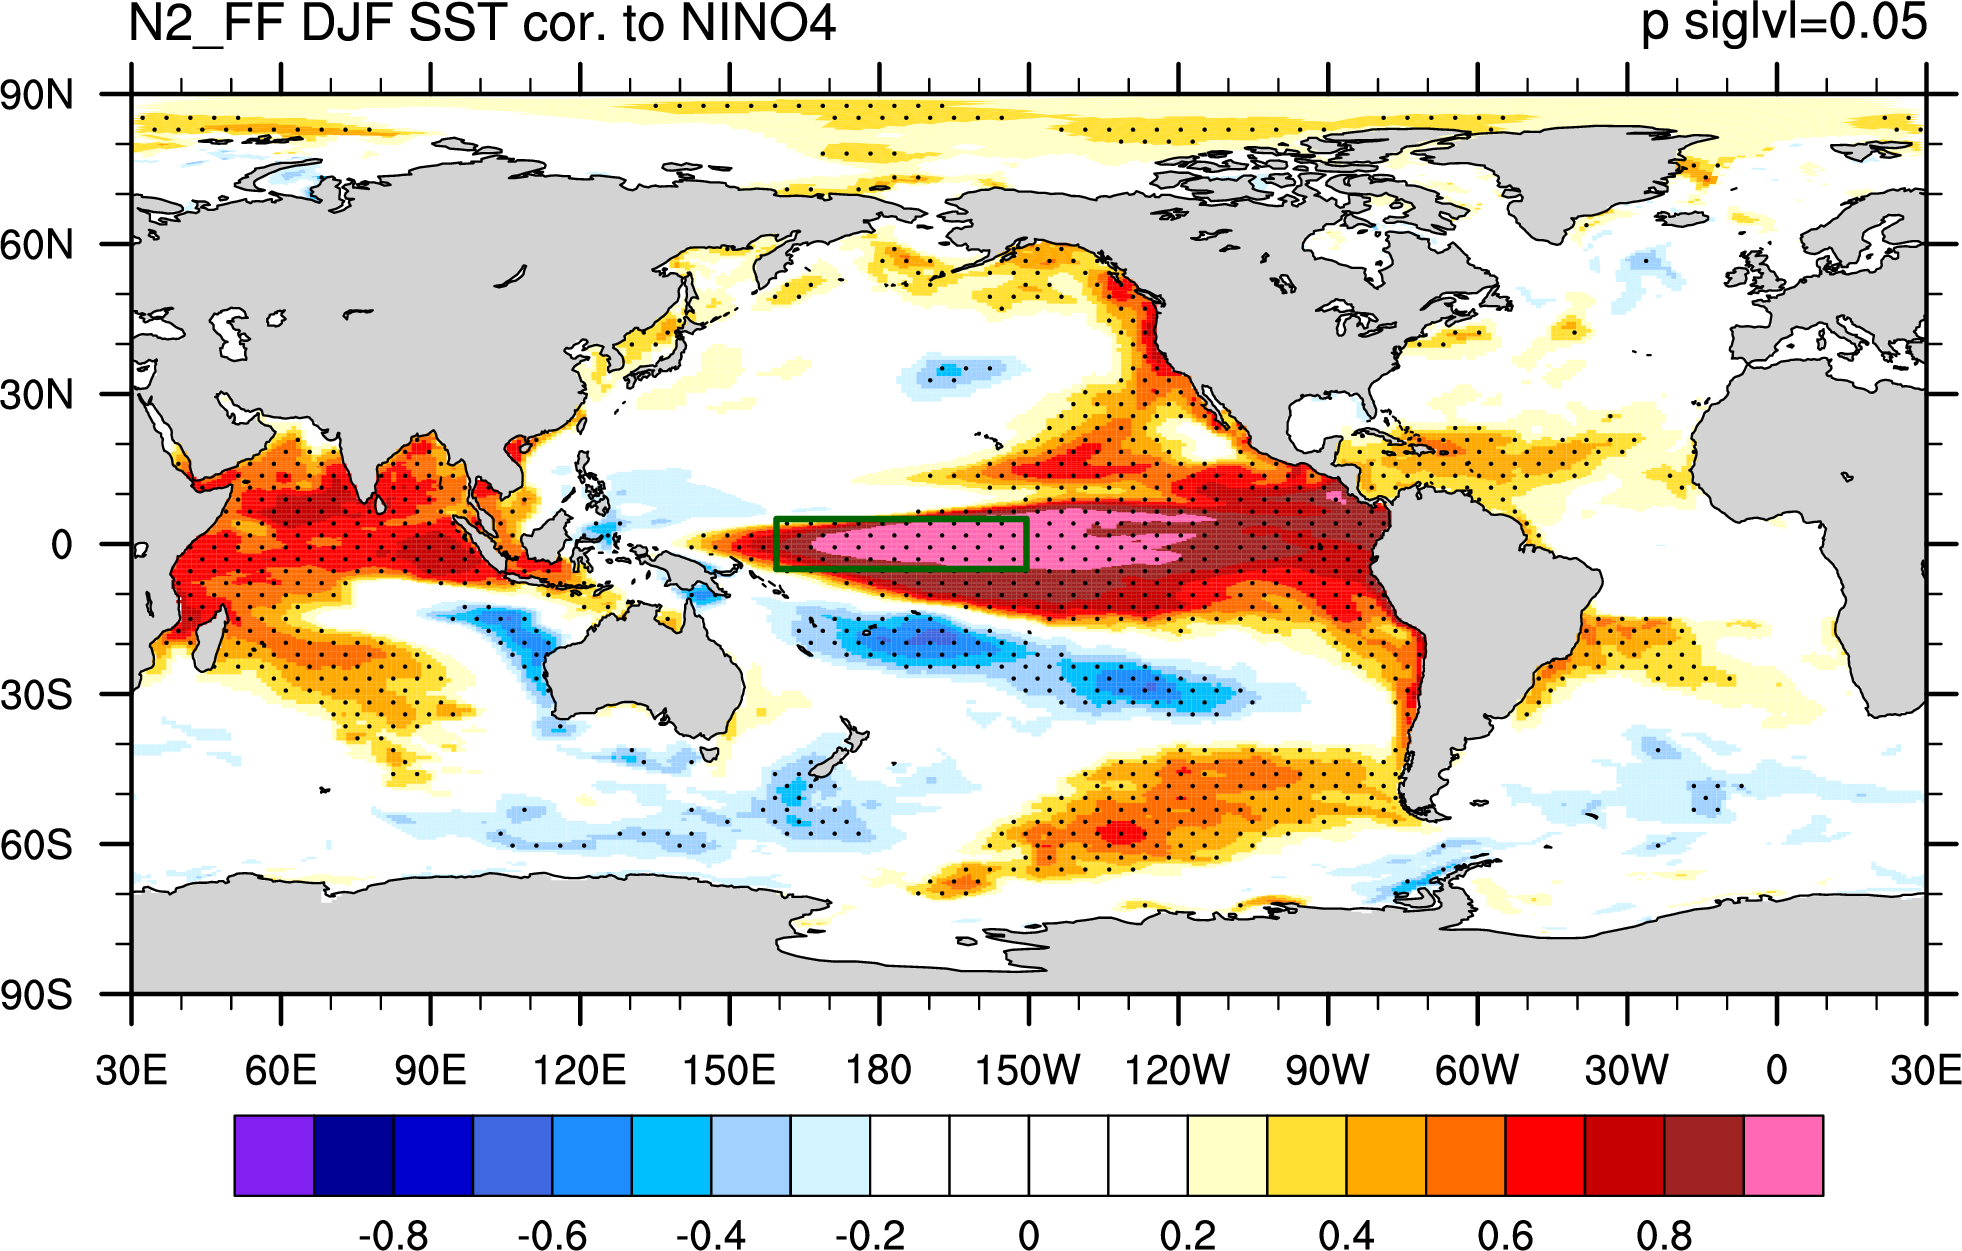
| NINO4 | |||||
|
|||||
| NINO4 | JJA | DJF | |||
|
|
|
|||
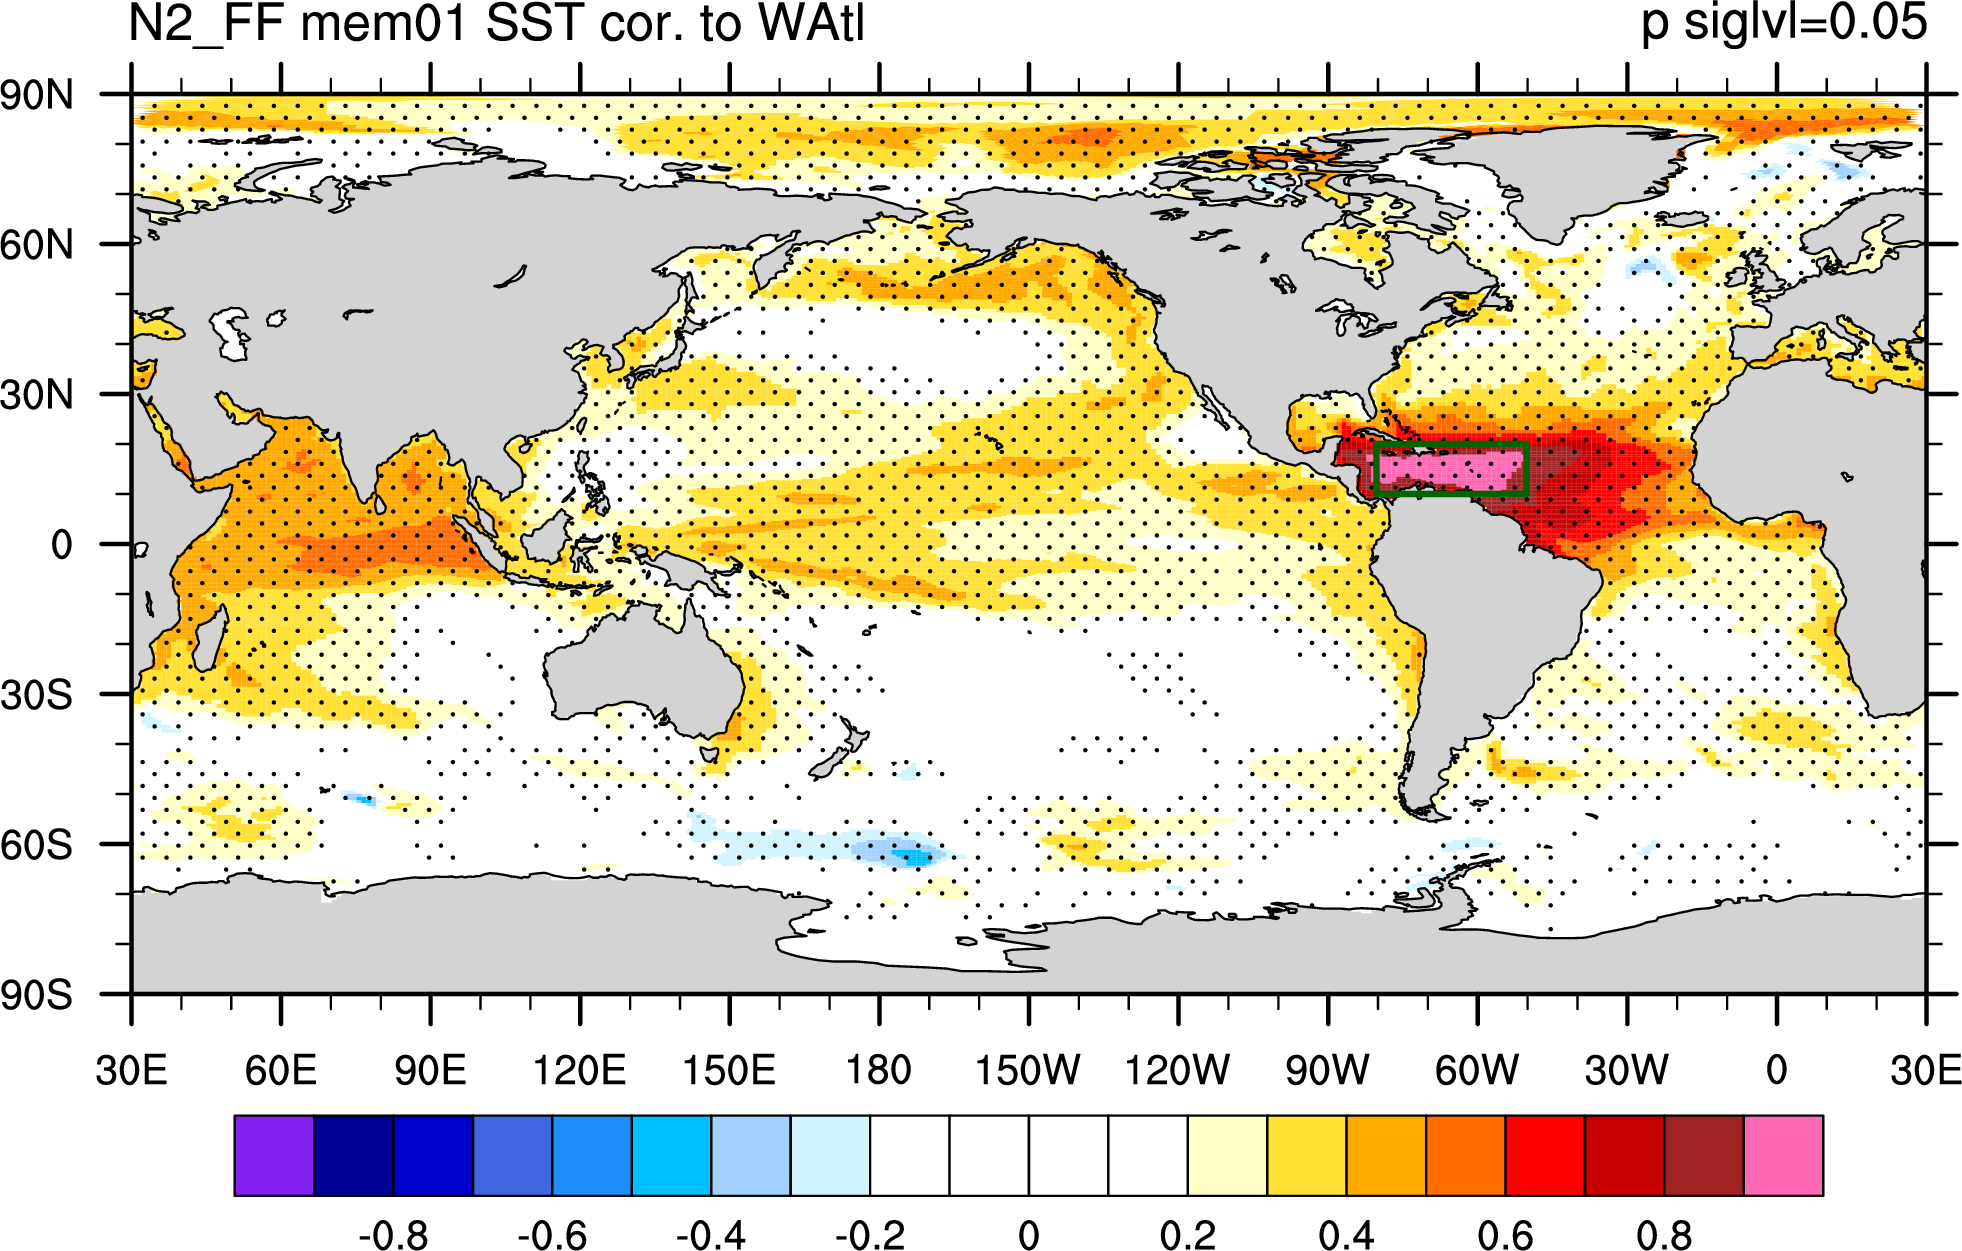
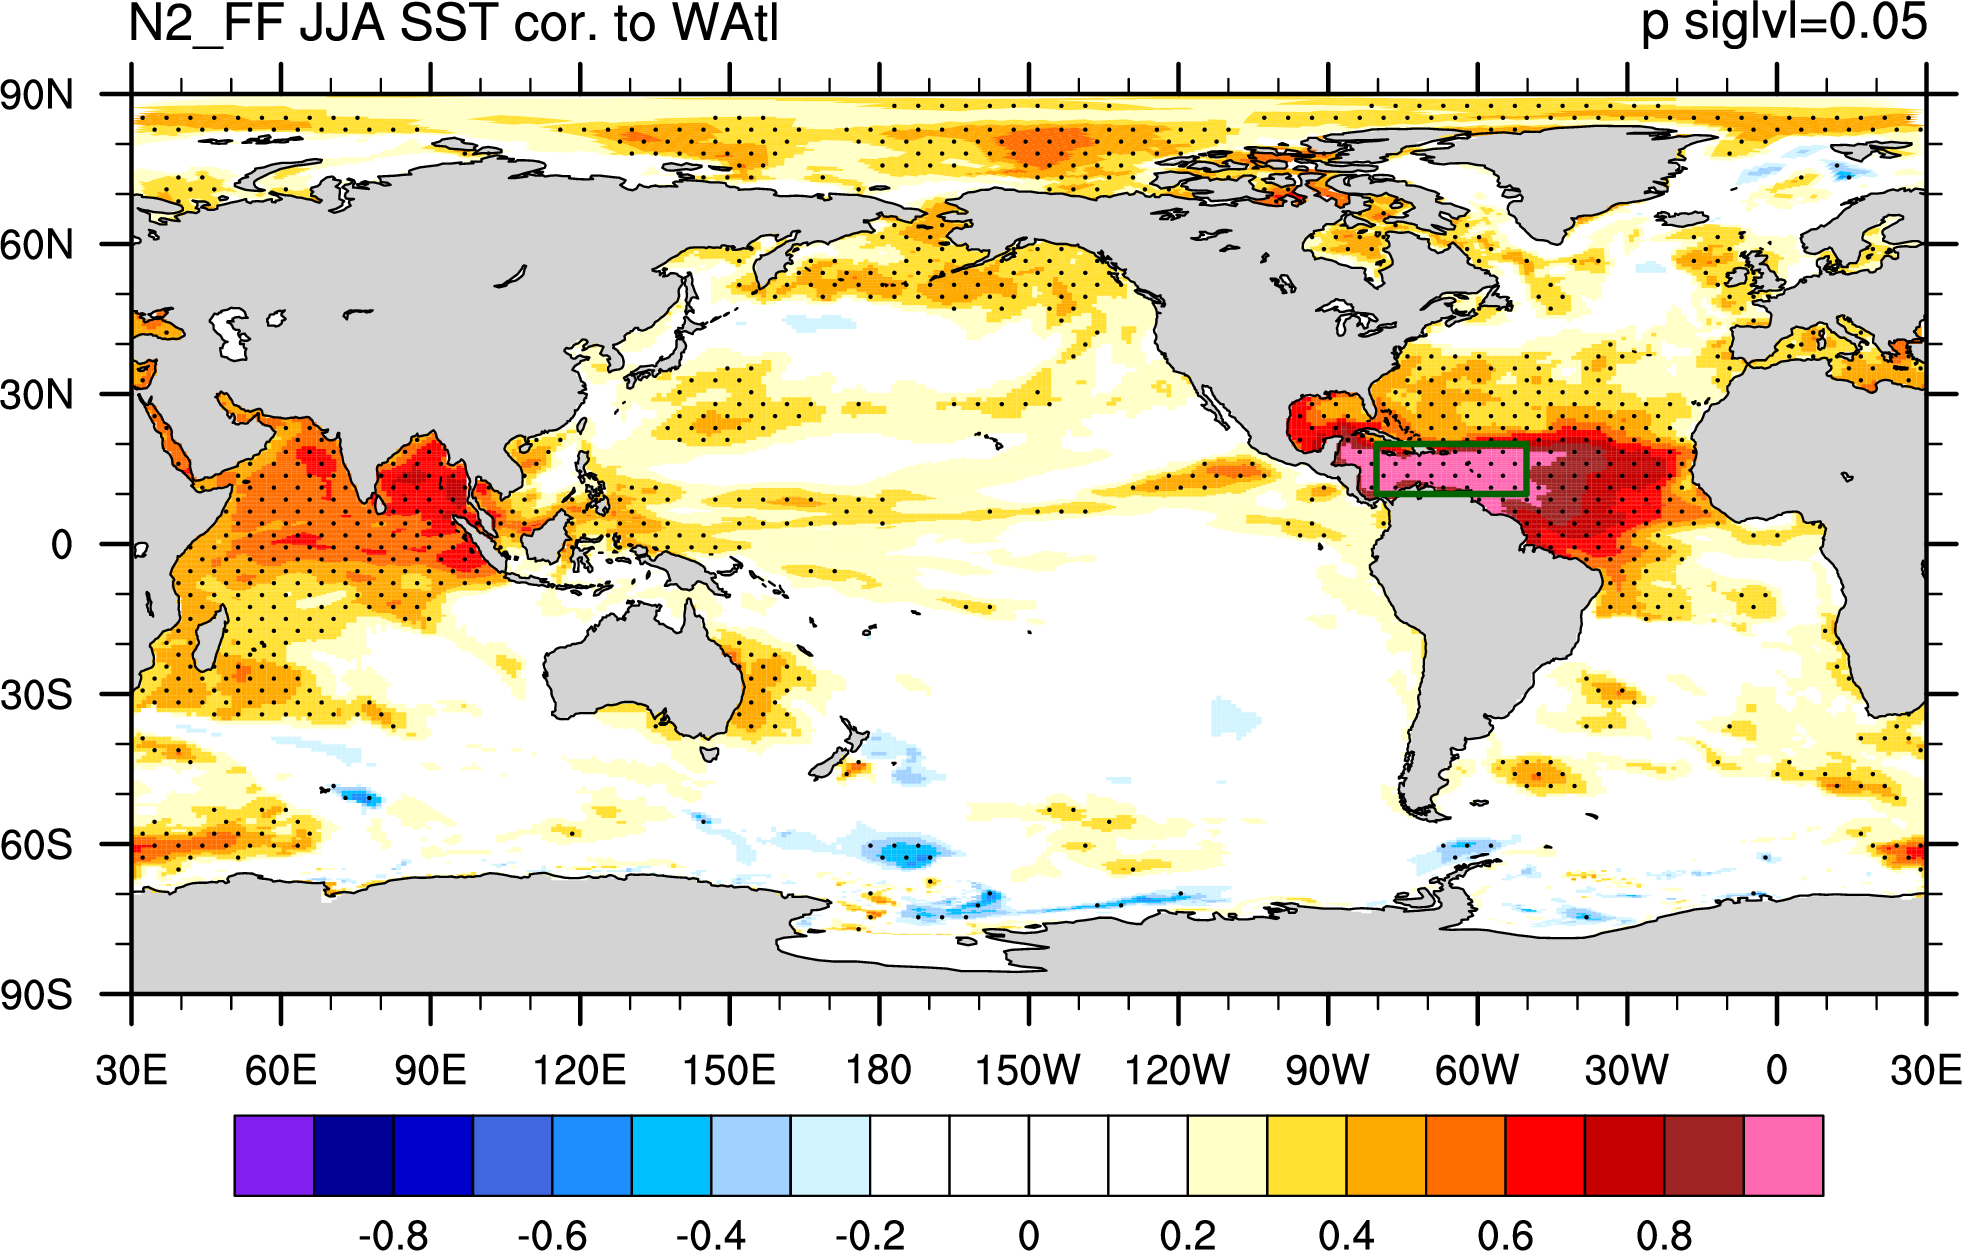
| Western North Atl | JJA | WAtl JJA cor. DJF | |||
|
|
|
|||
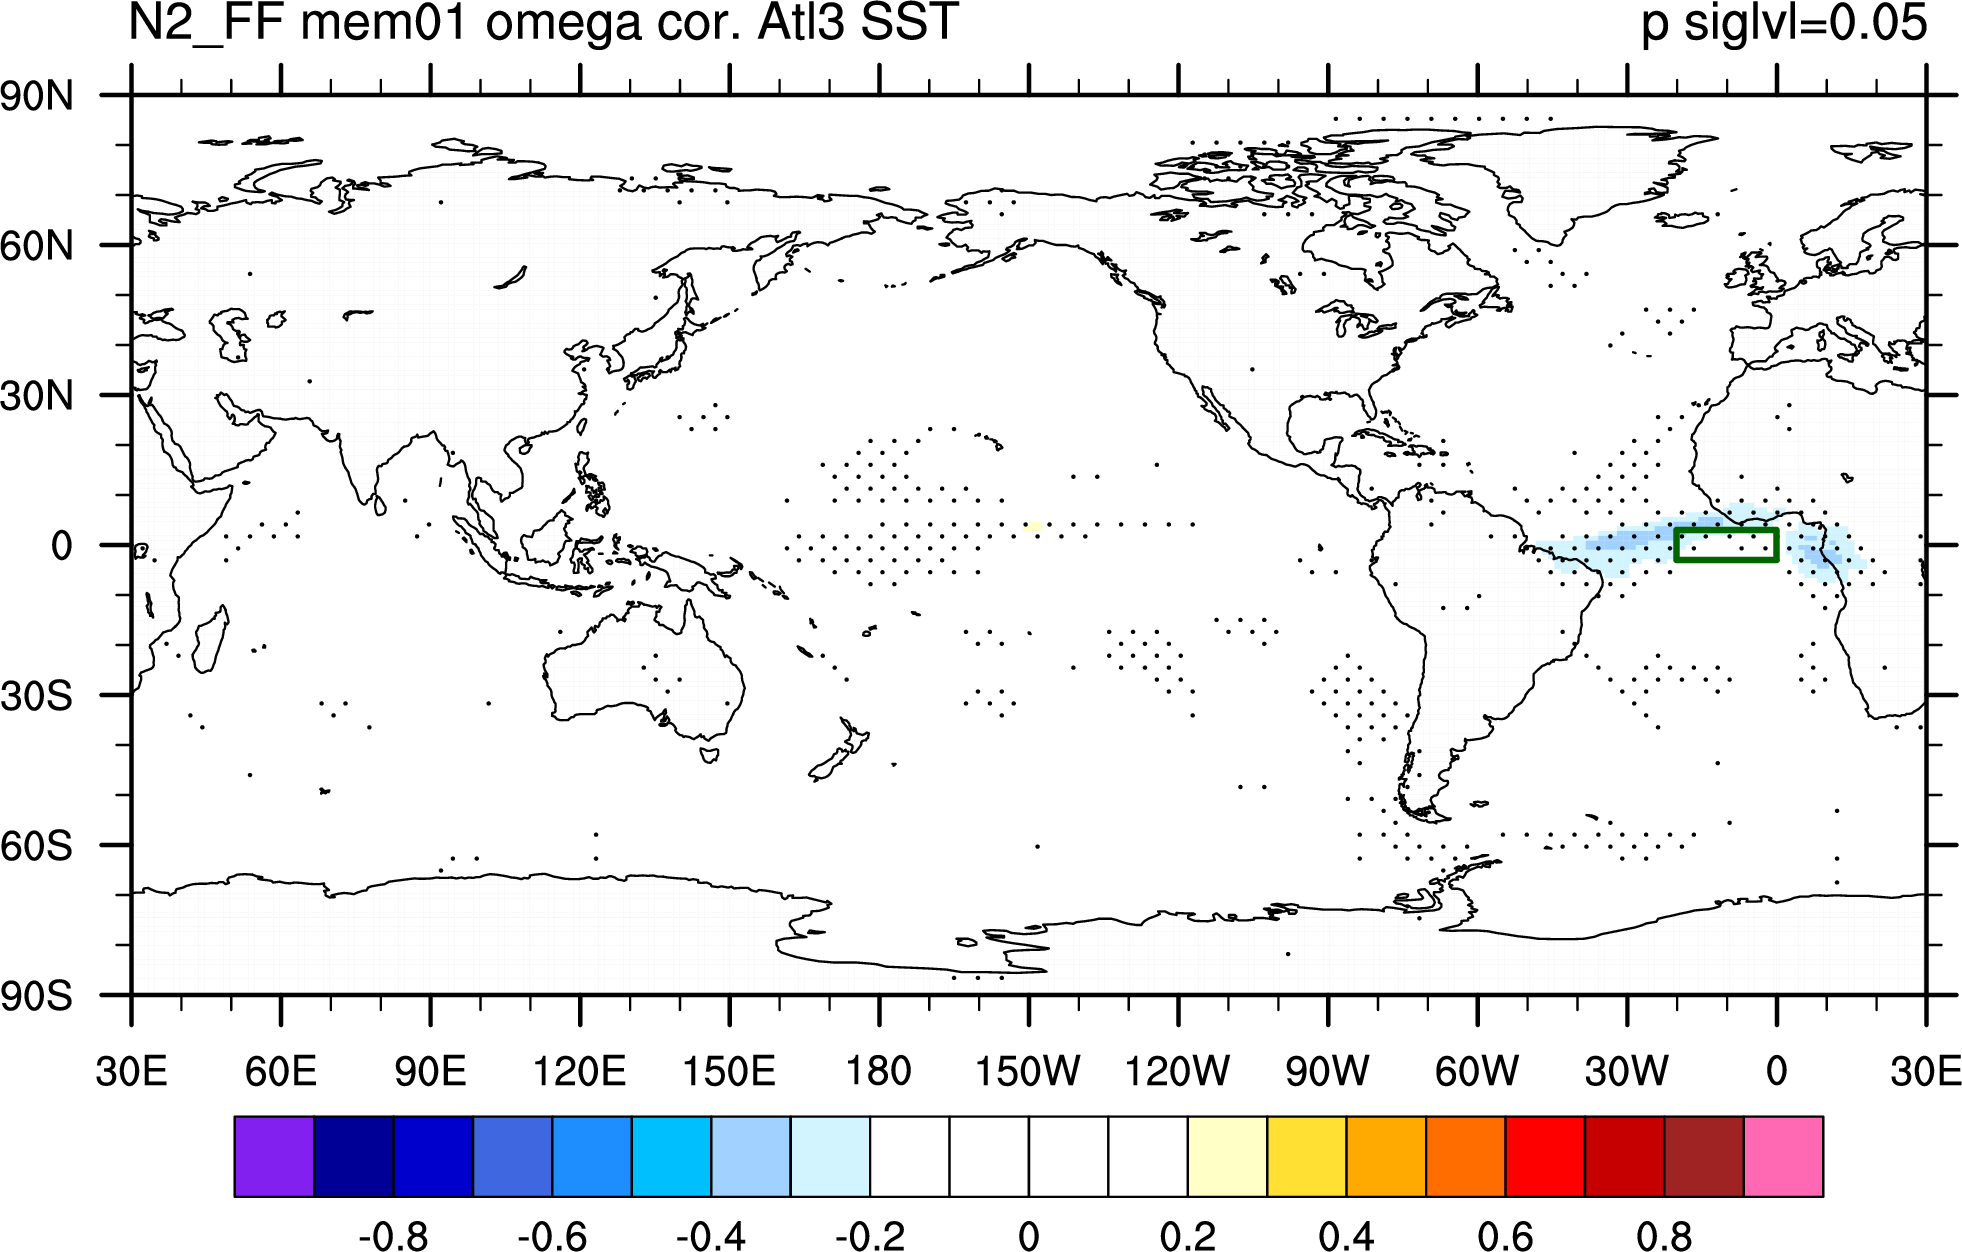
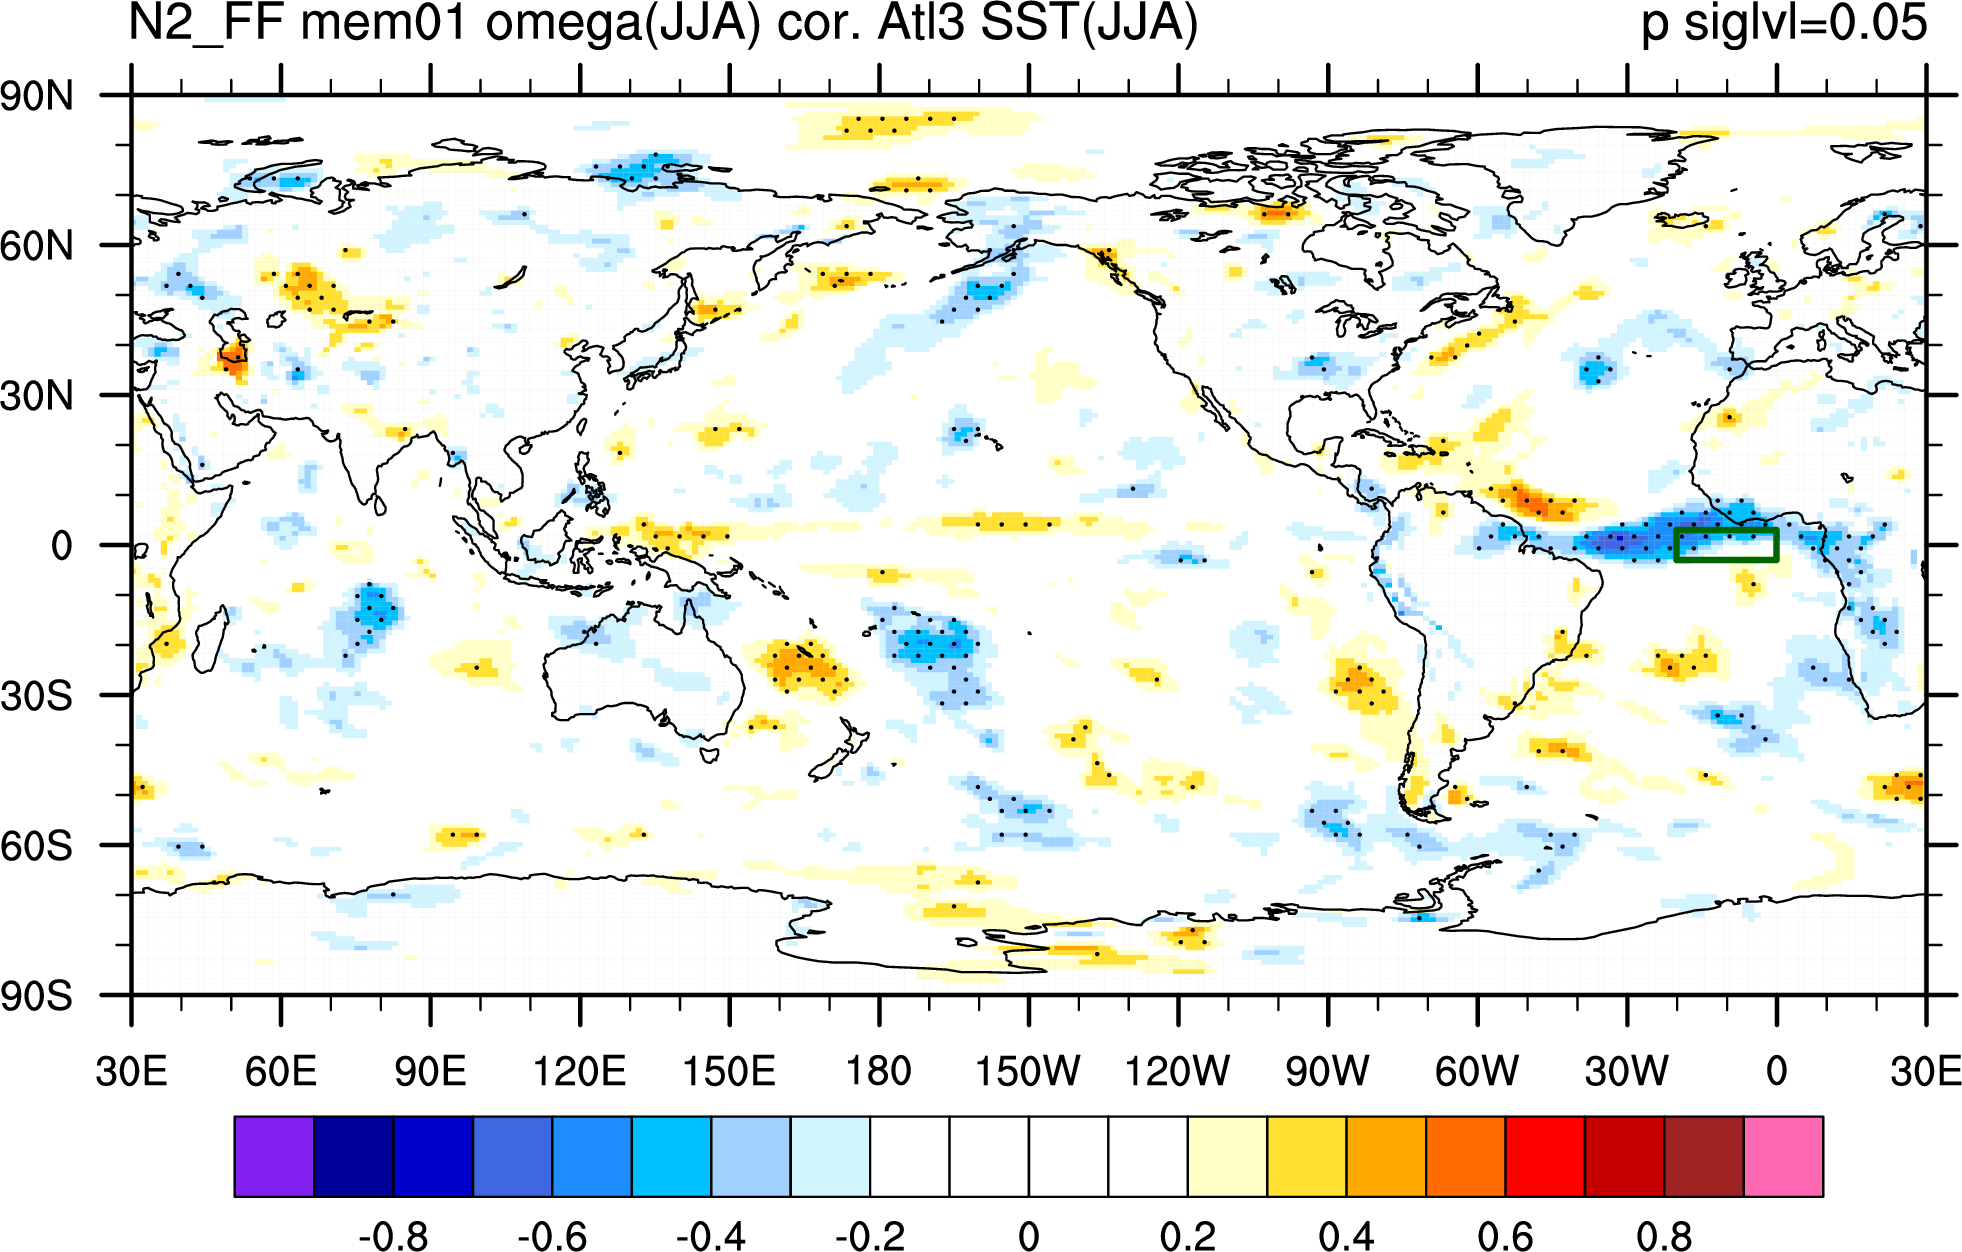
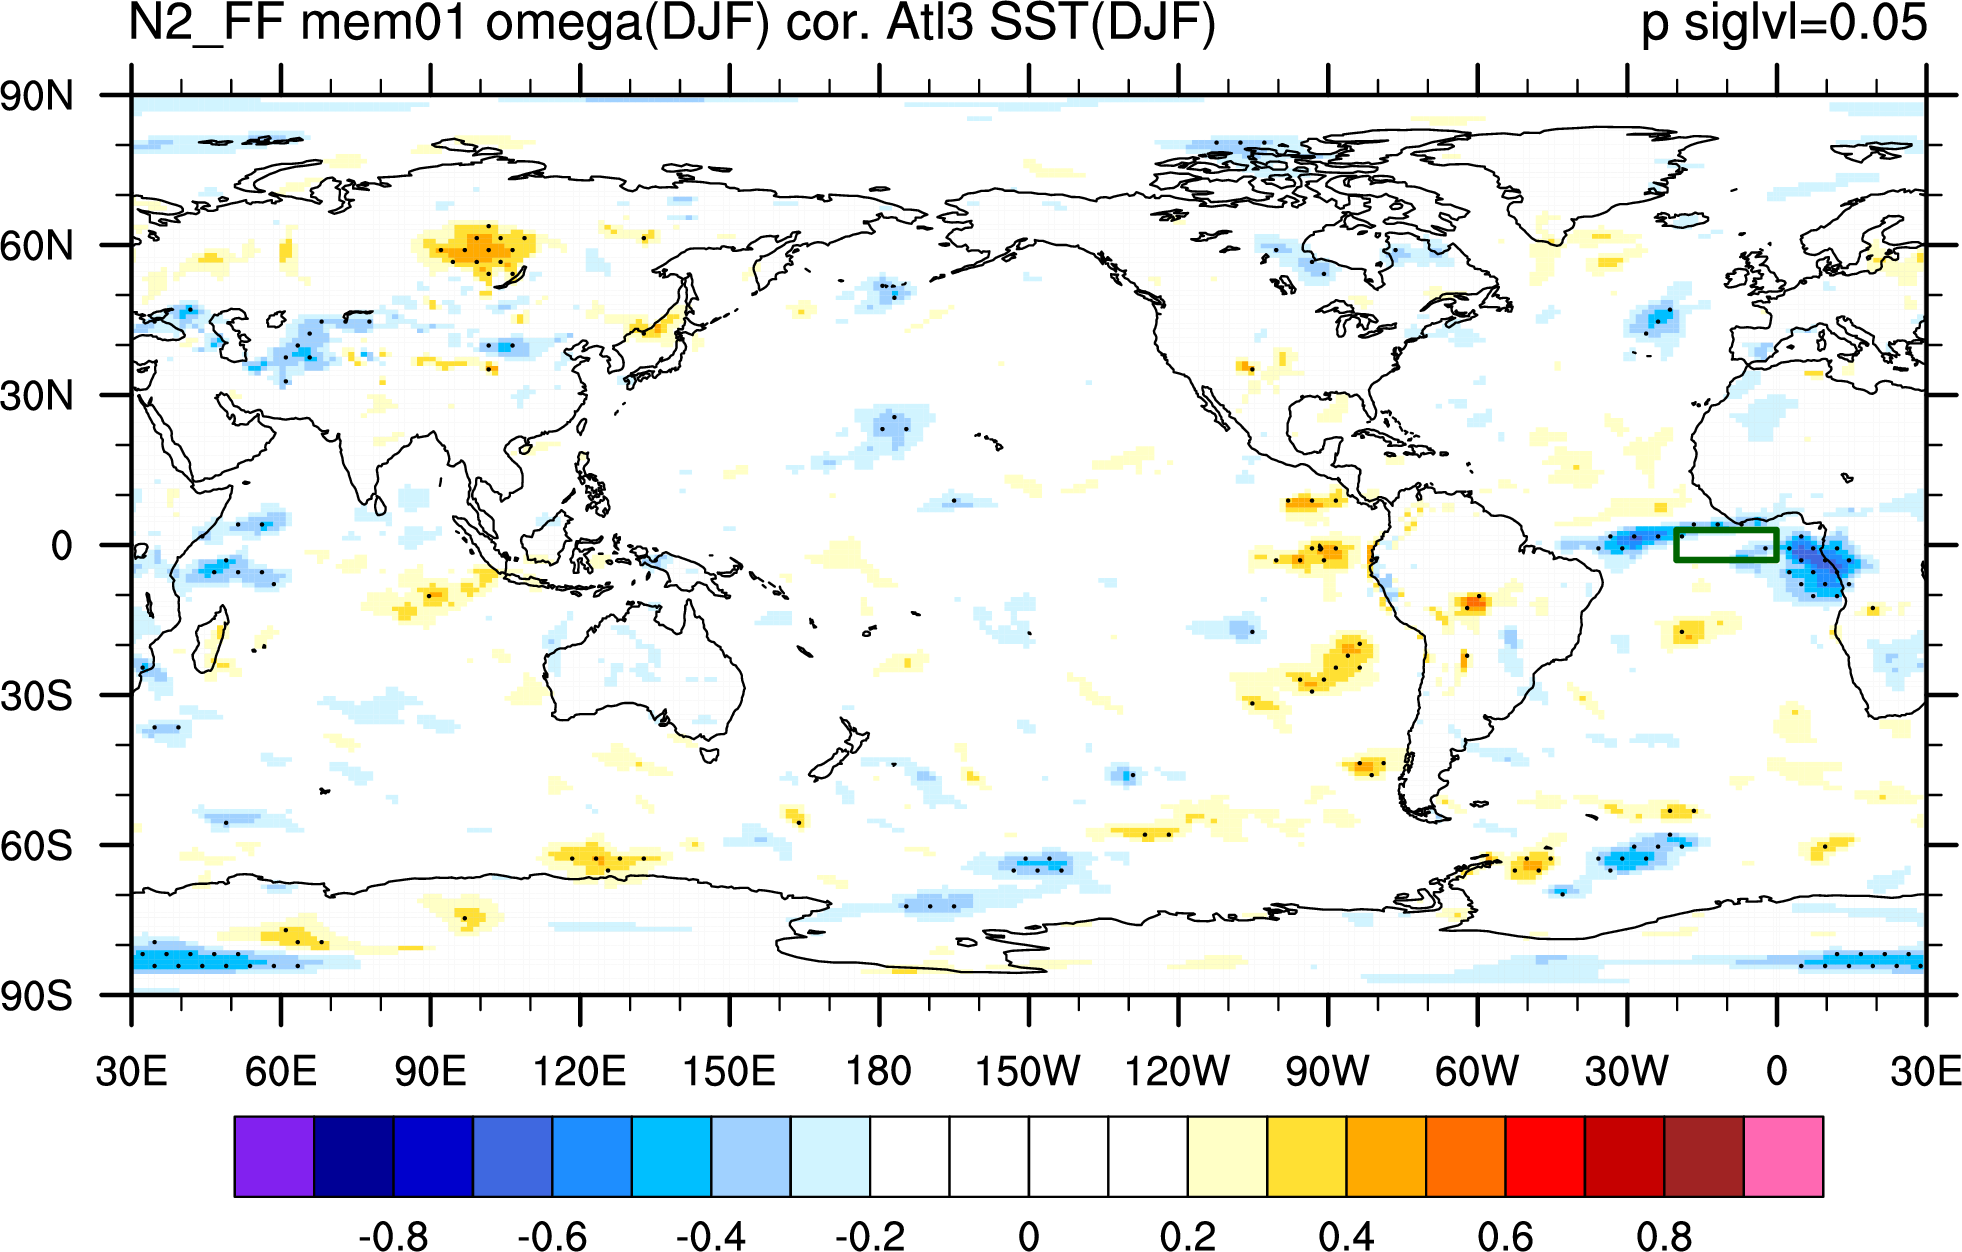
| Atl3 SST ts cor. Omega 500 map | |||||
|
|
|
|
||
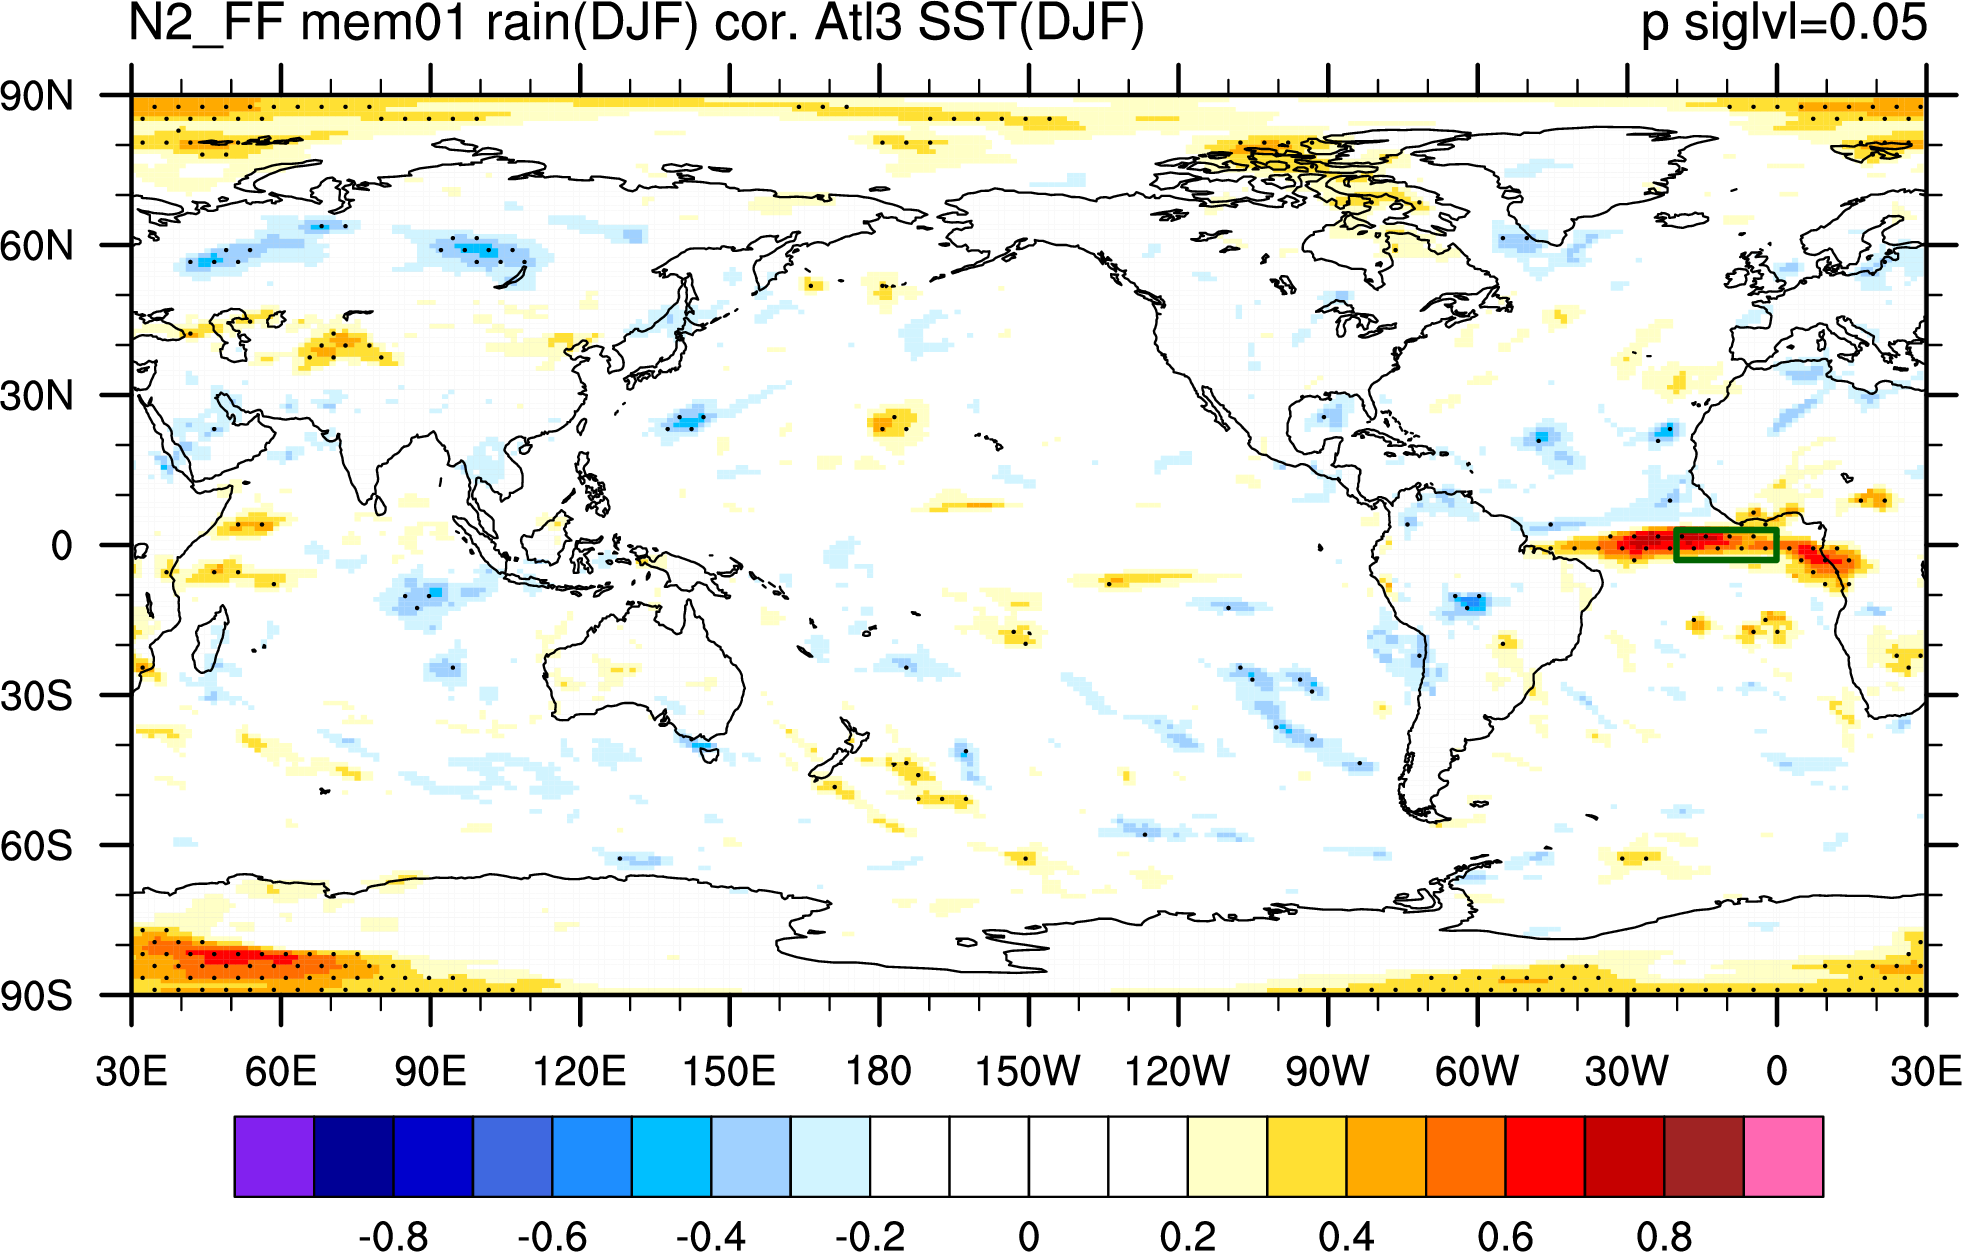
| Atl3 SST ts cor. prect map | |||||
|
|
|
|
||
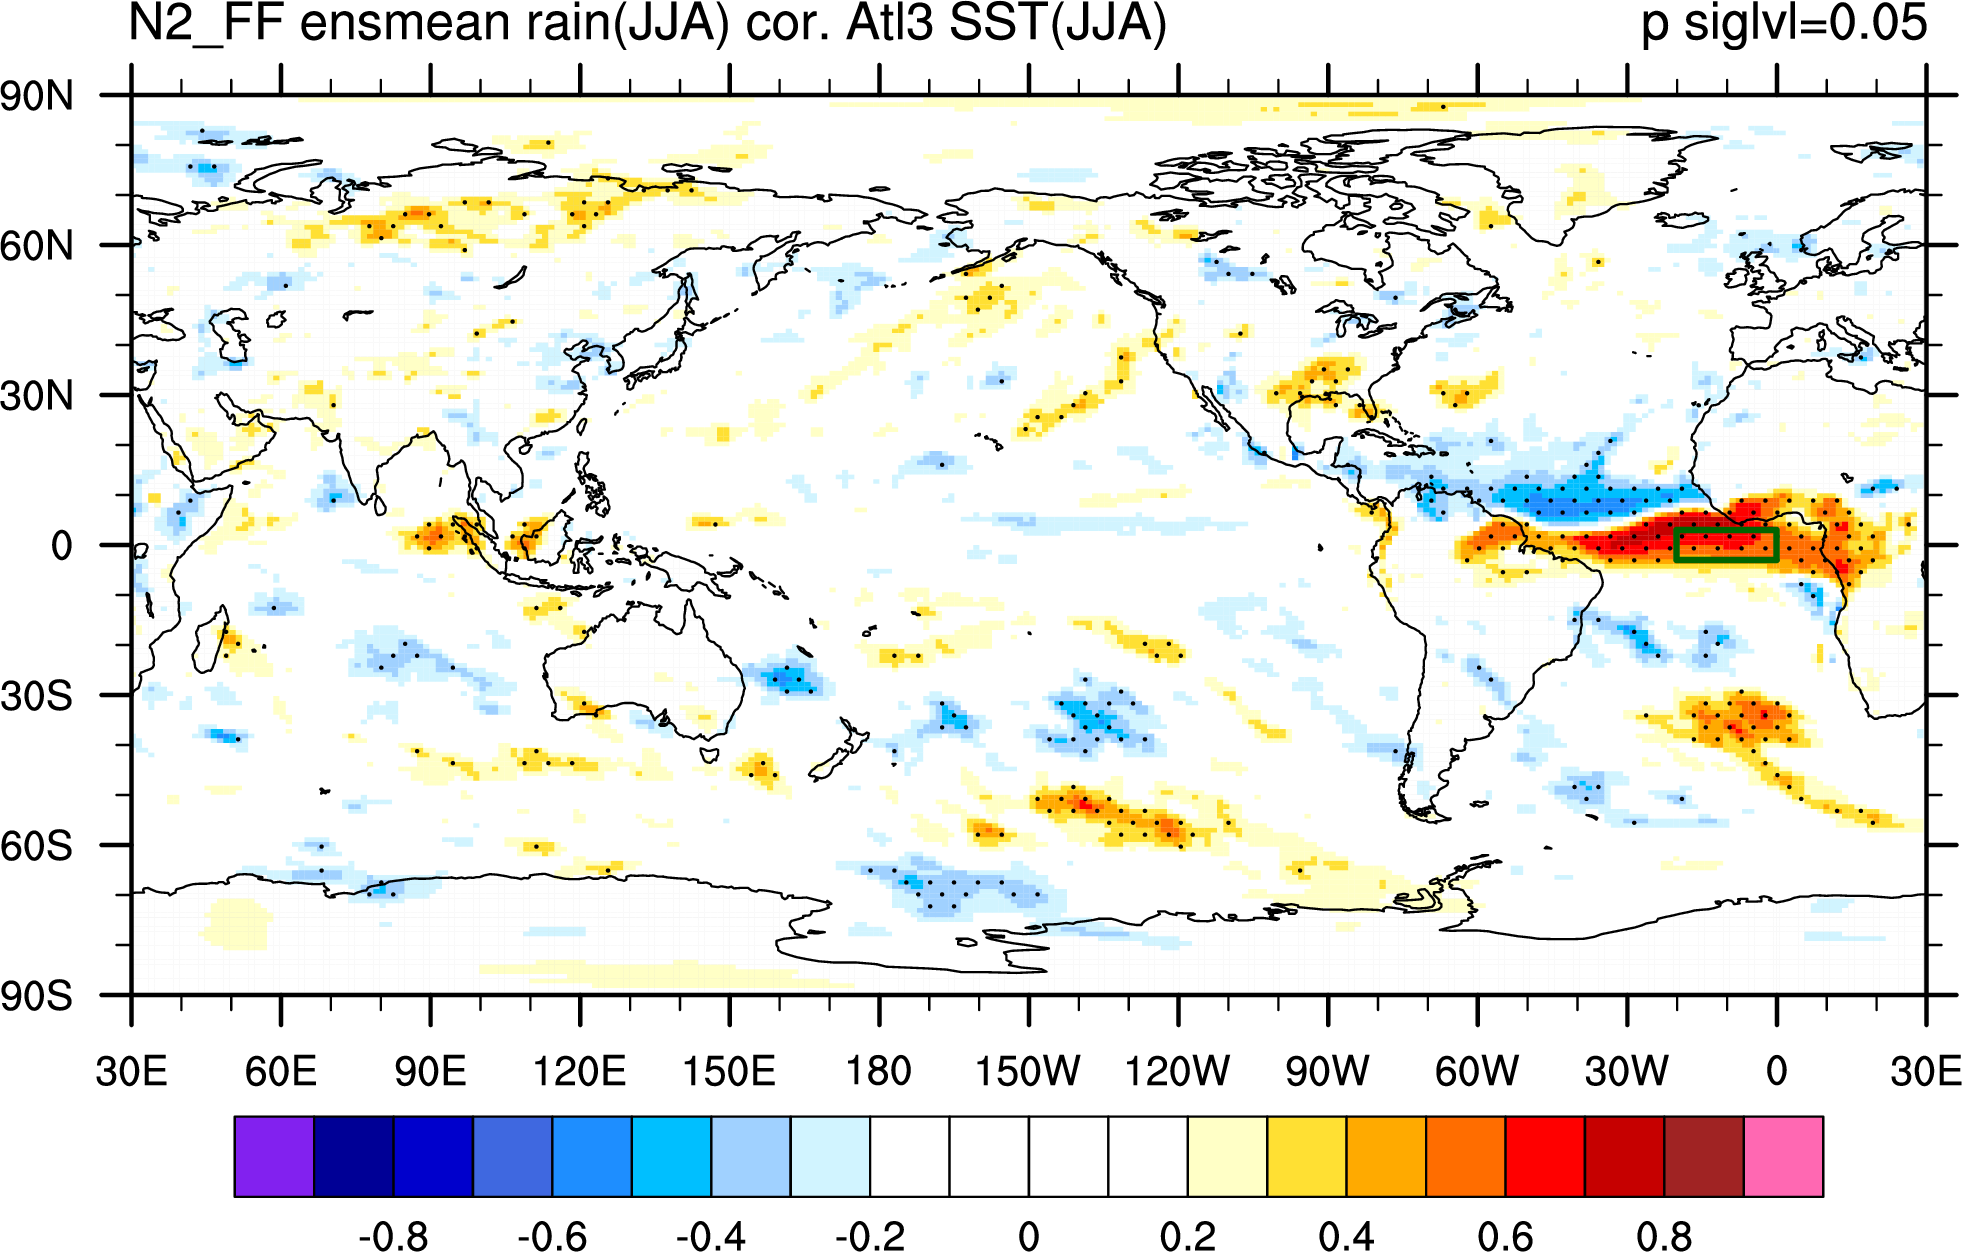
| Atl3 SST ts cor. prect map (ensmean) | |||||
|
|||||