Summary:
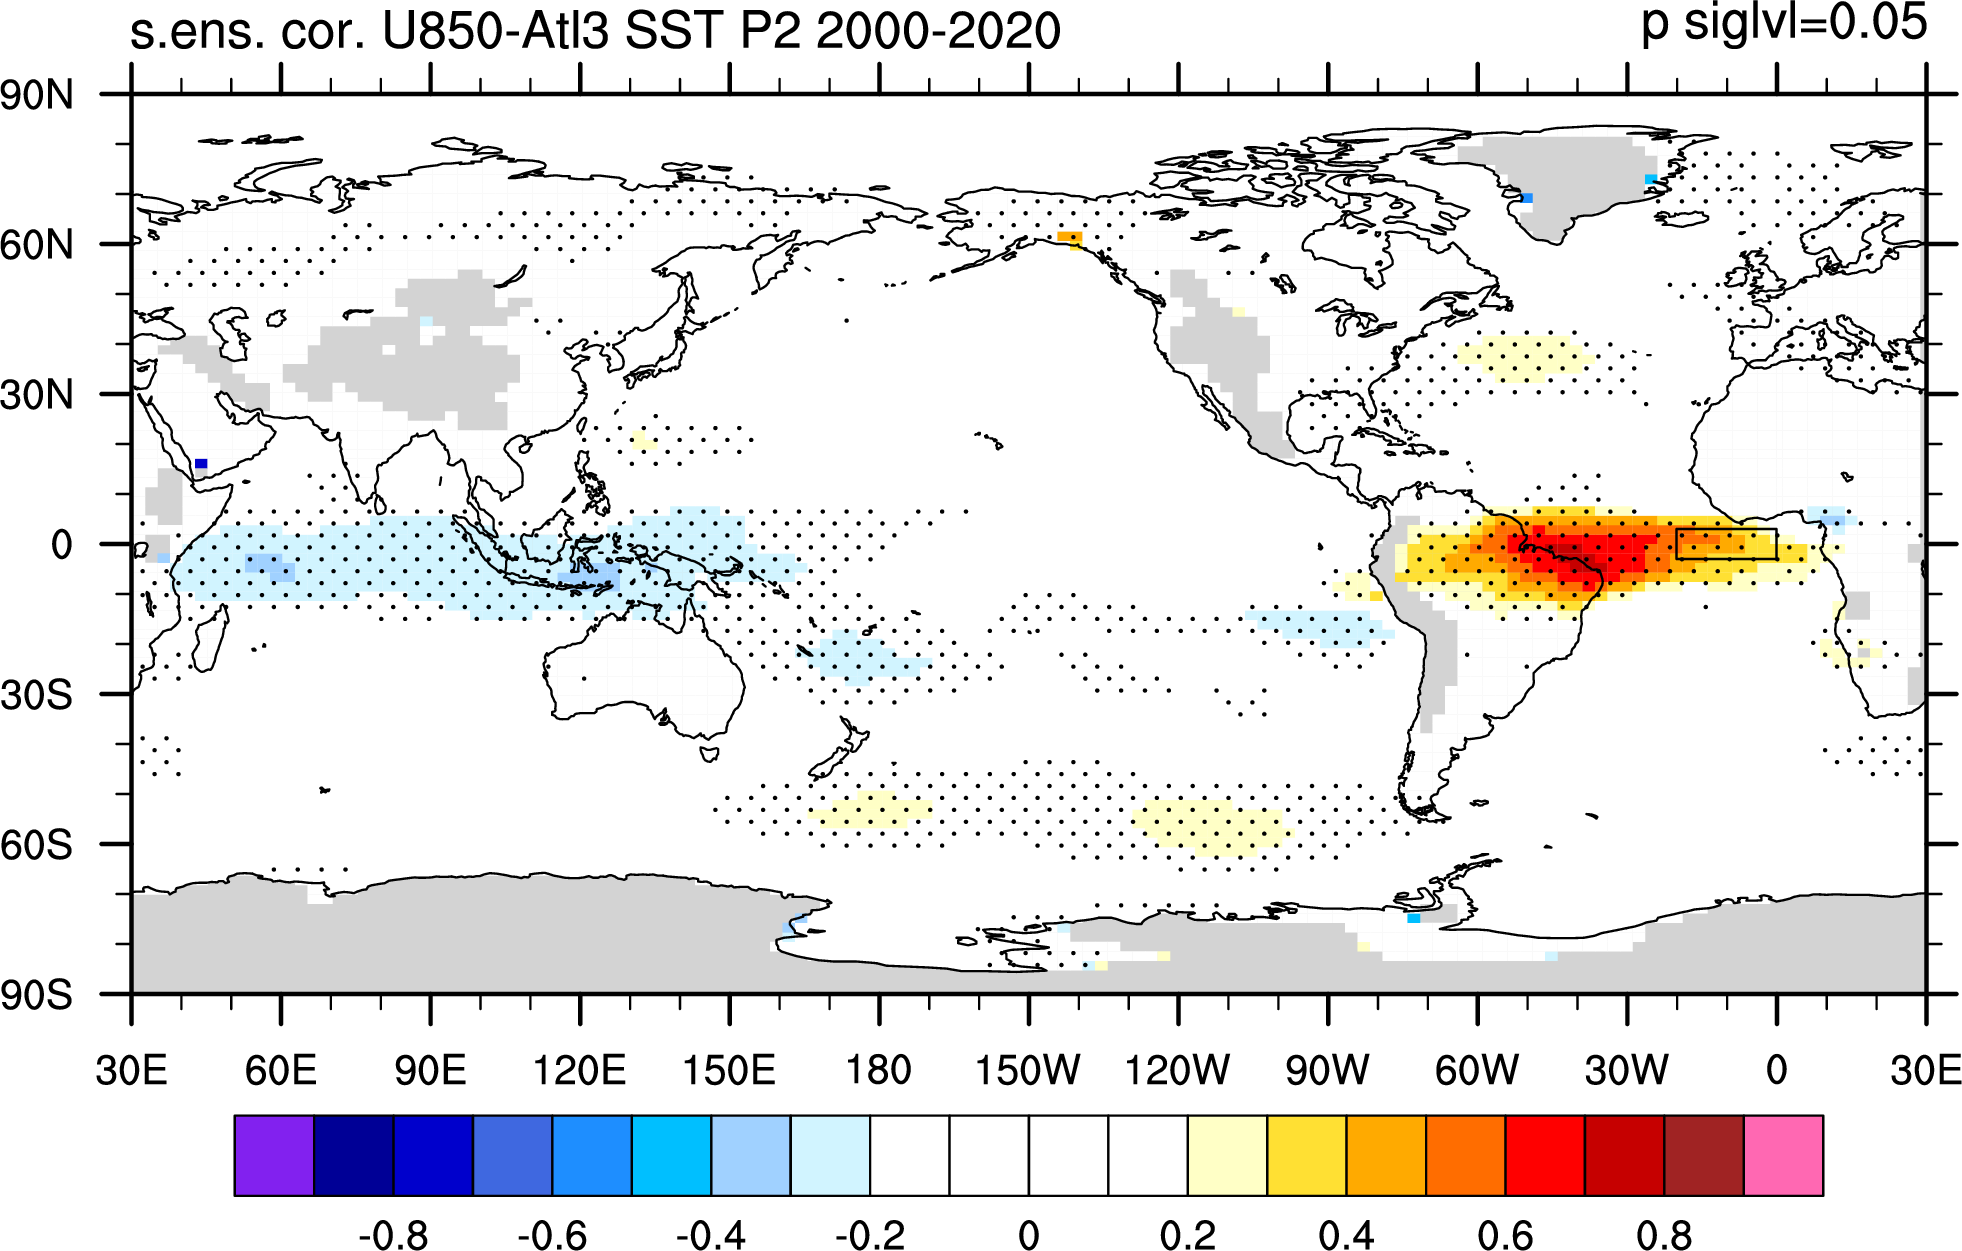
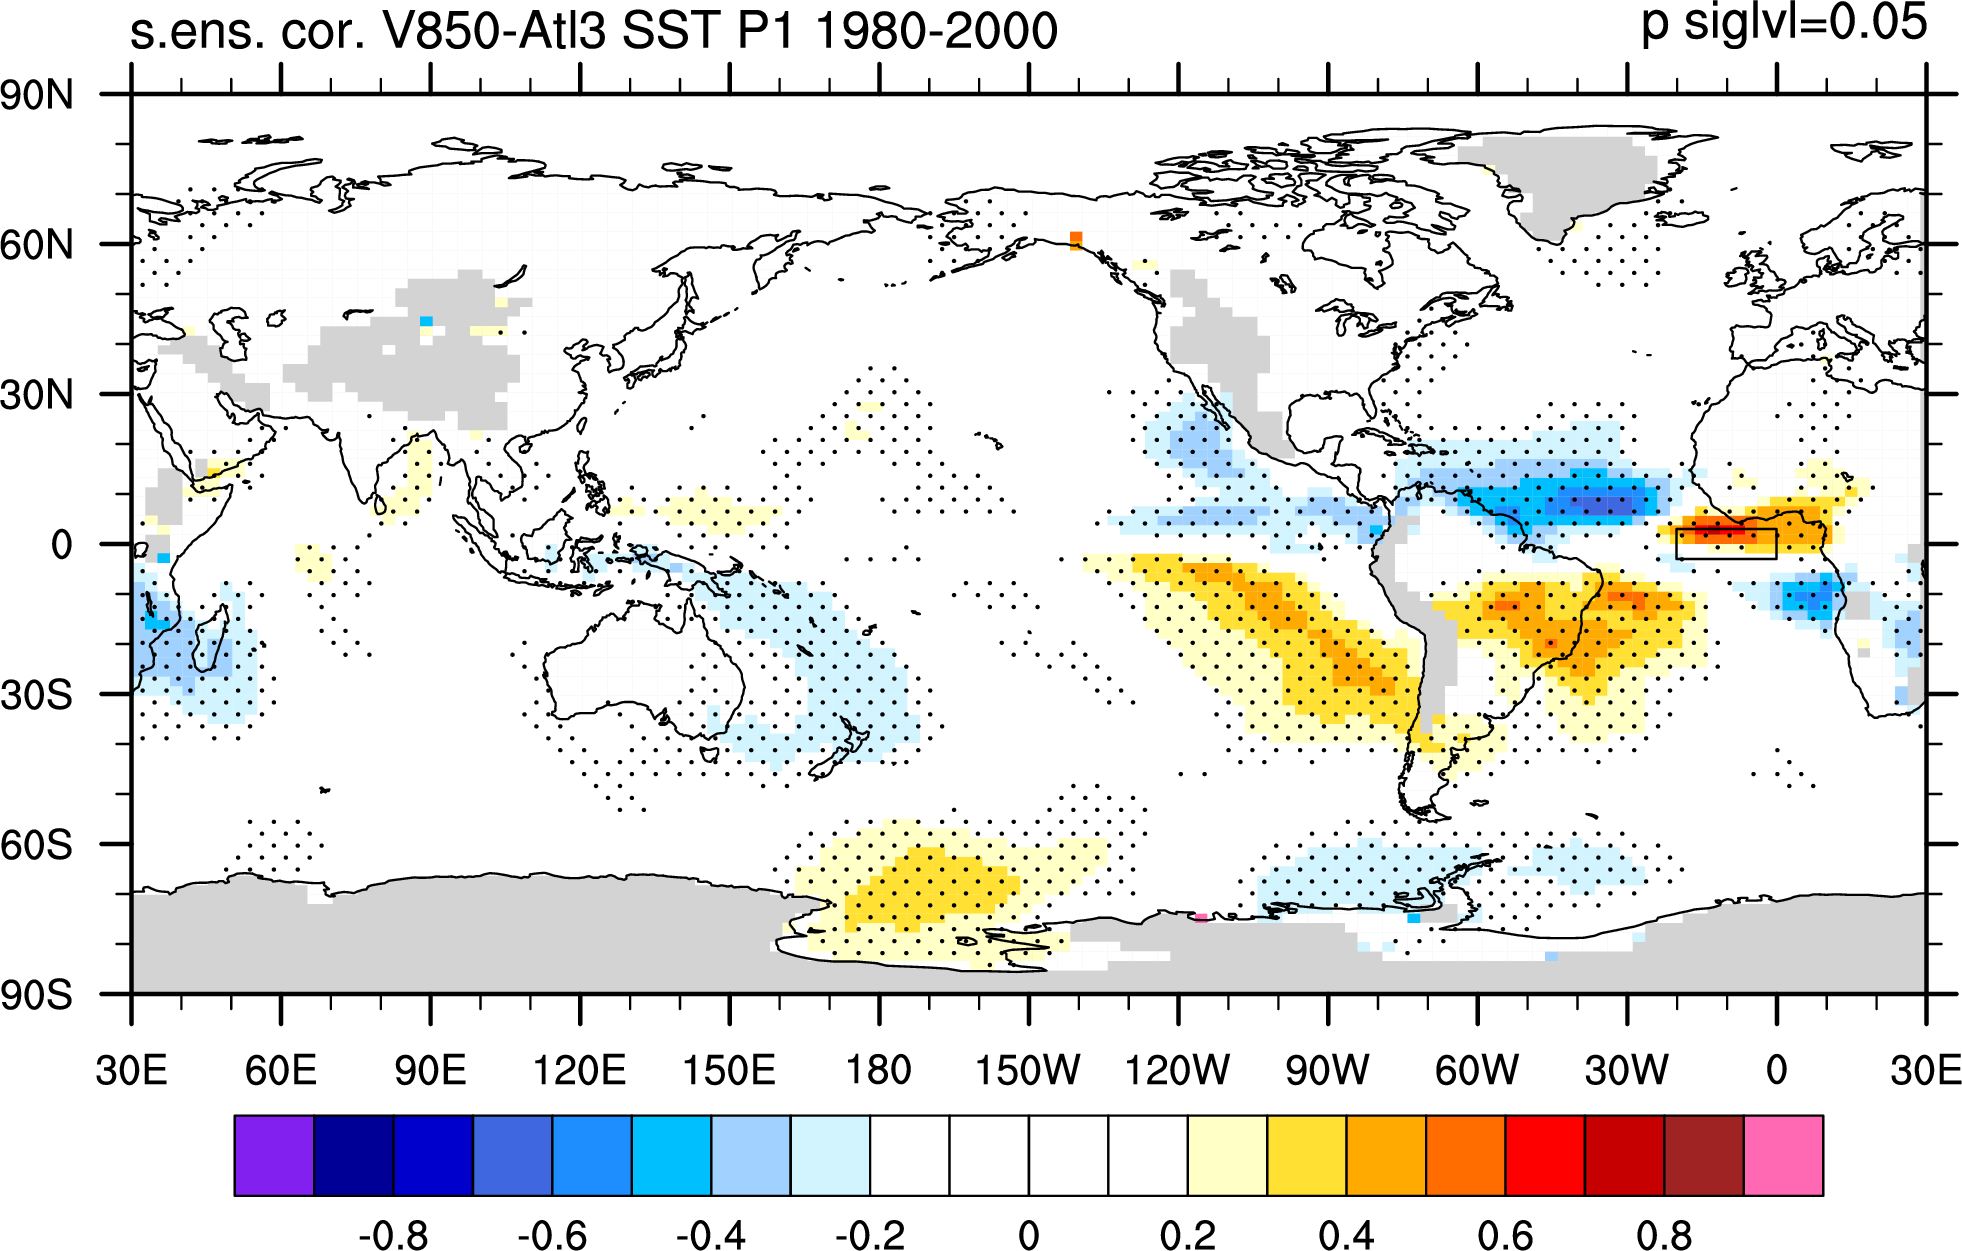
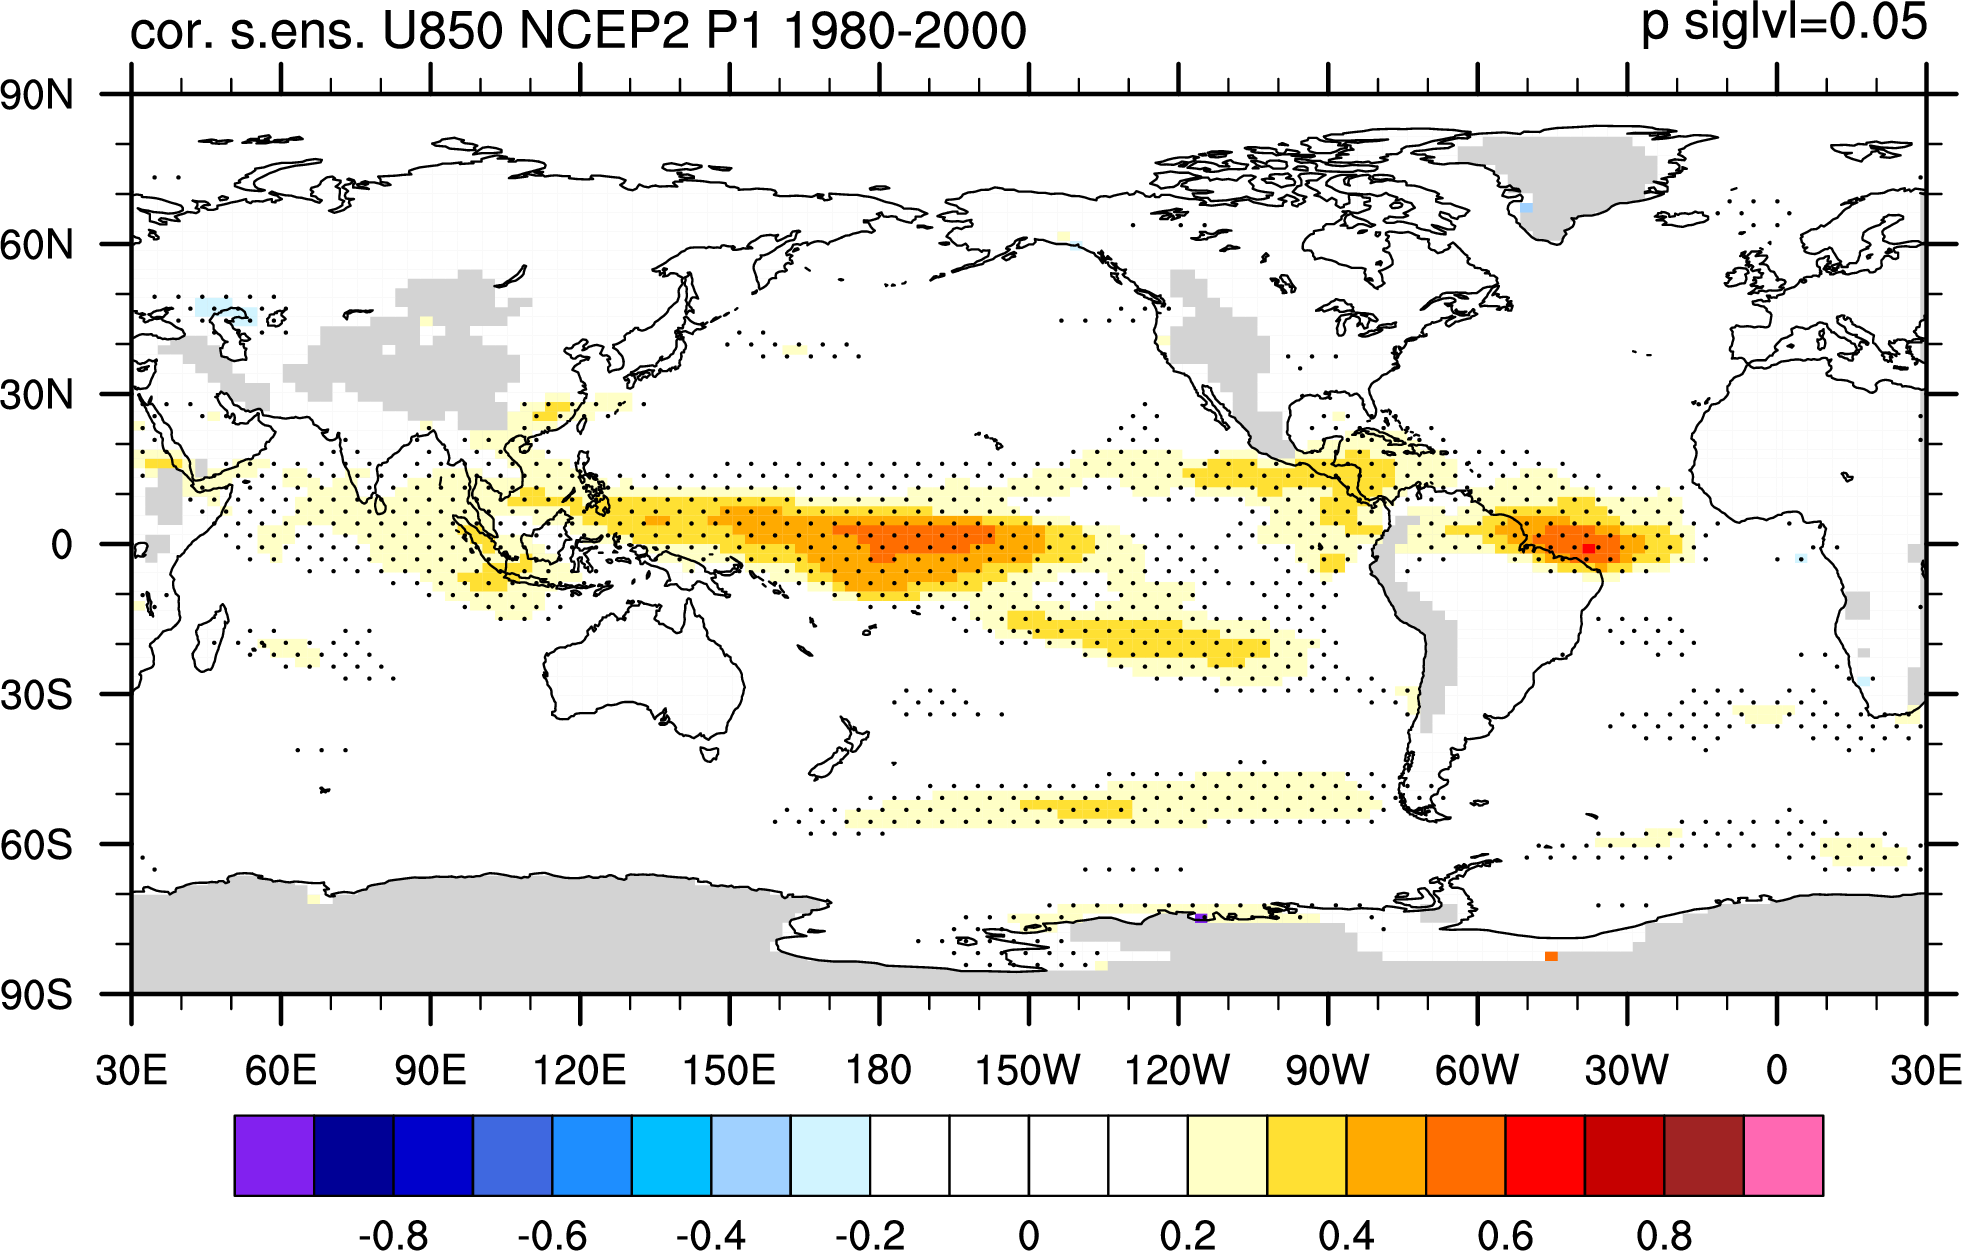
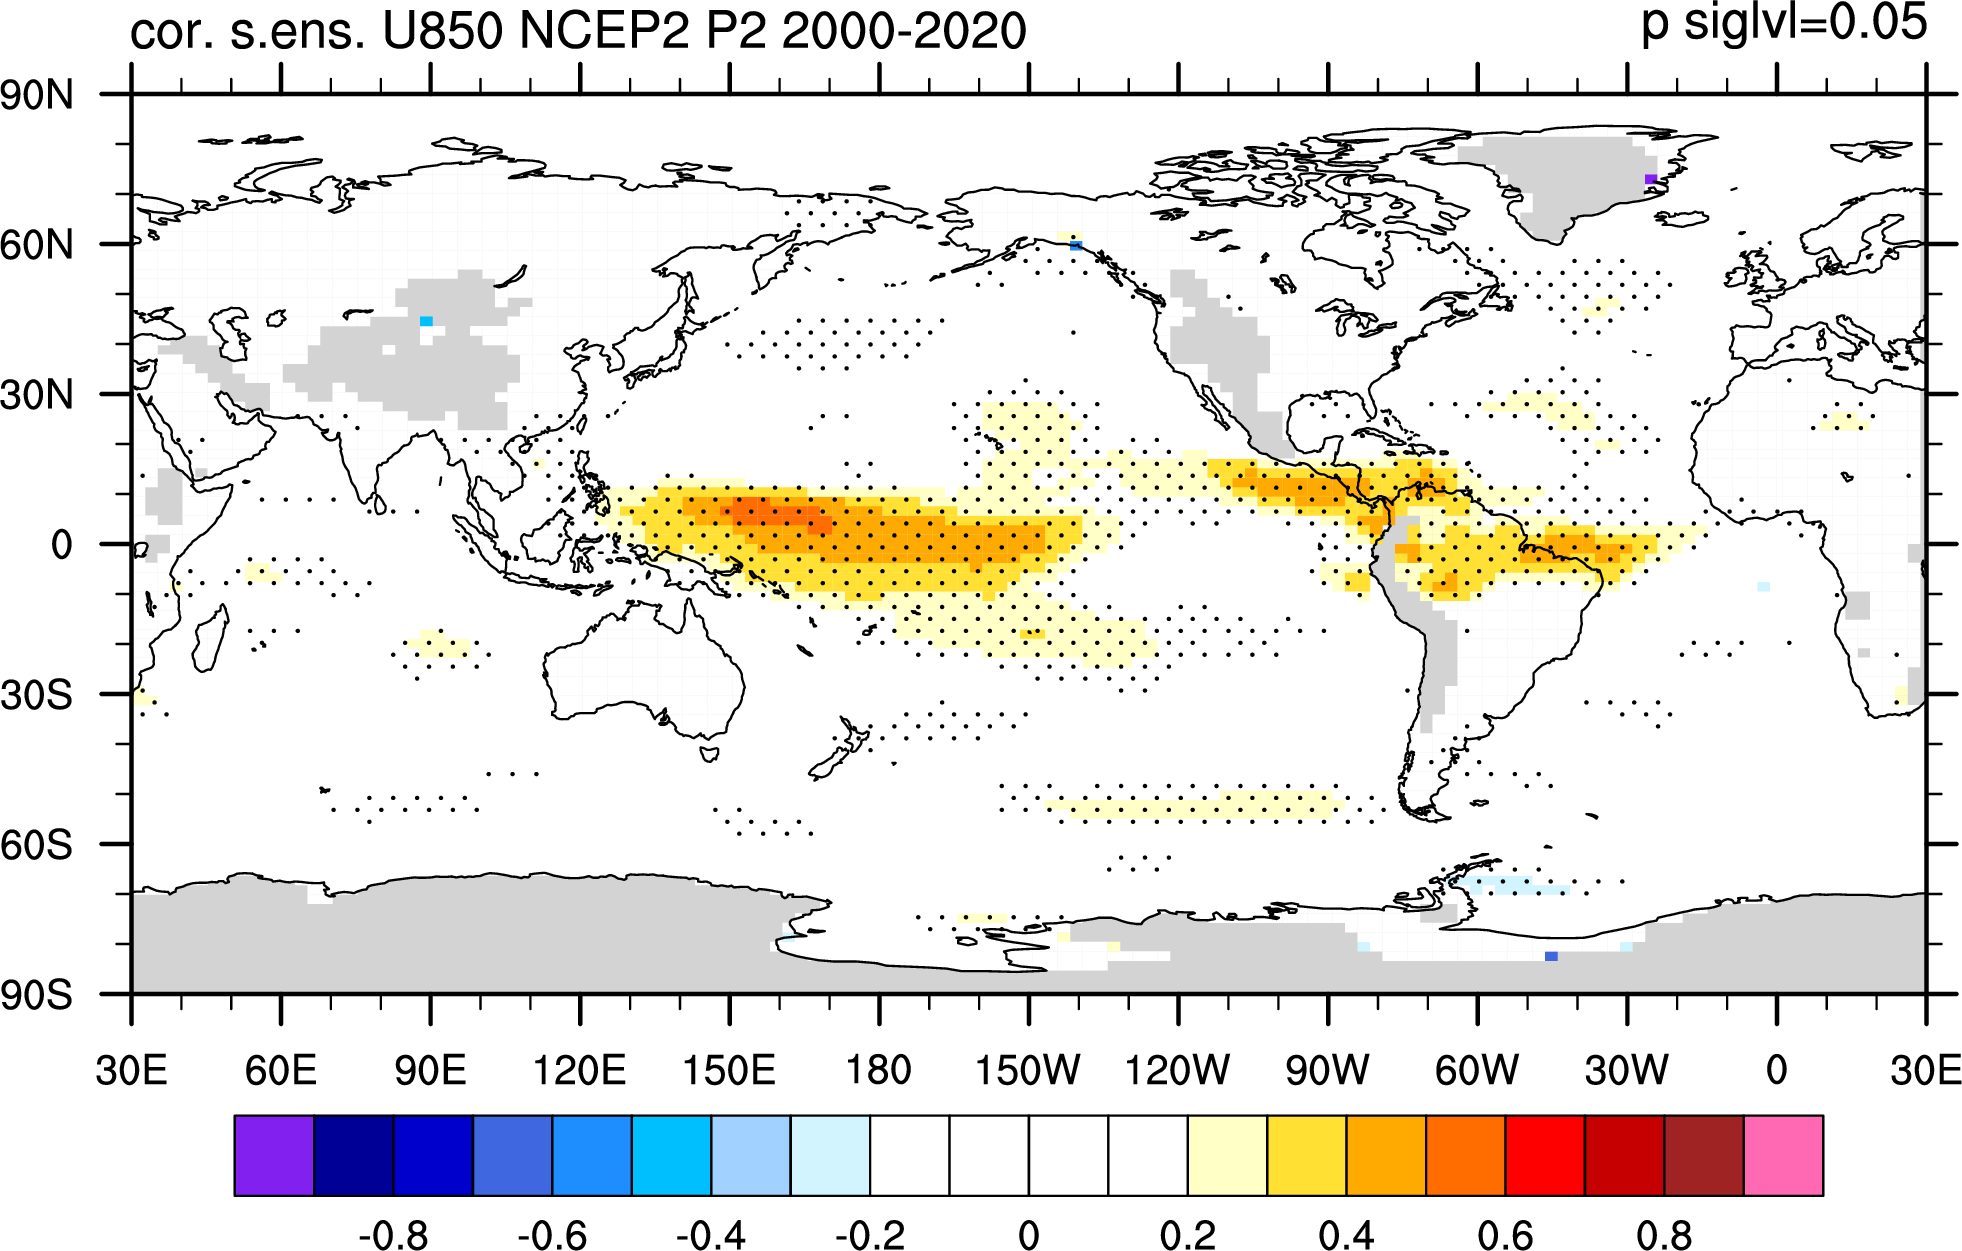
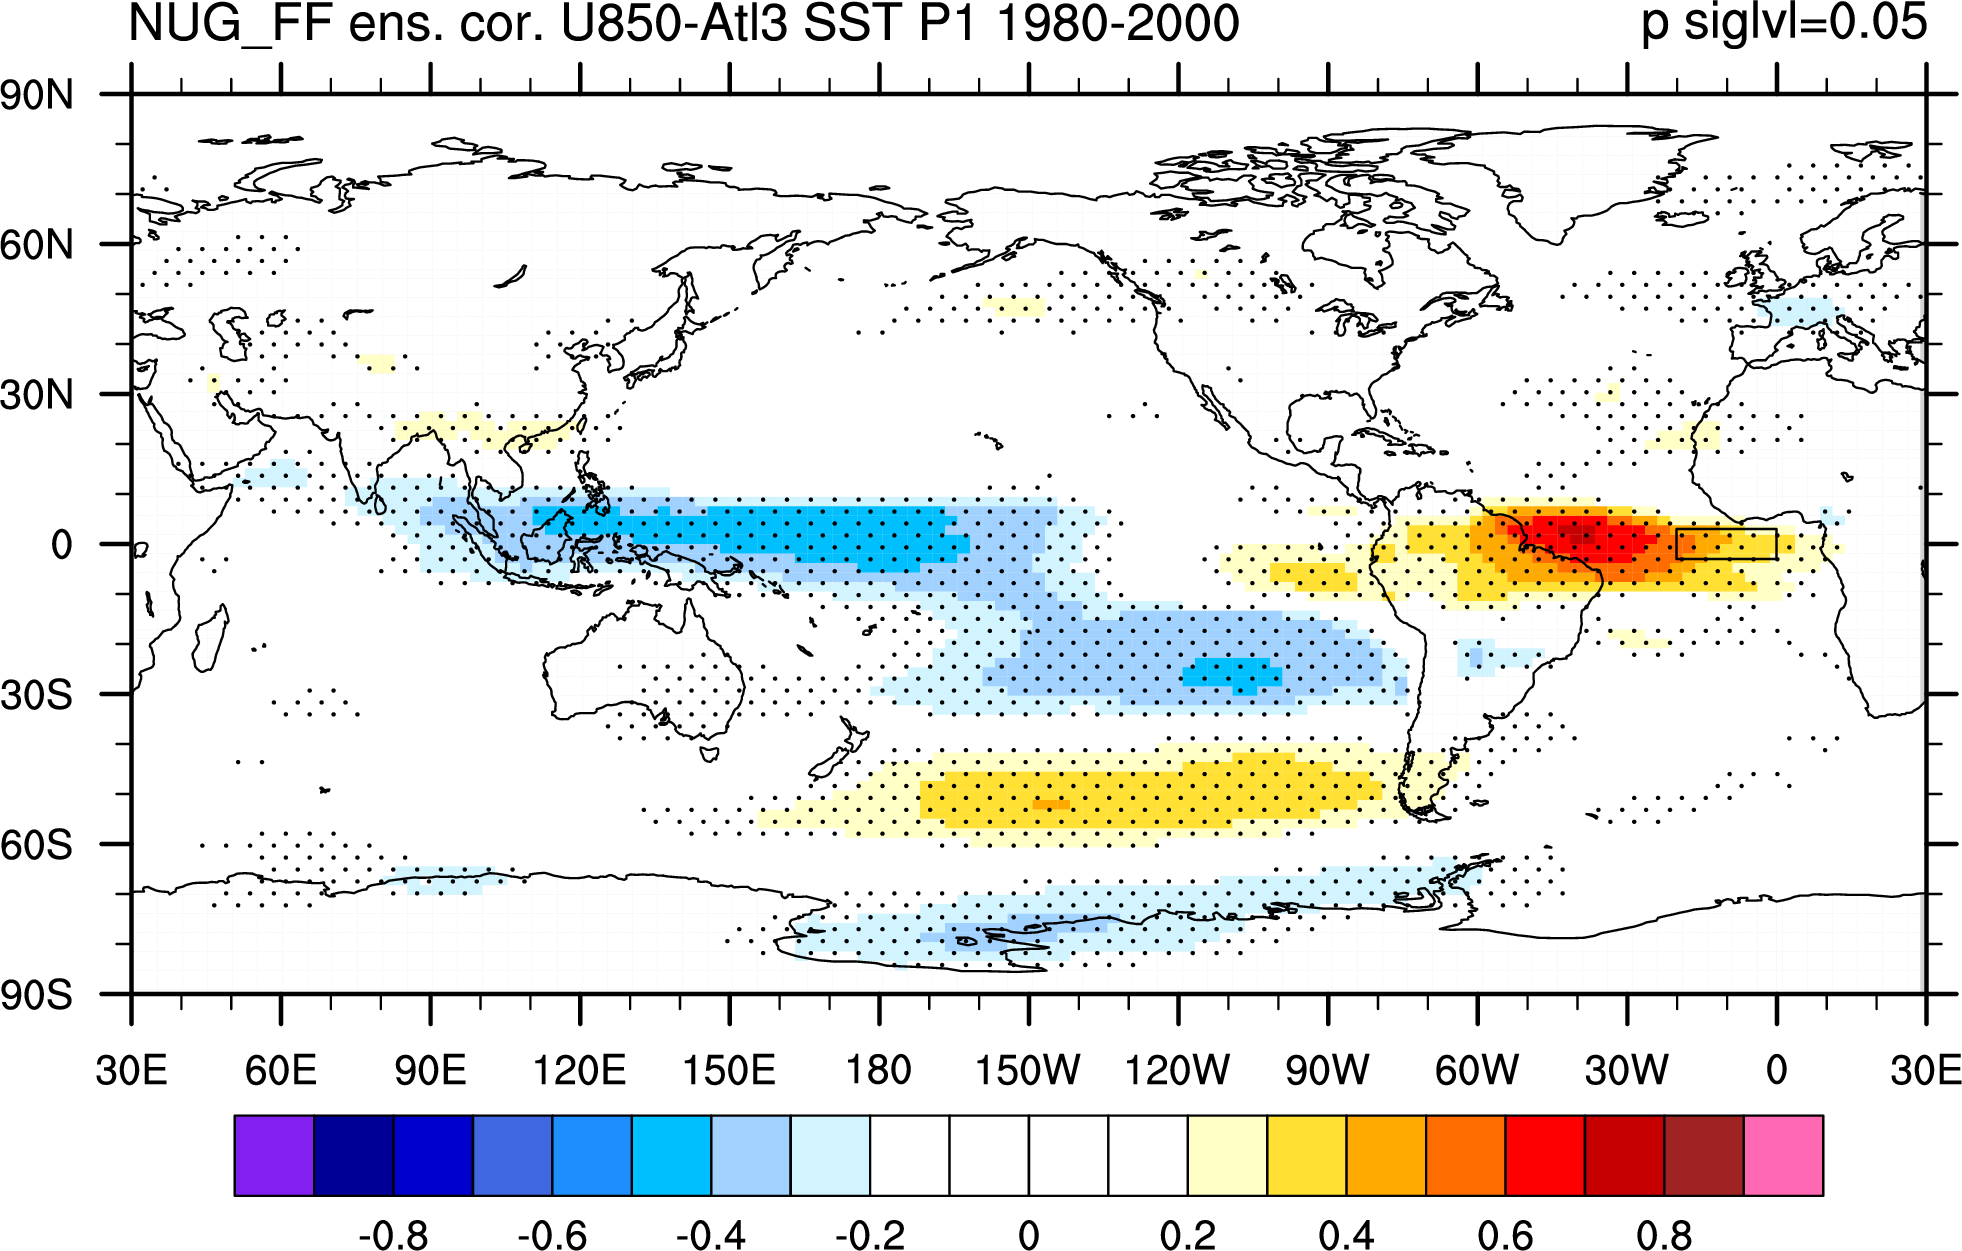
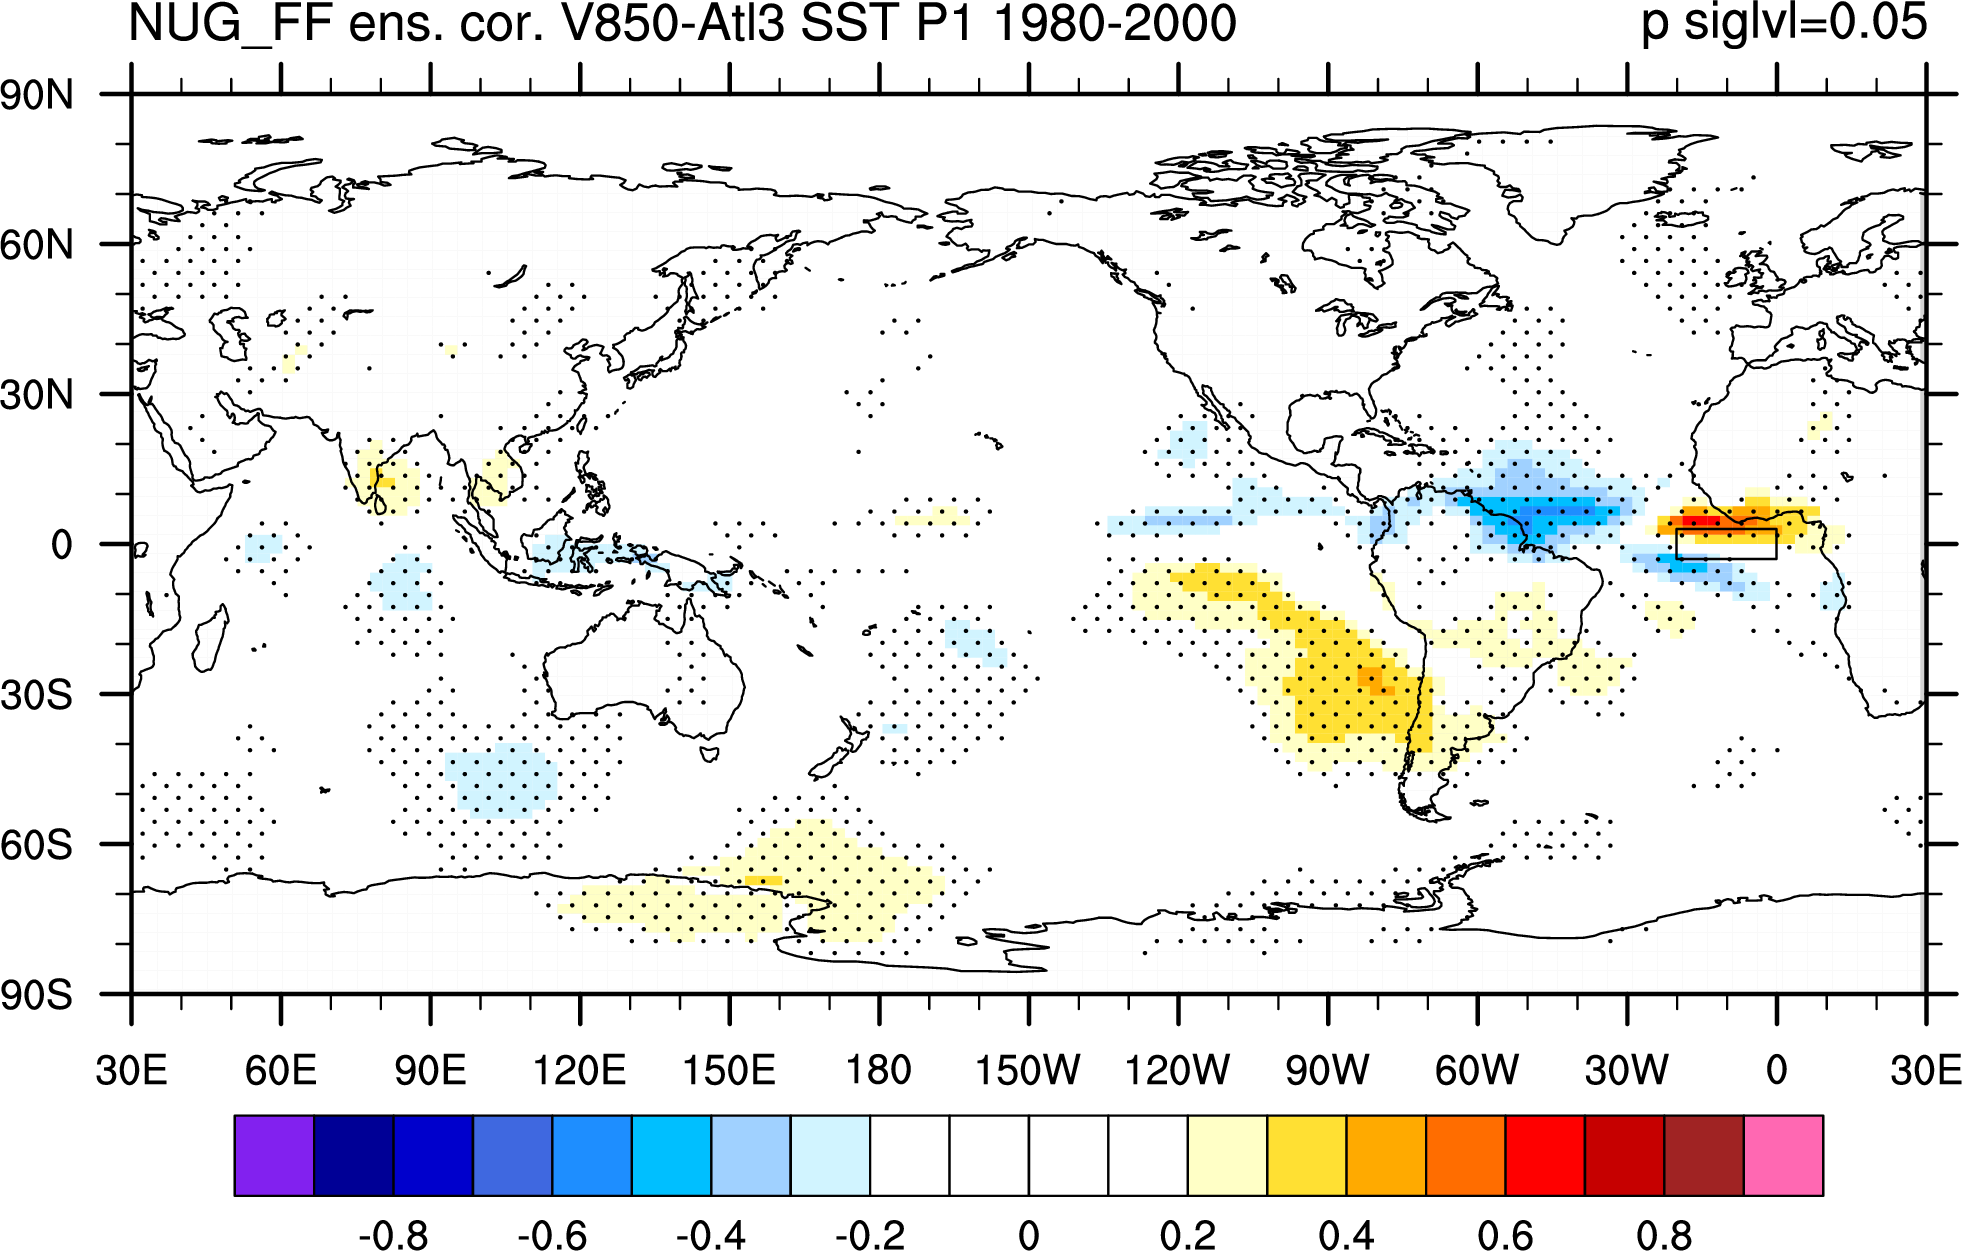
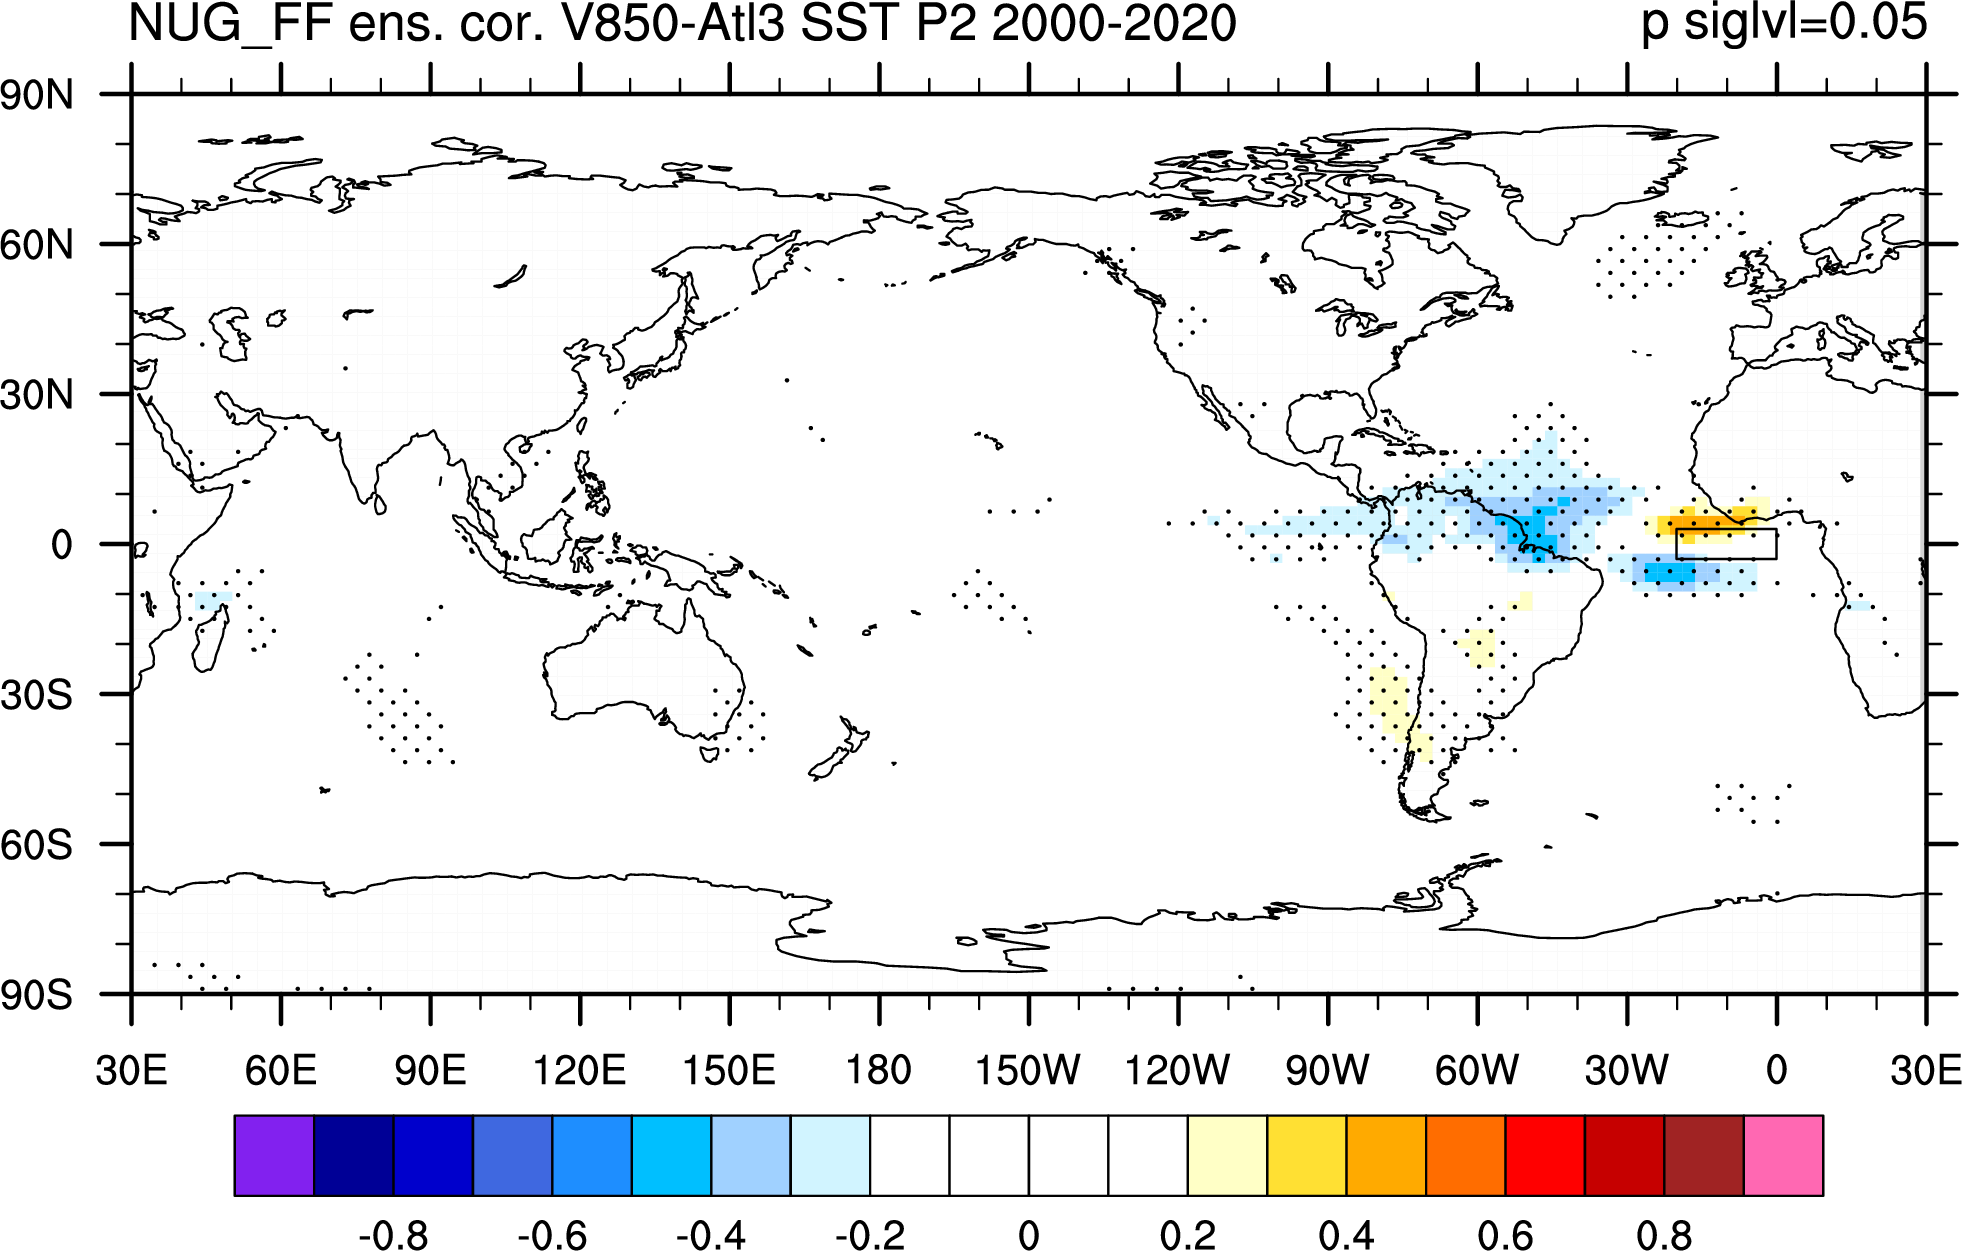
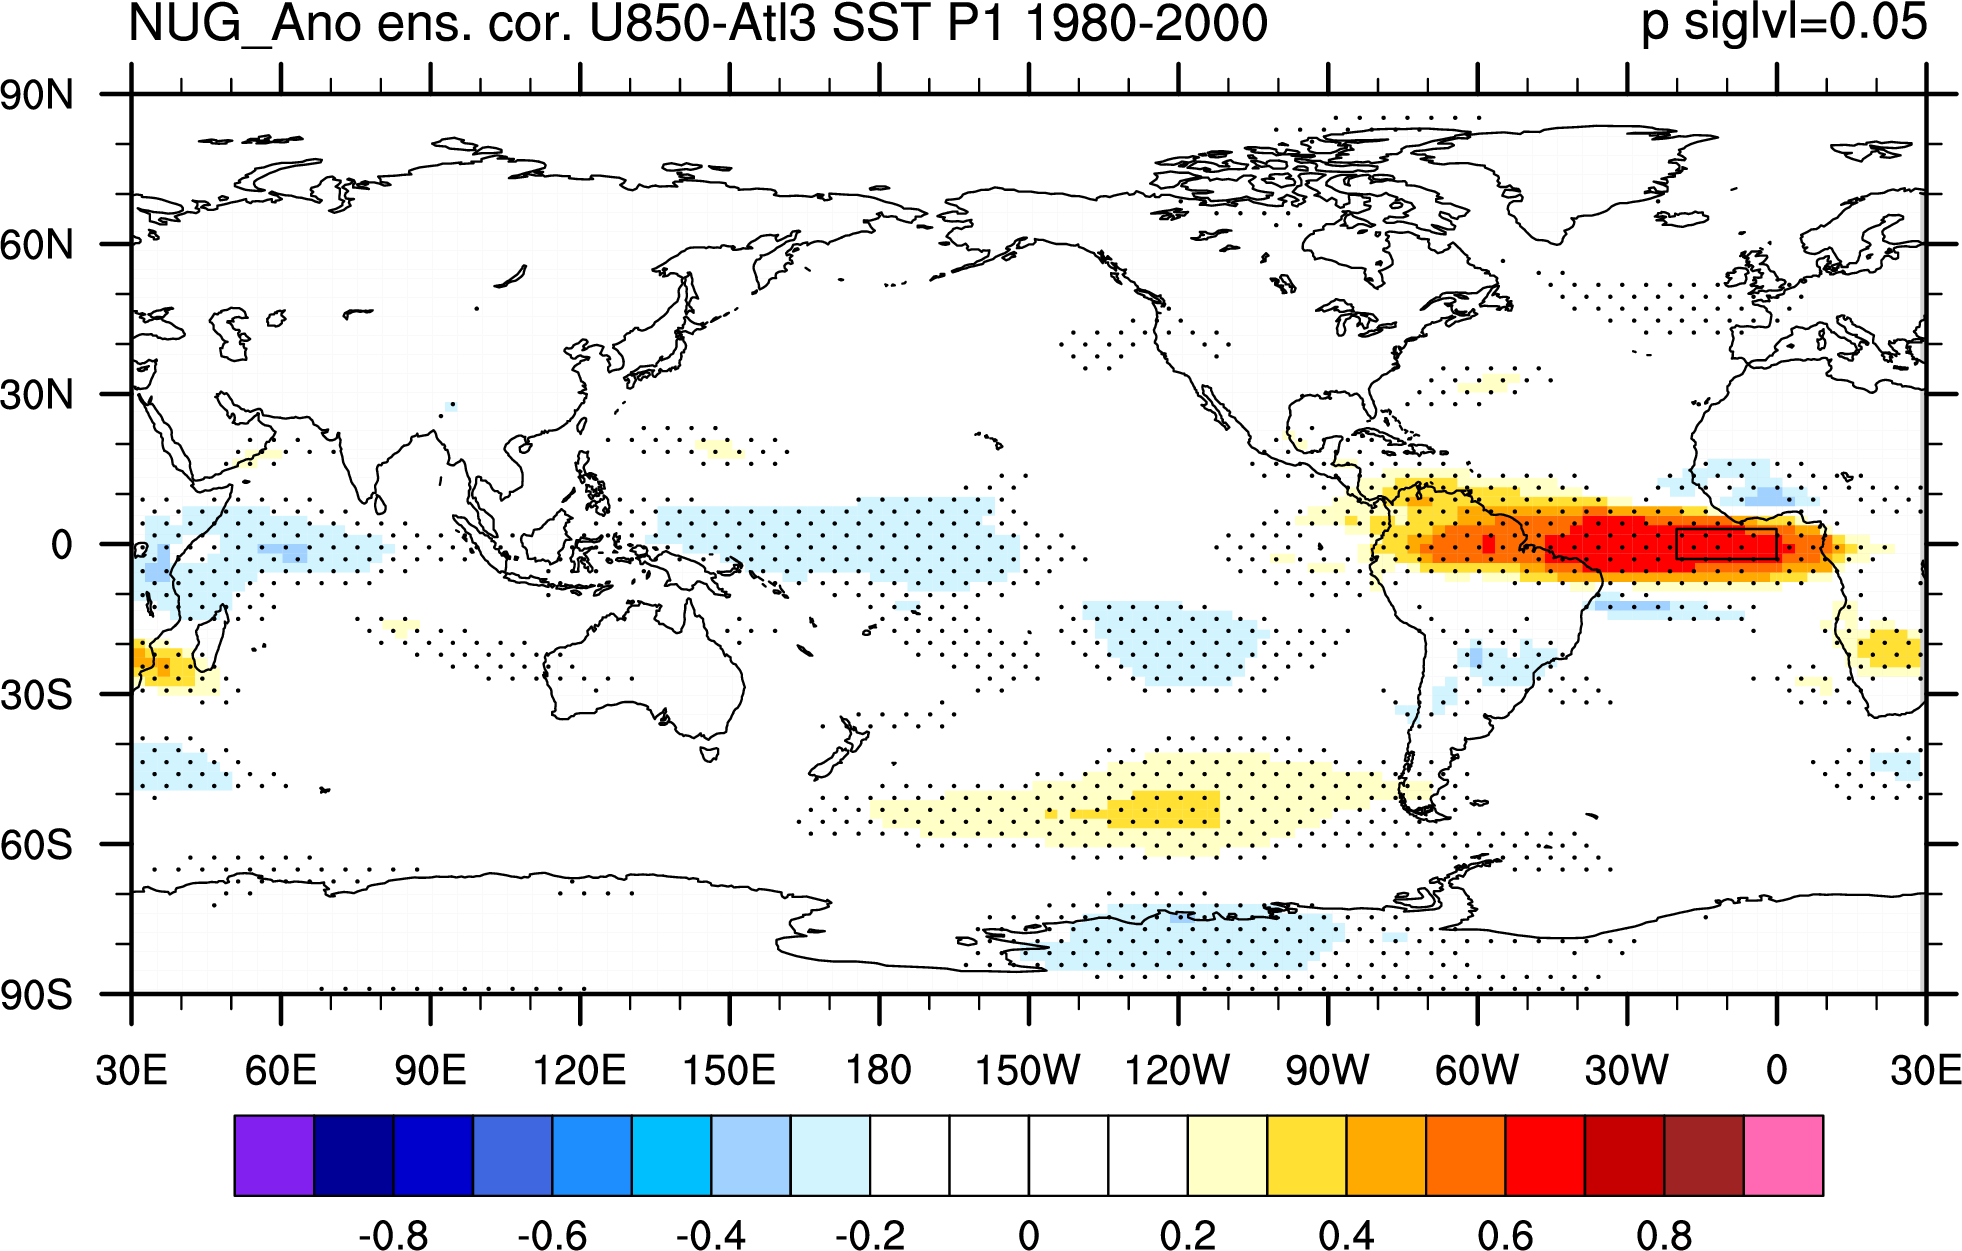
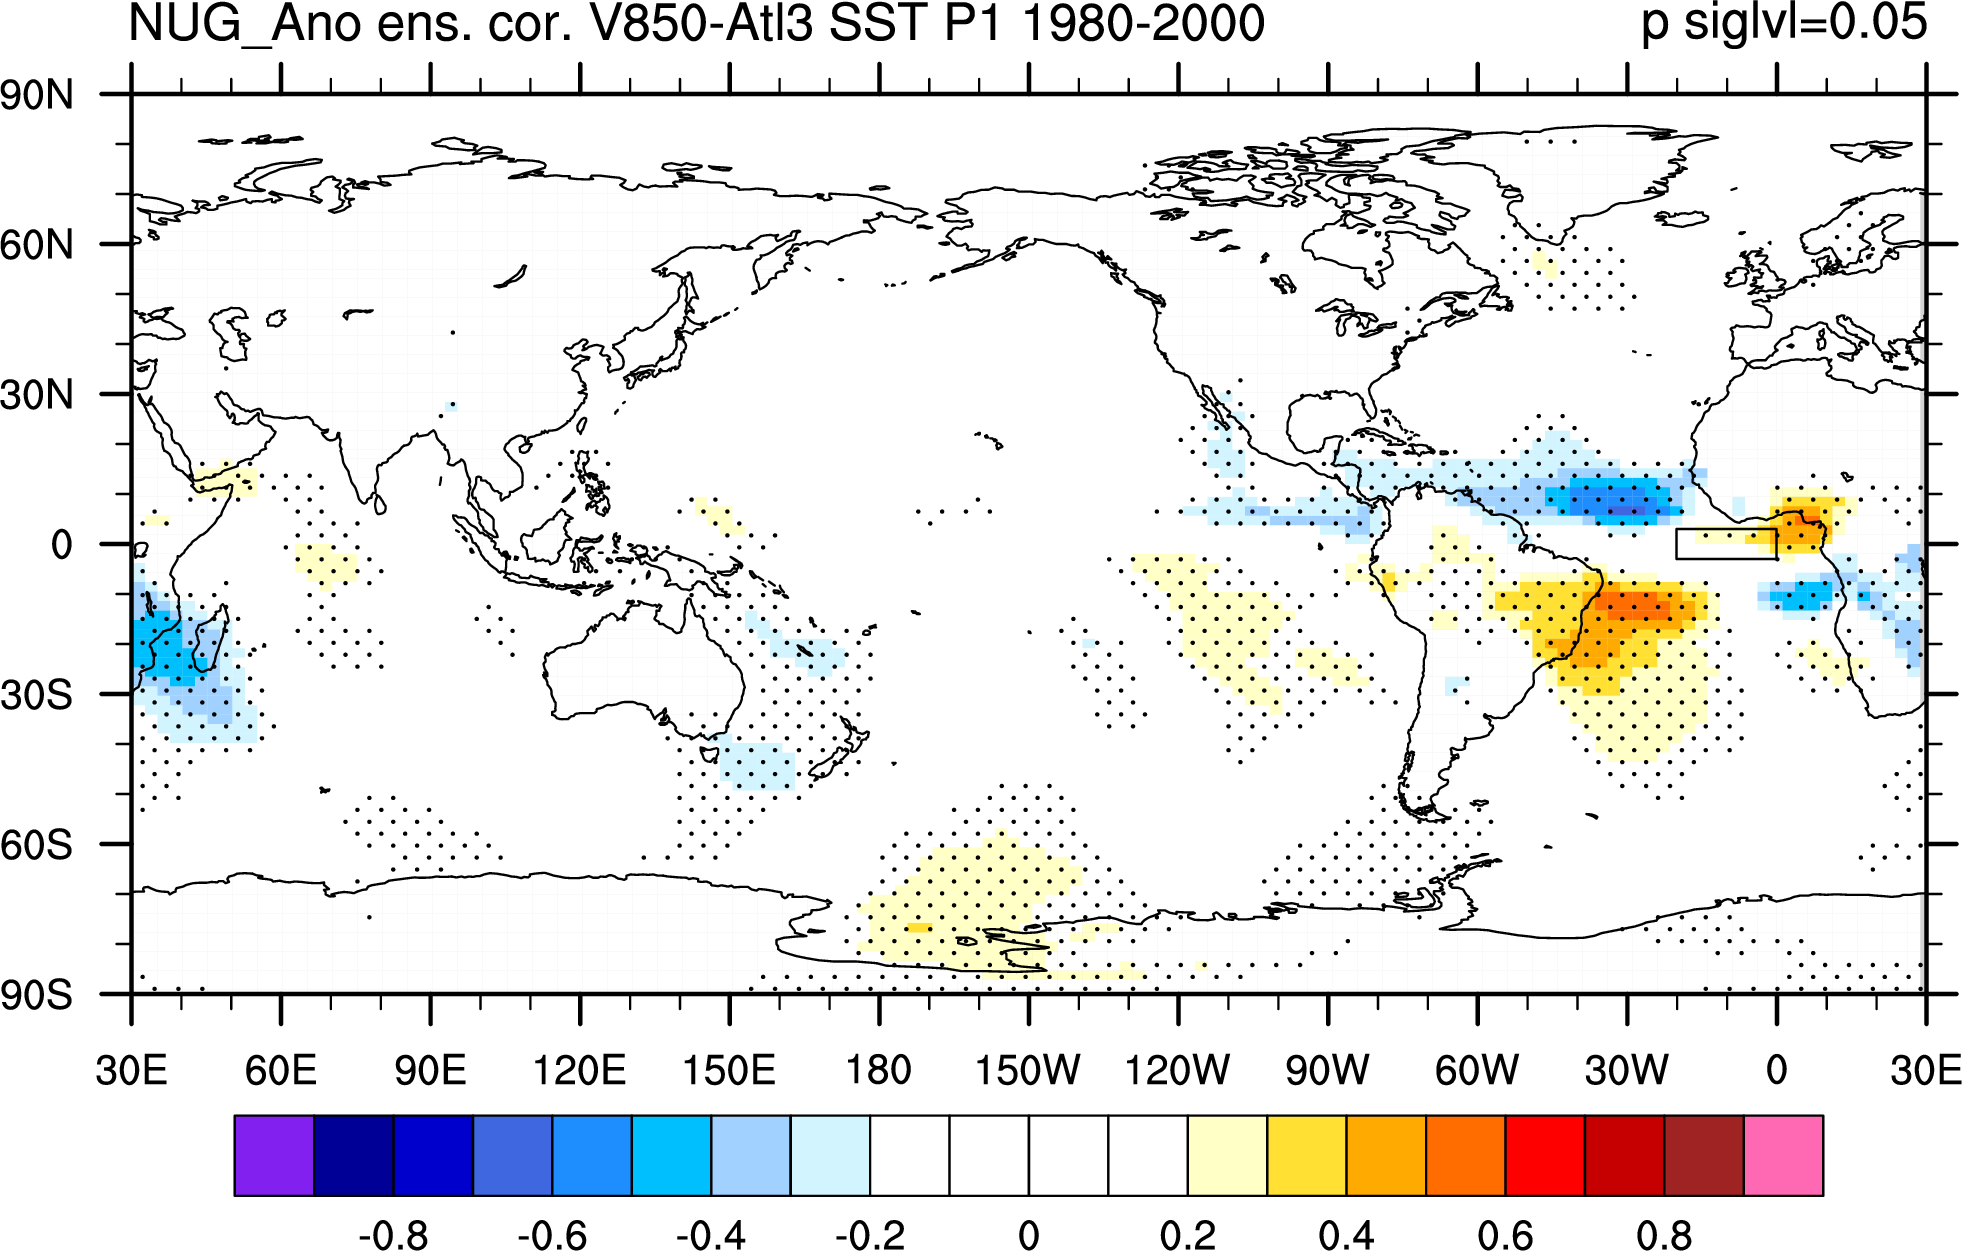
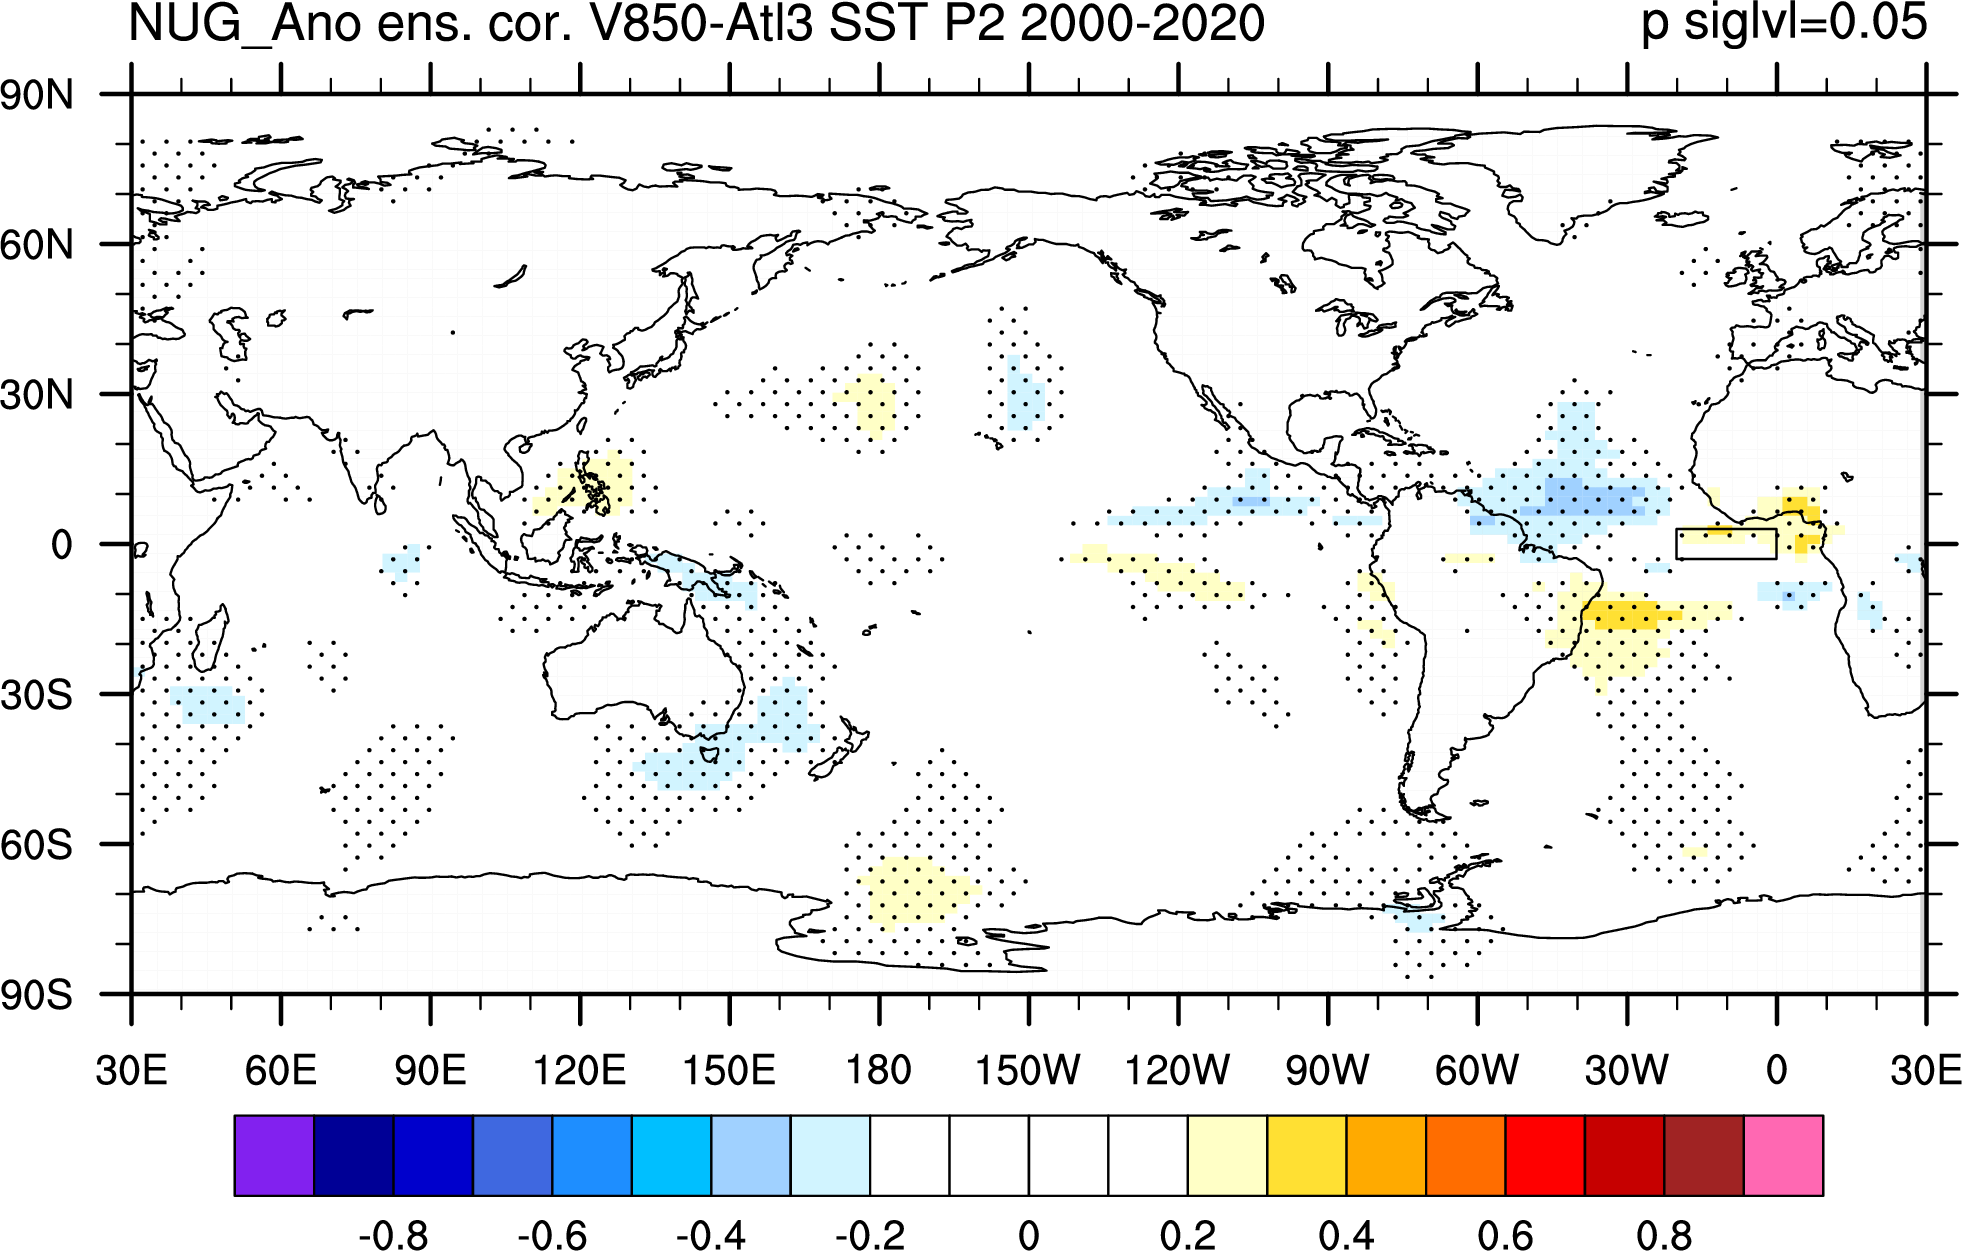
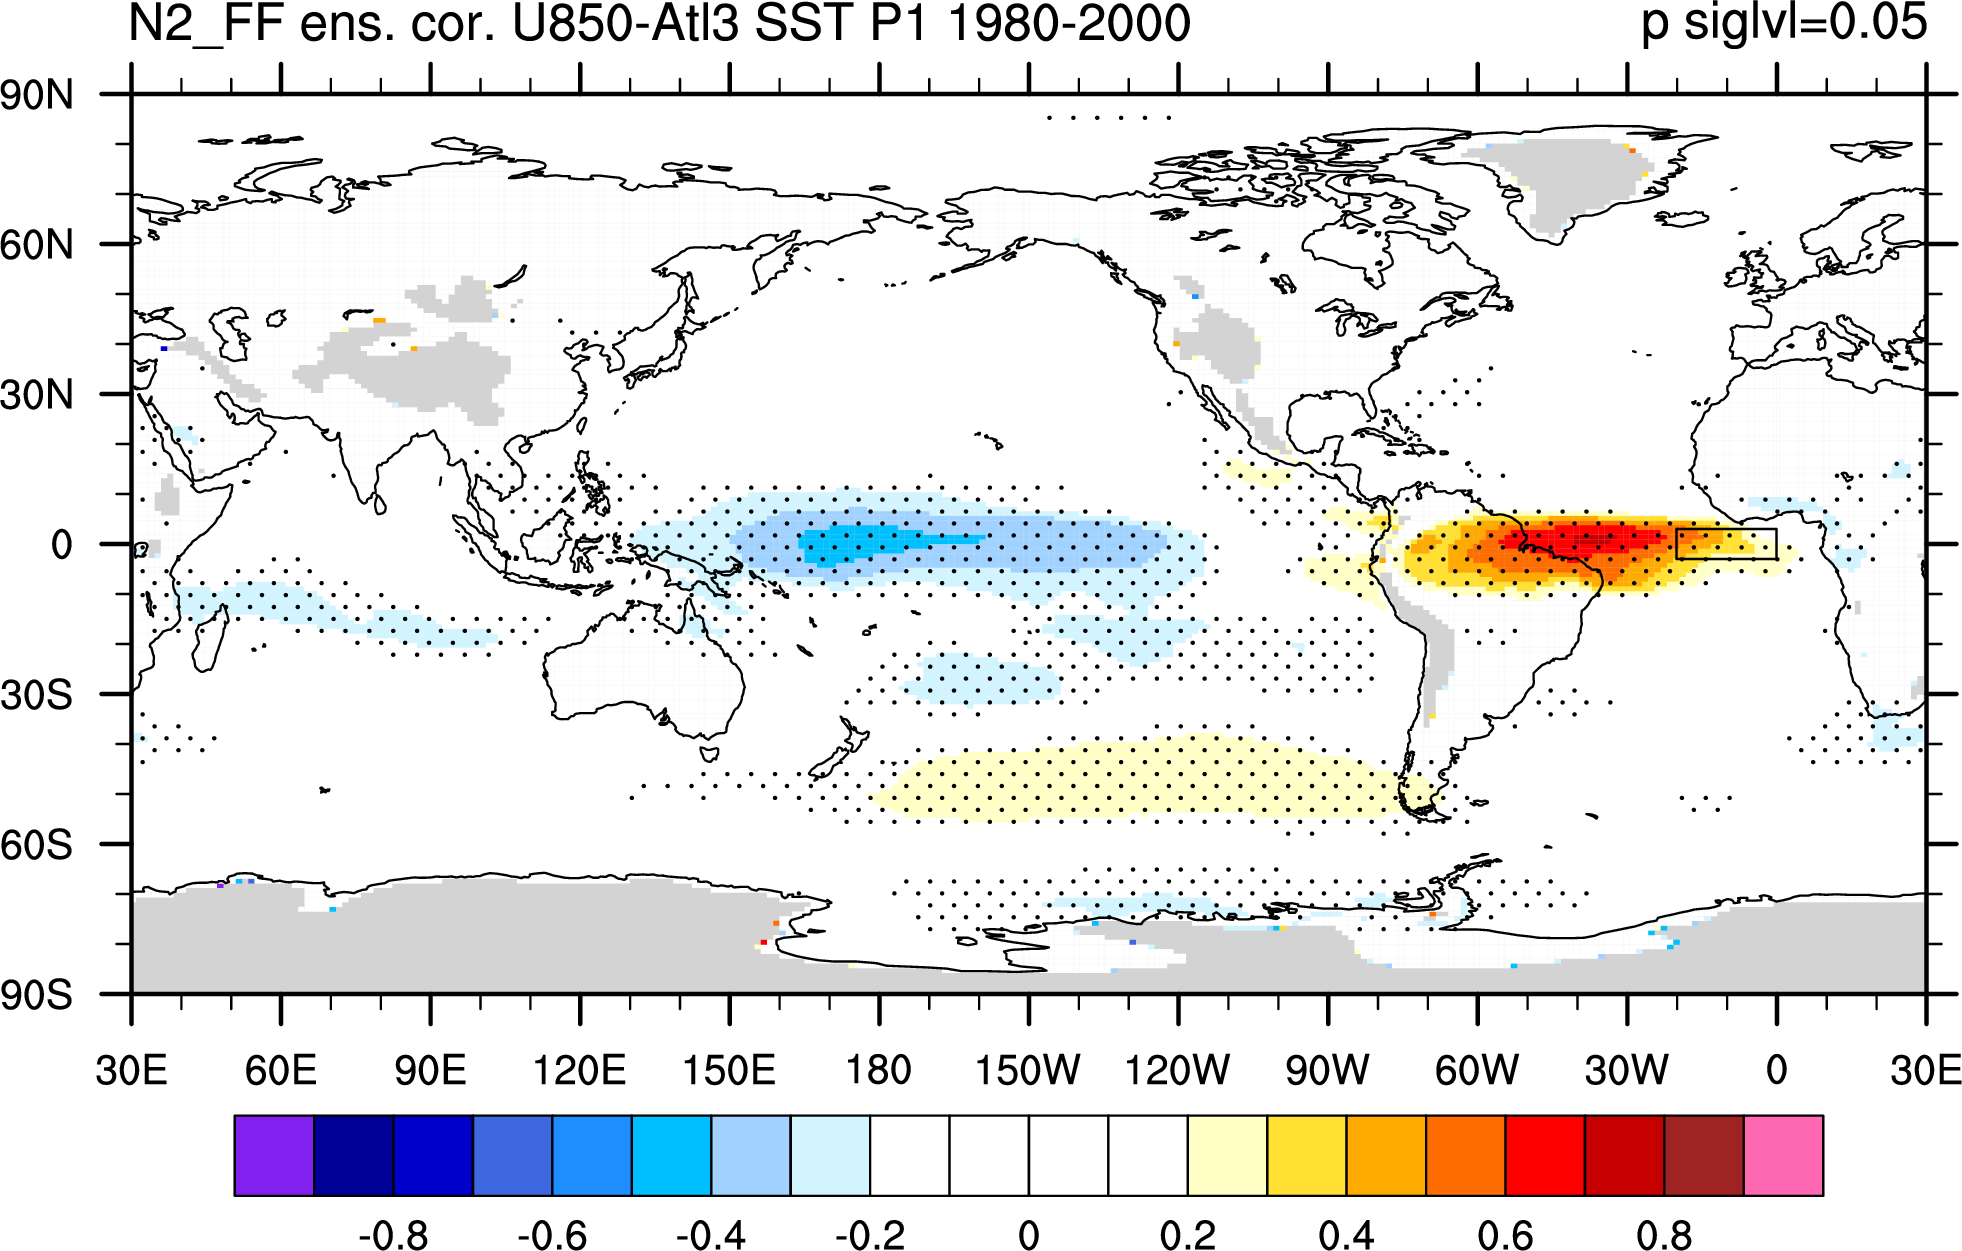
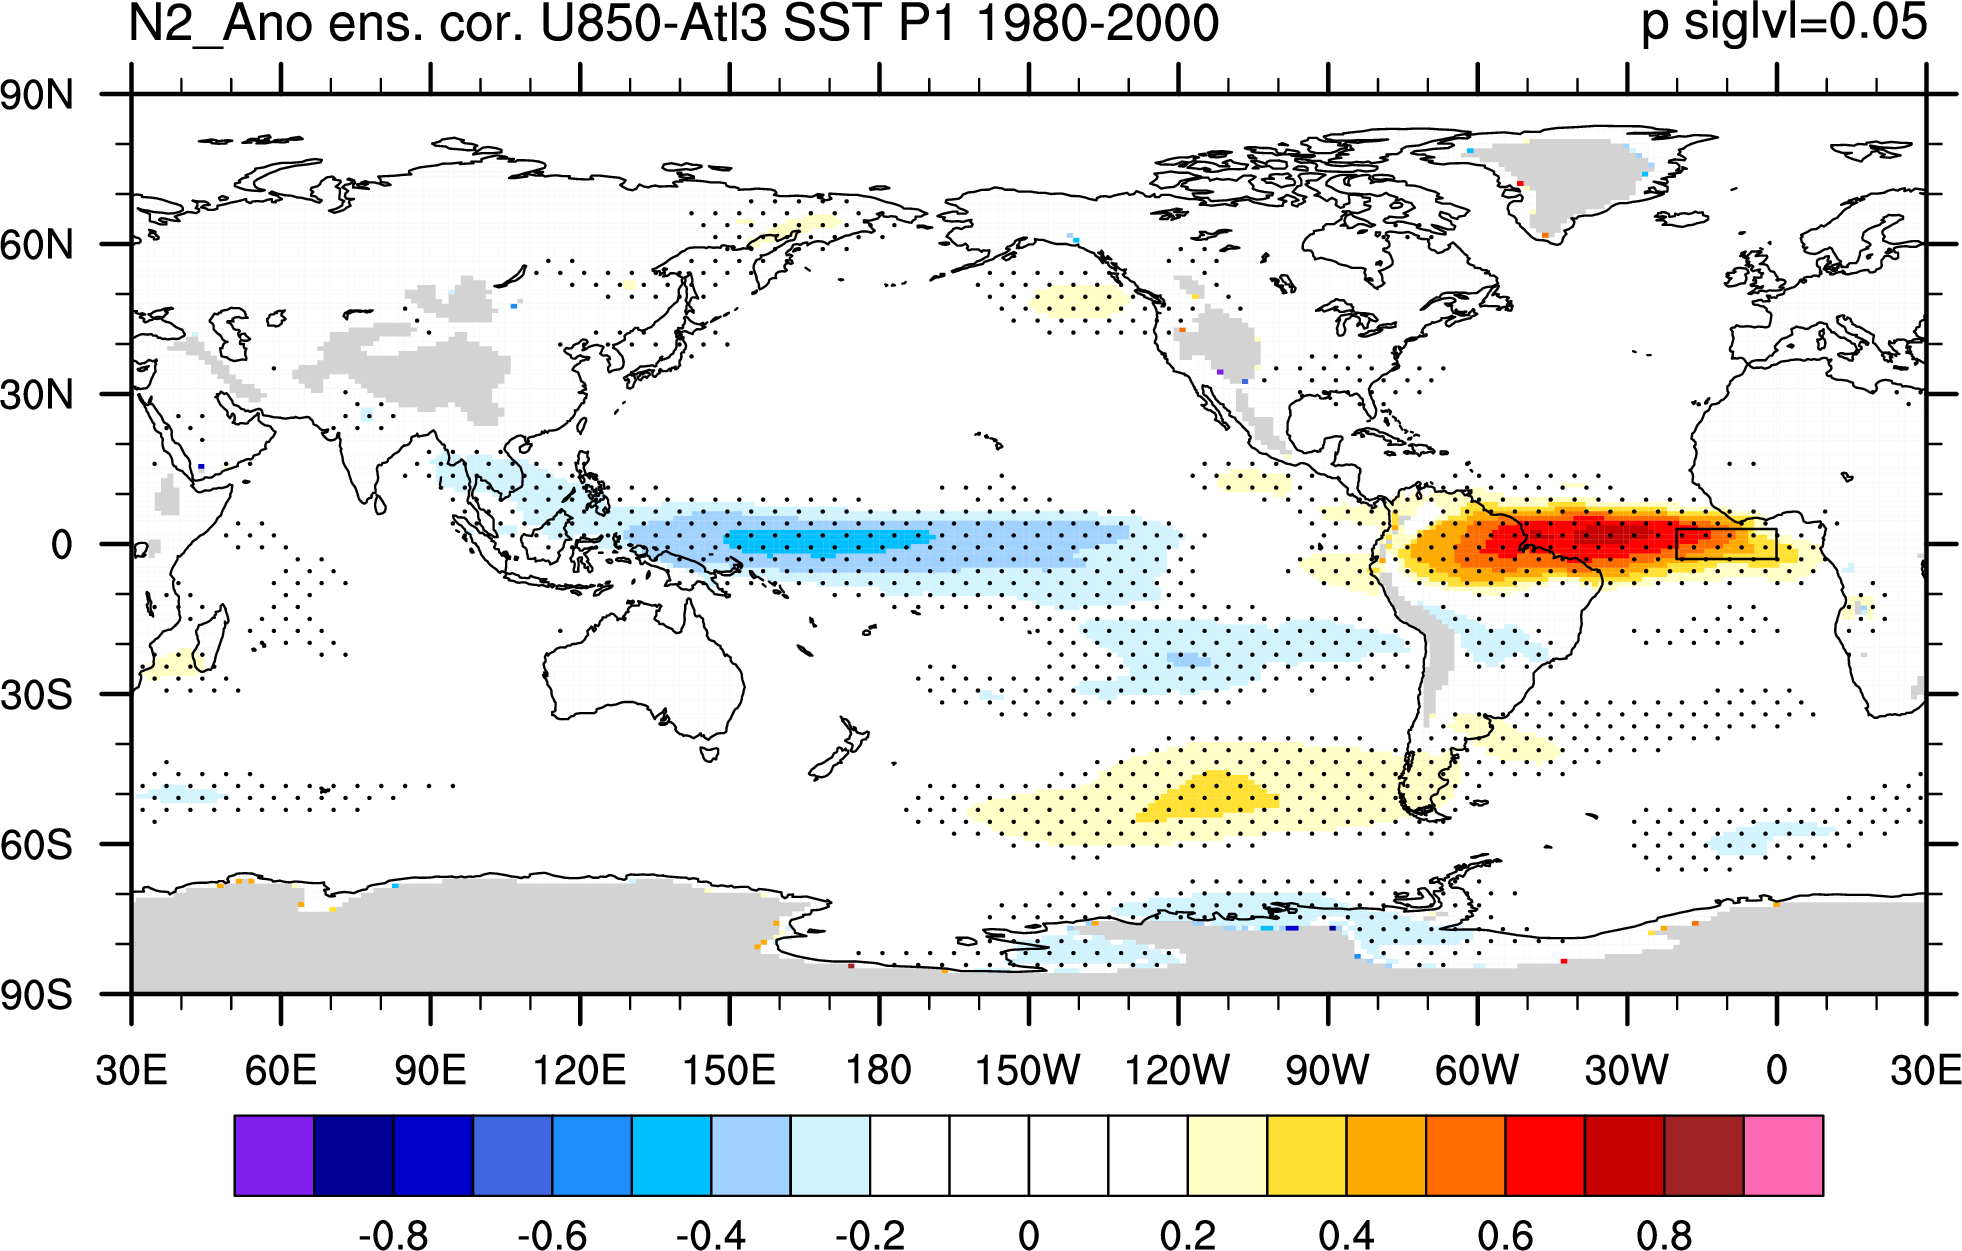
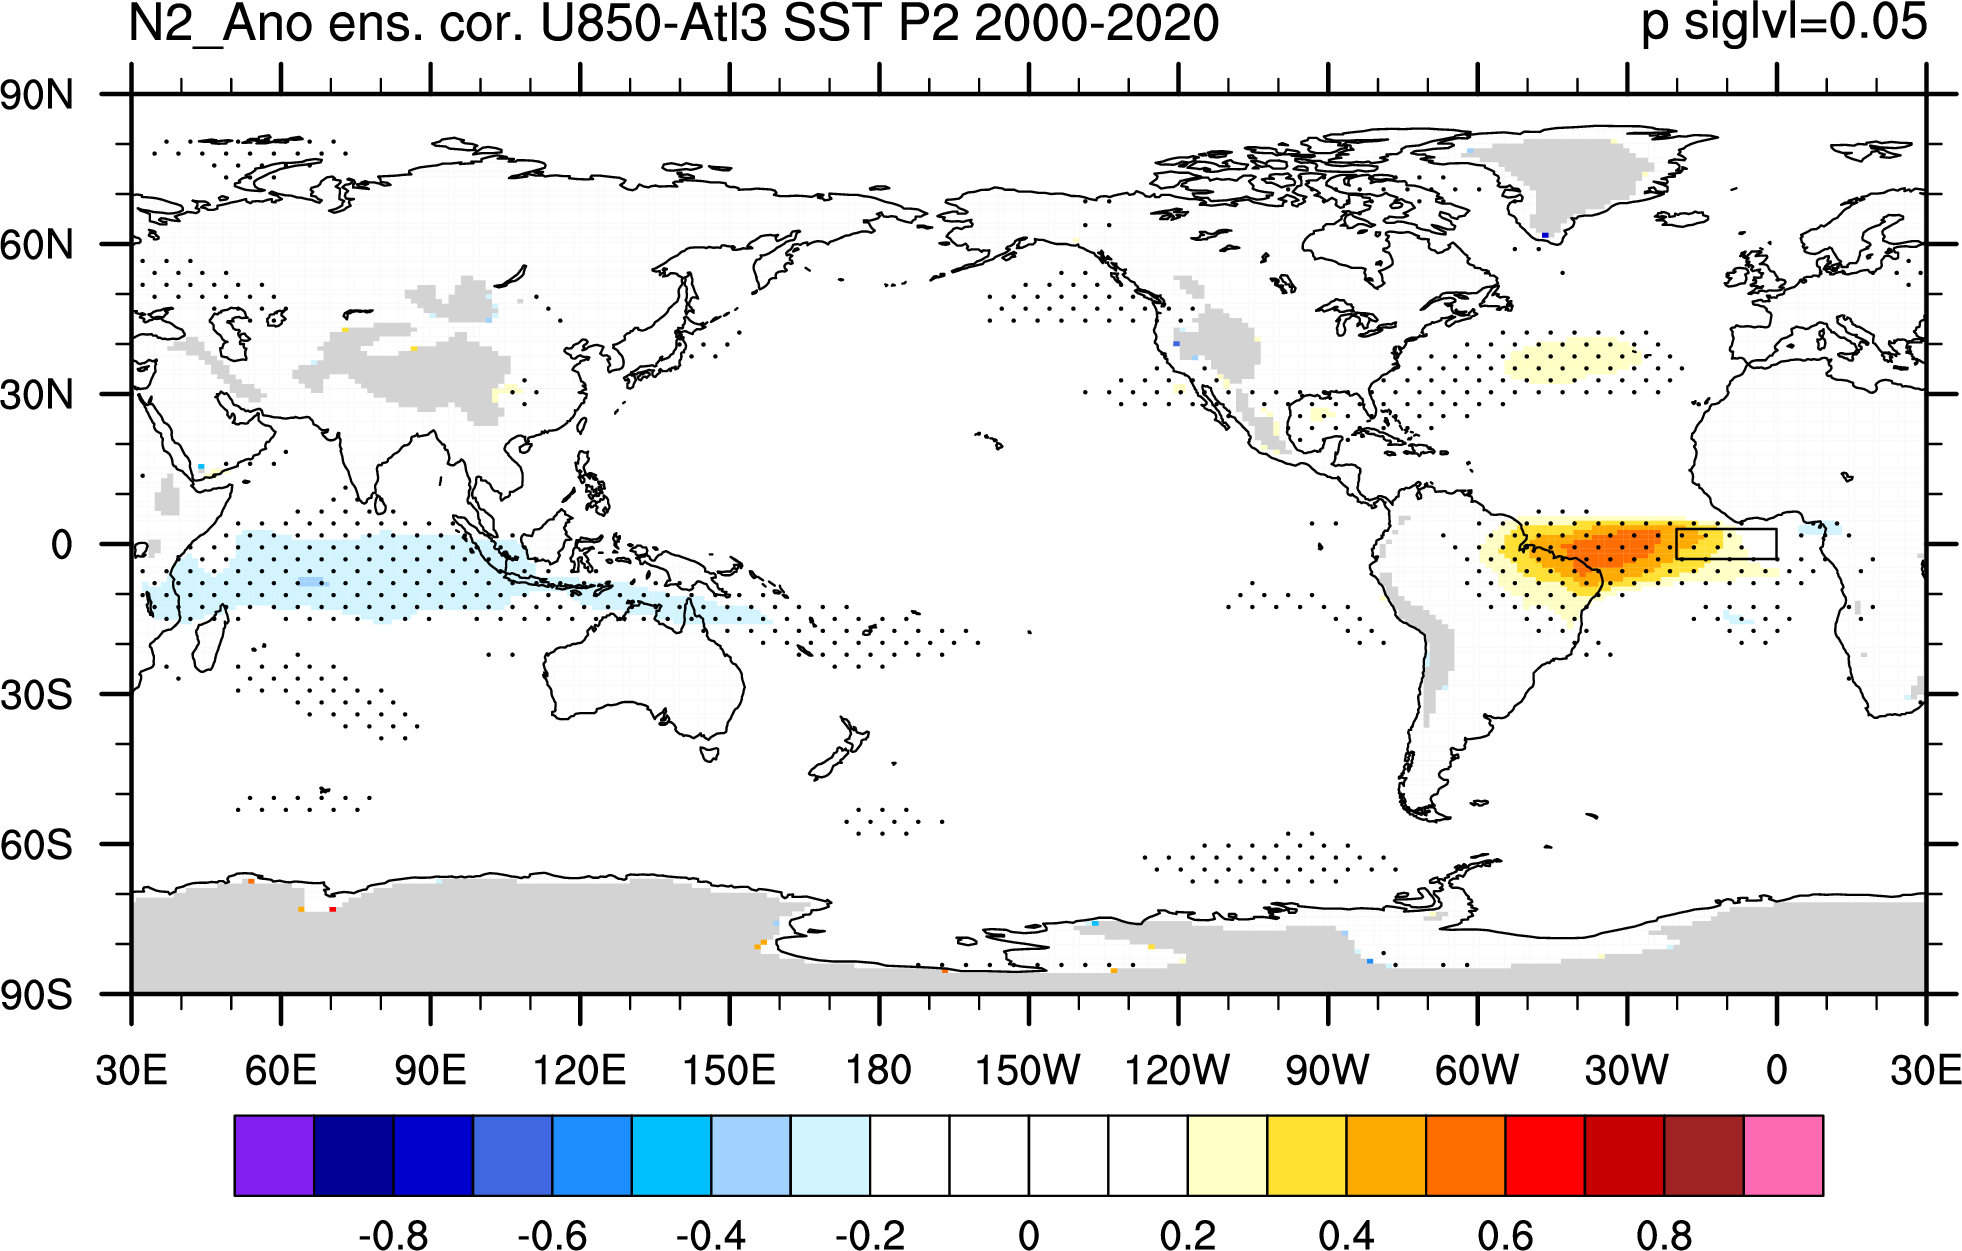
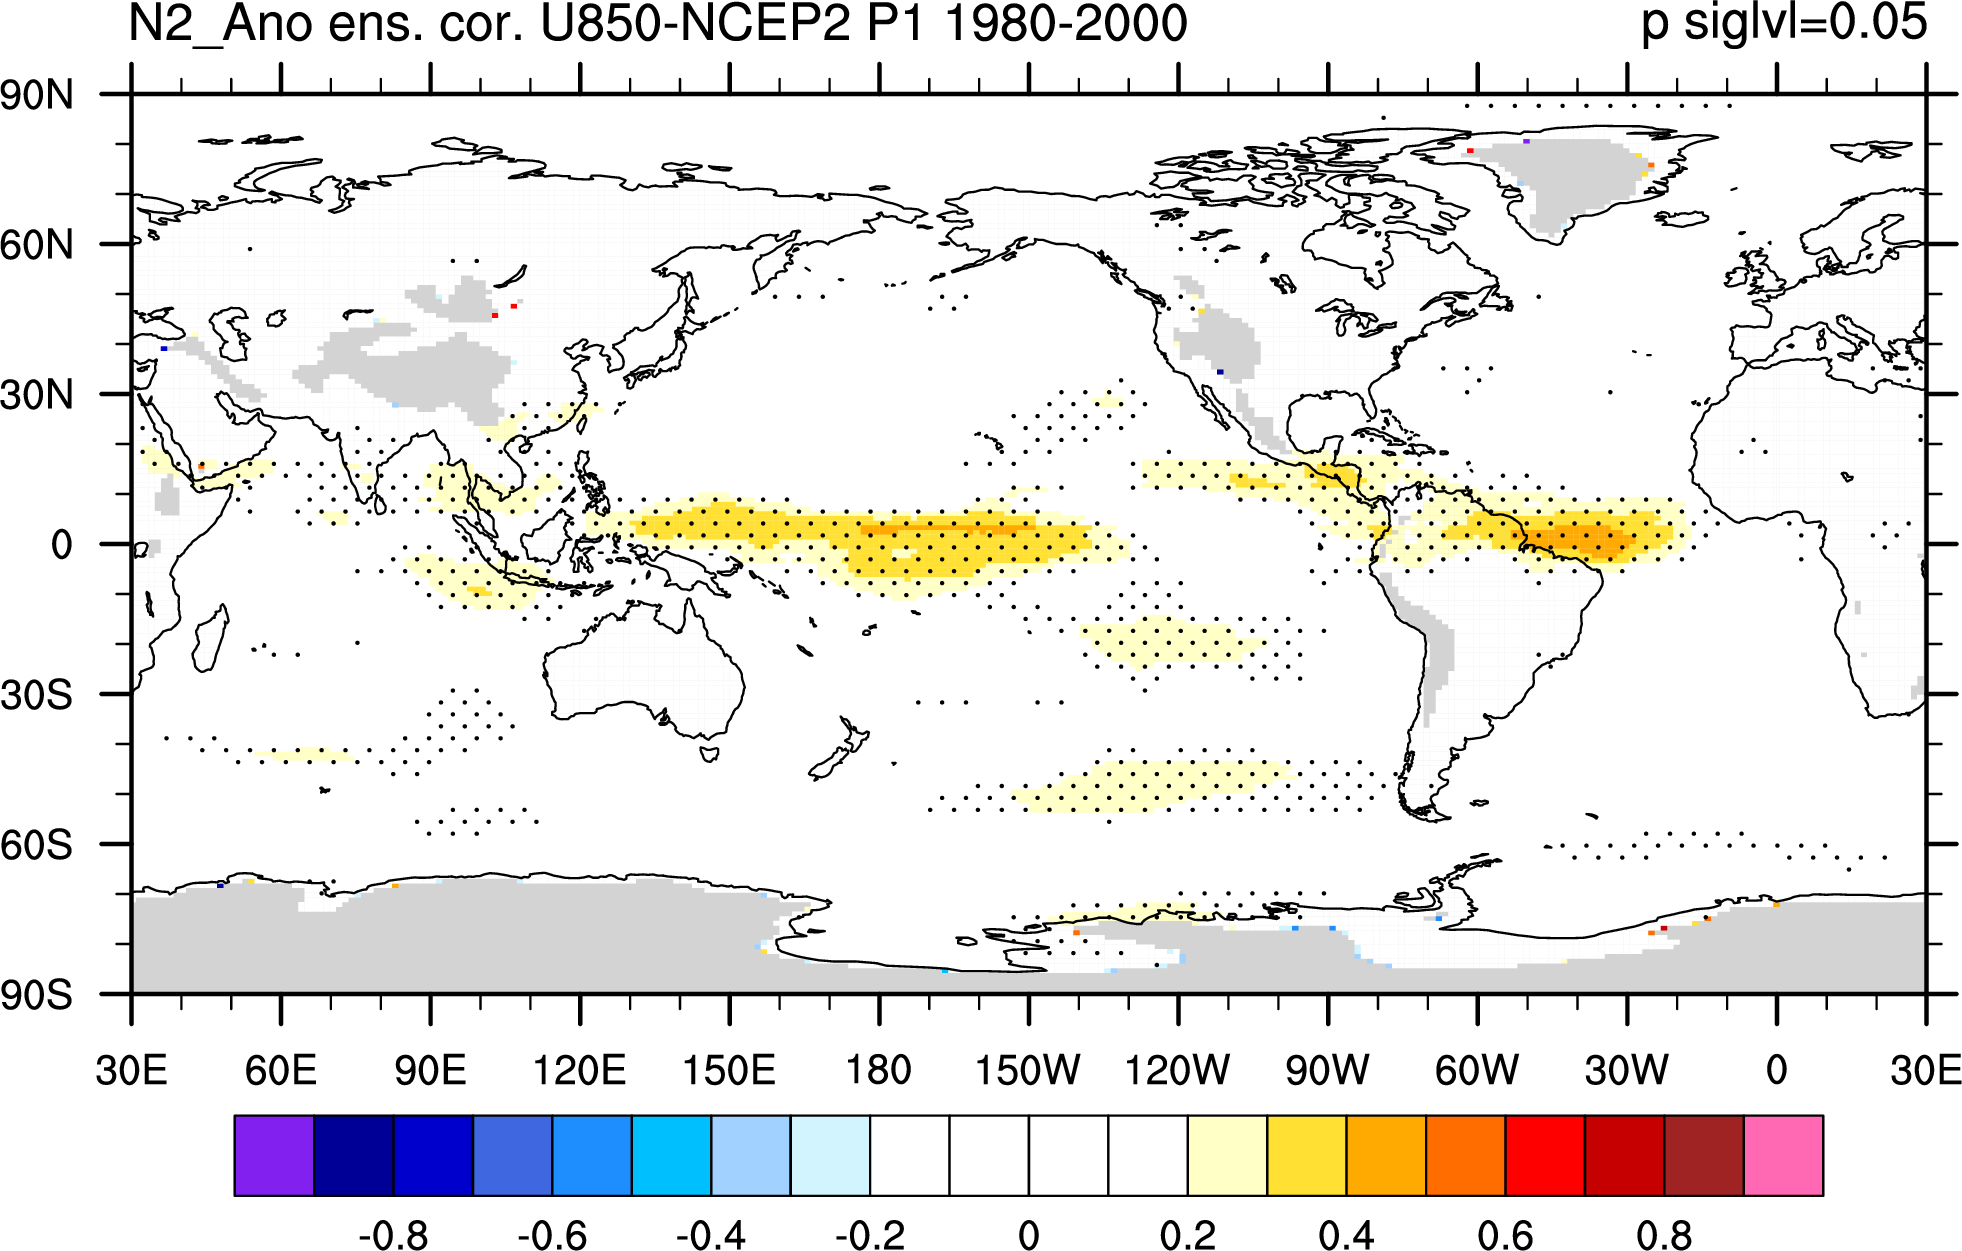
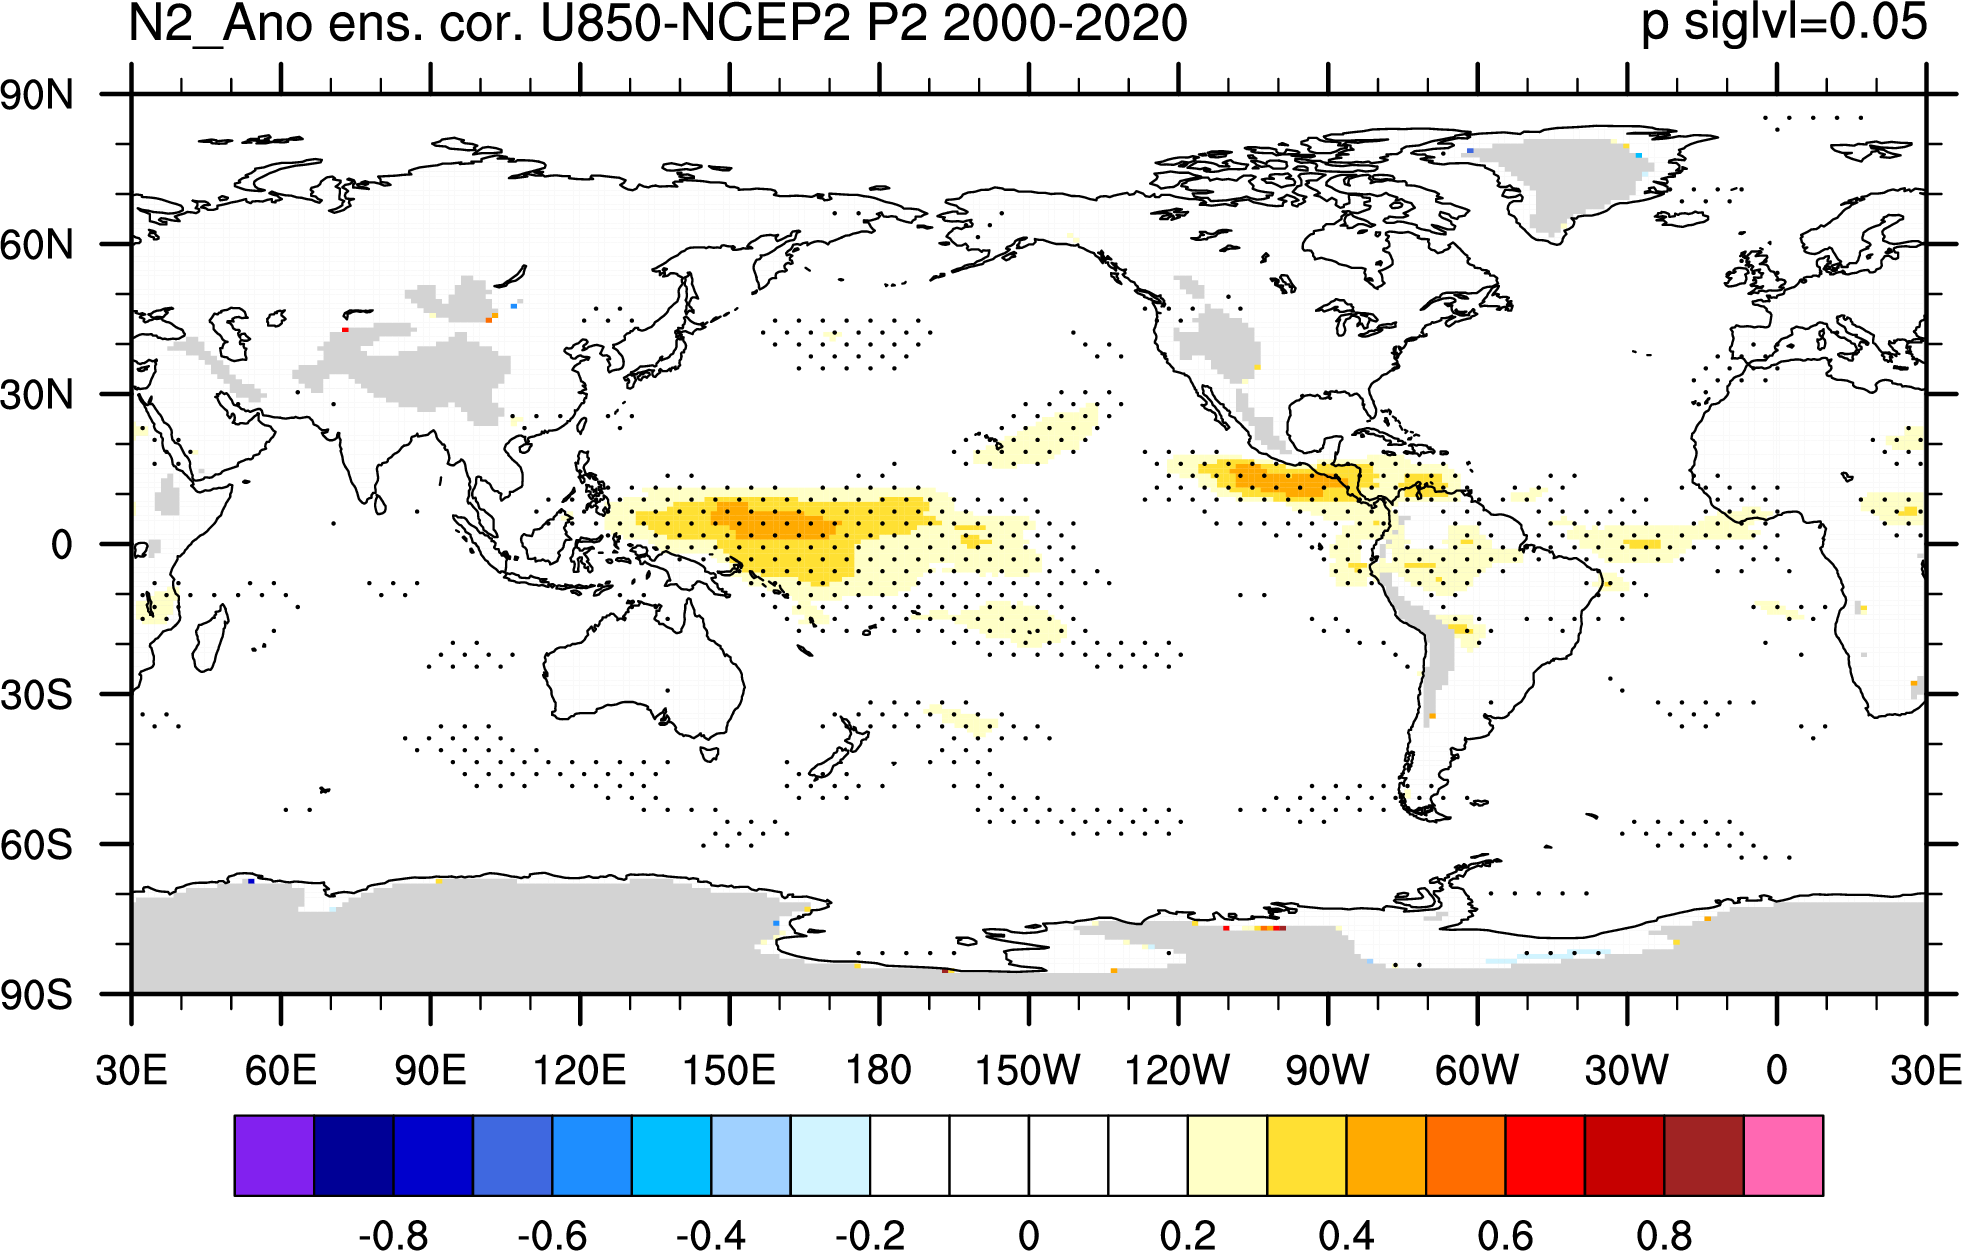
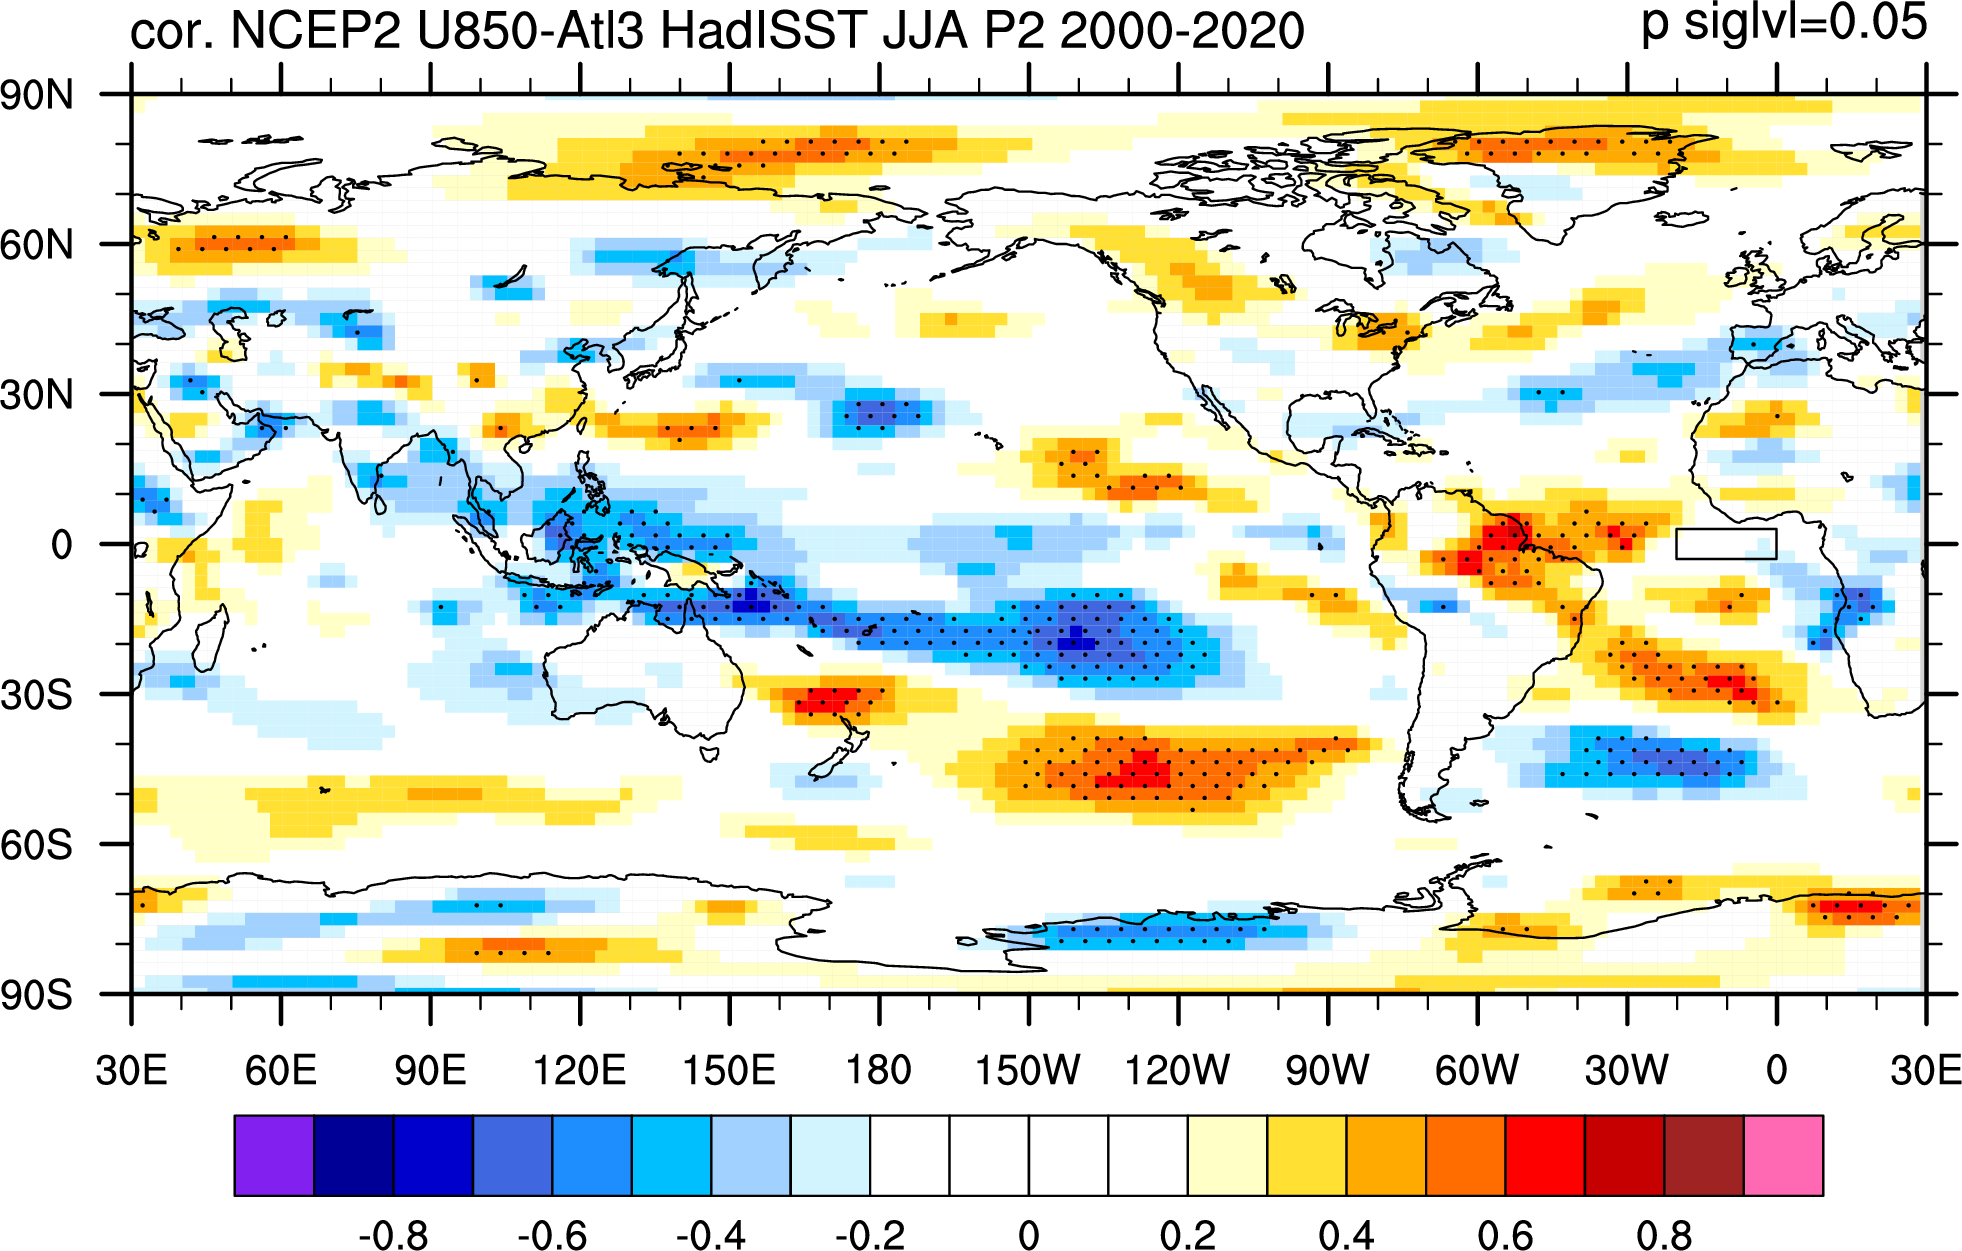
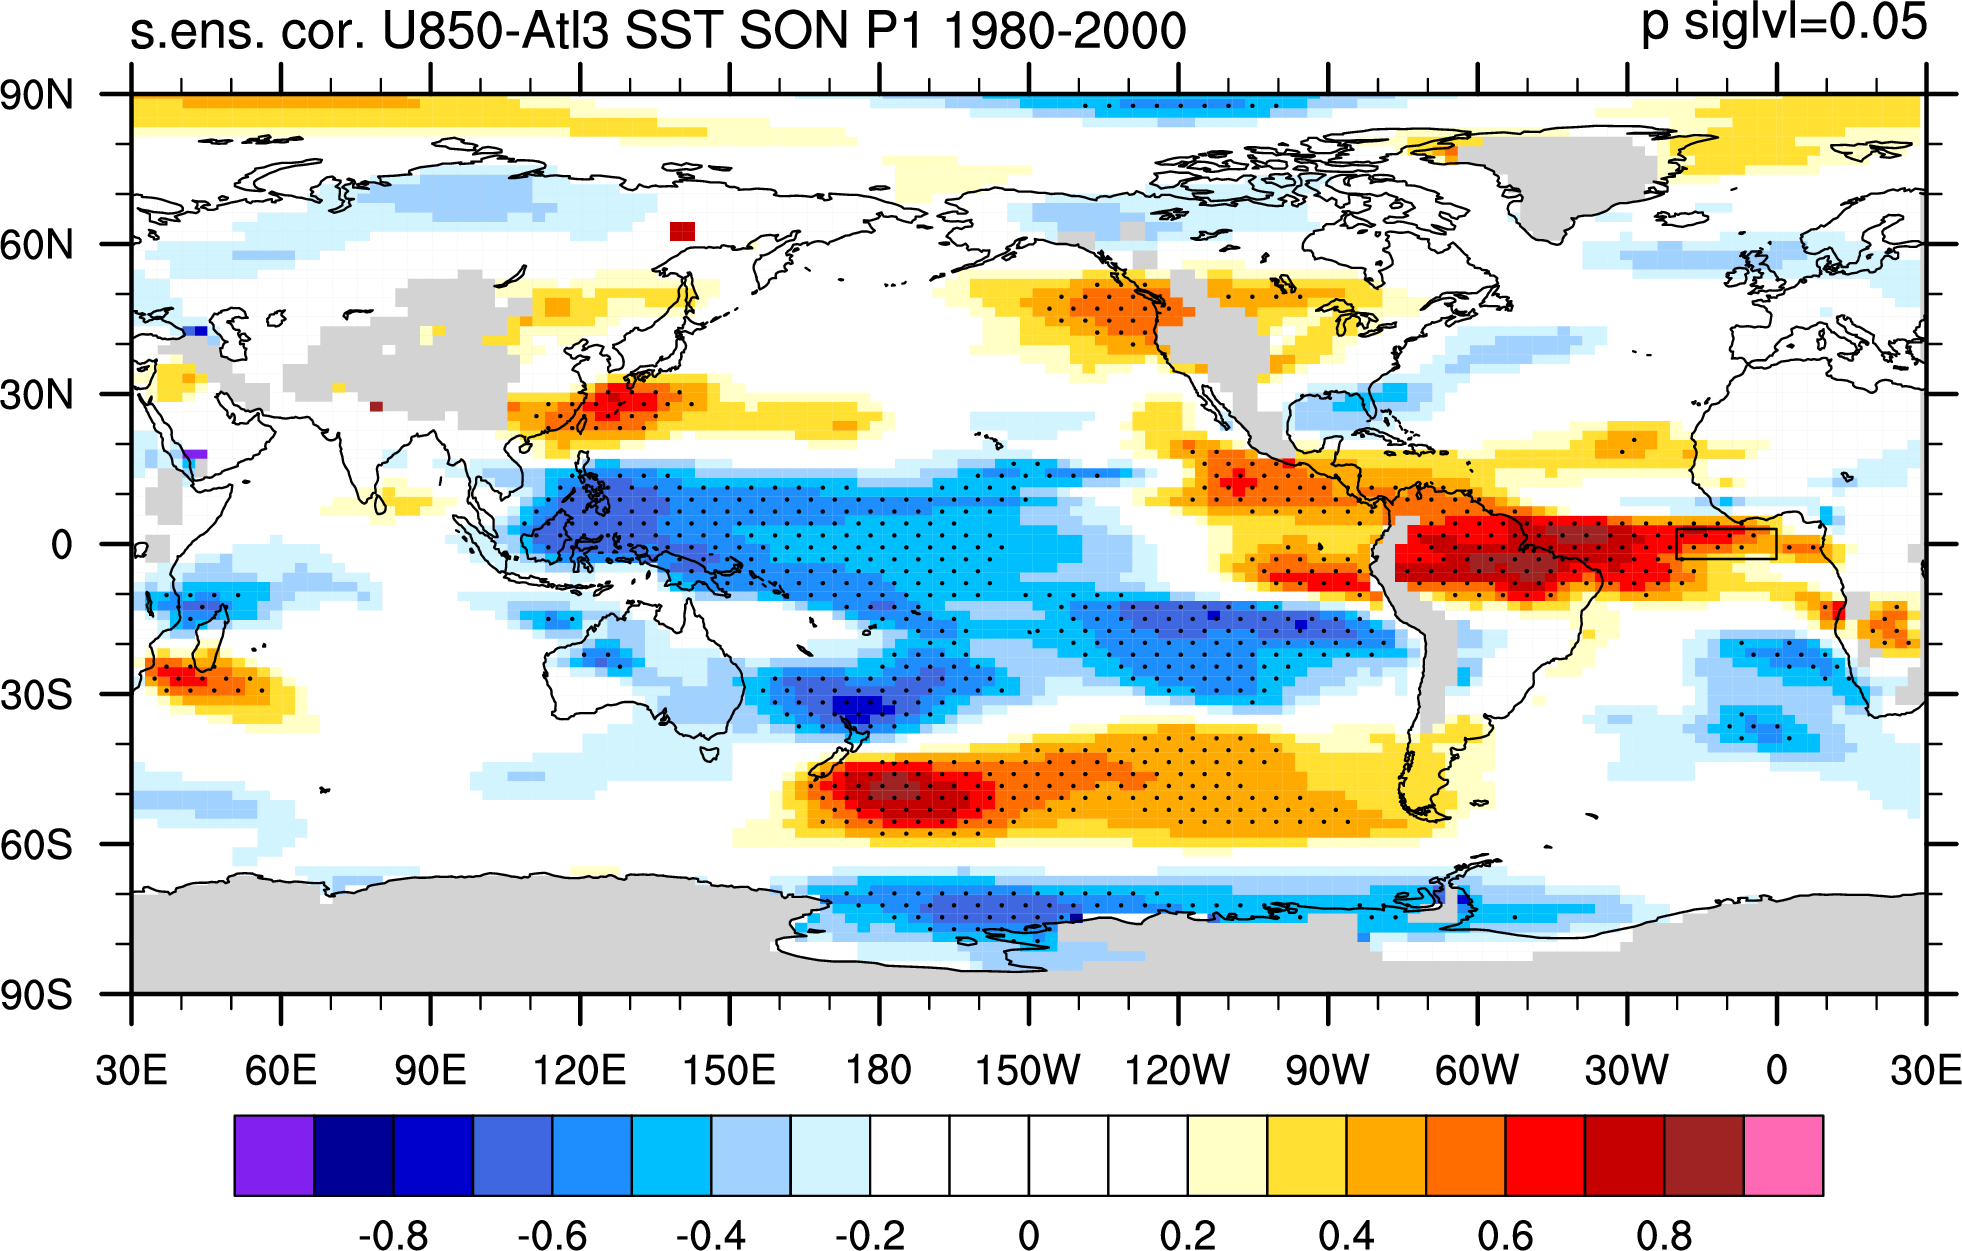
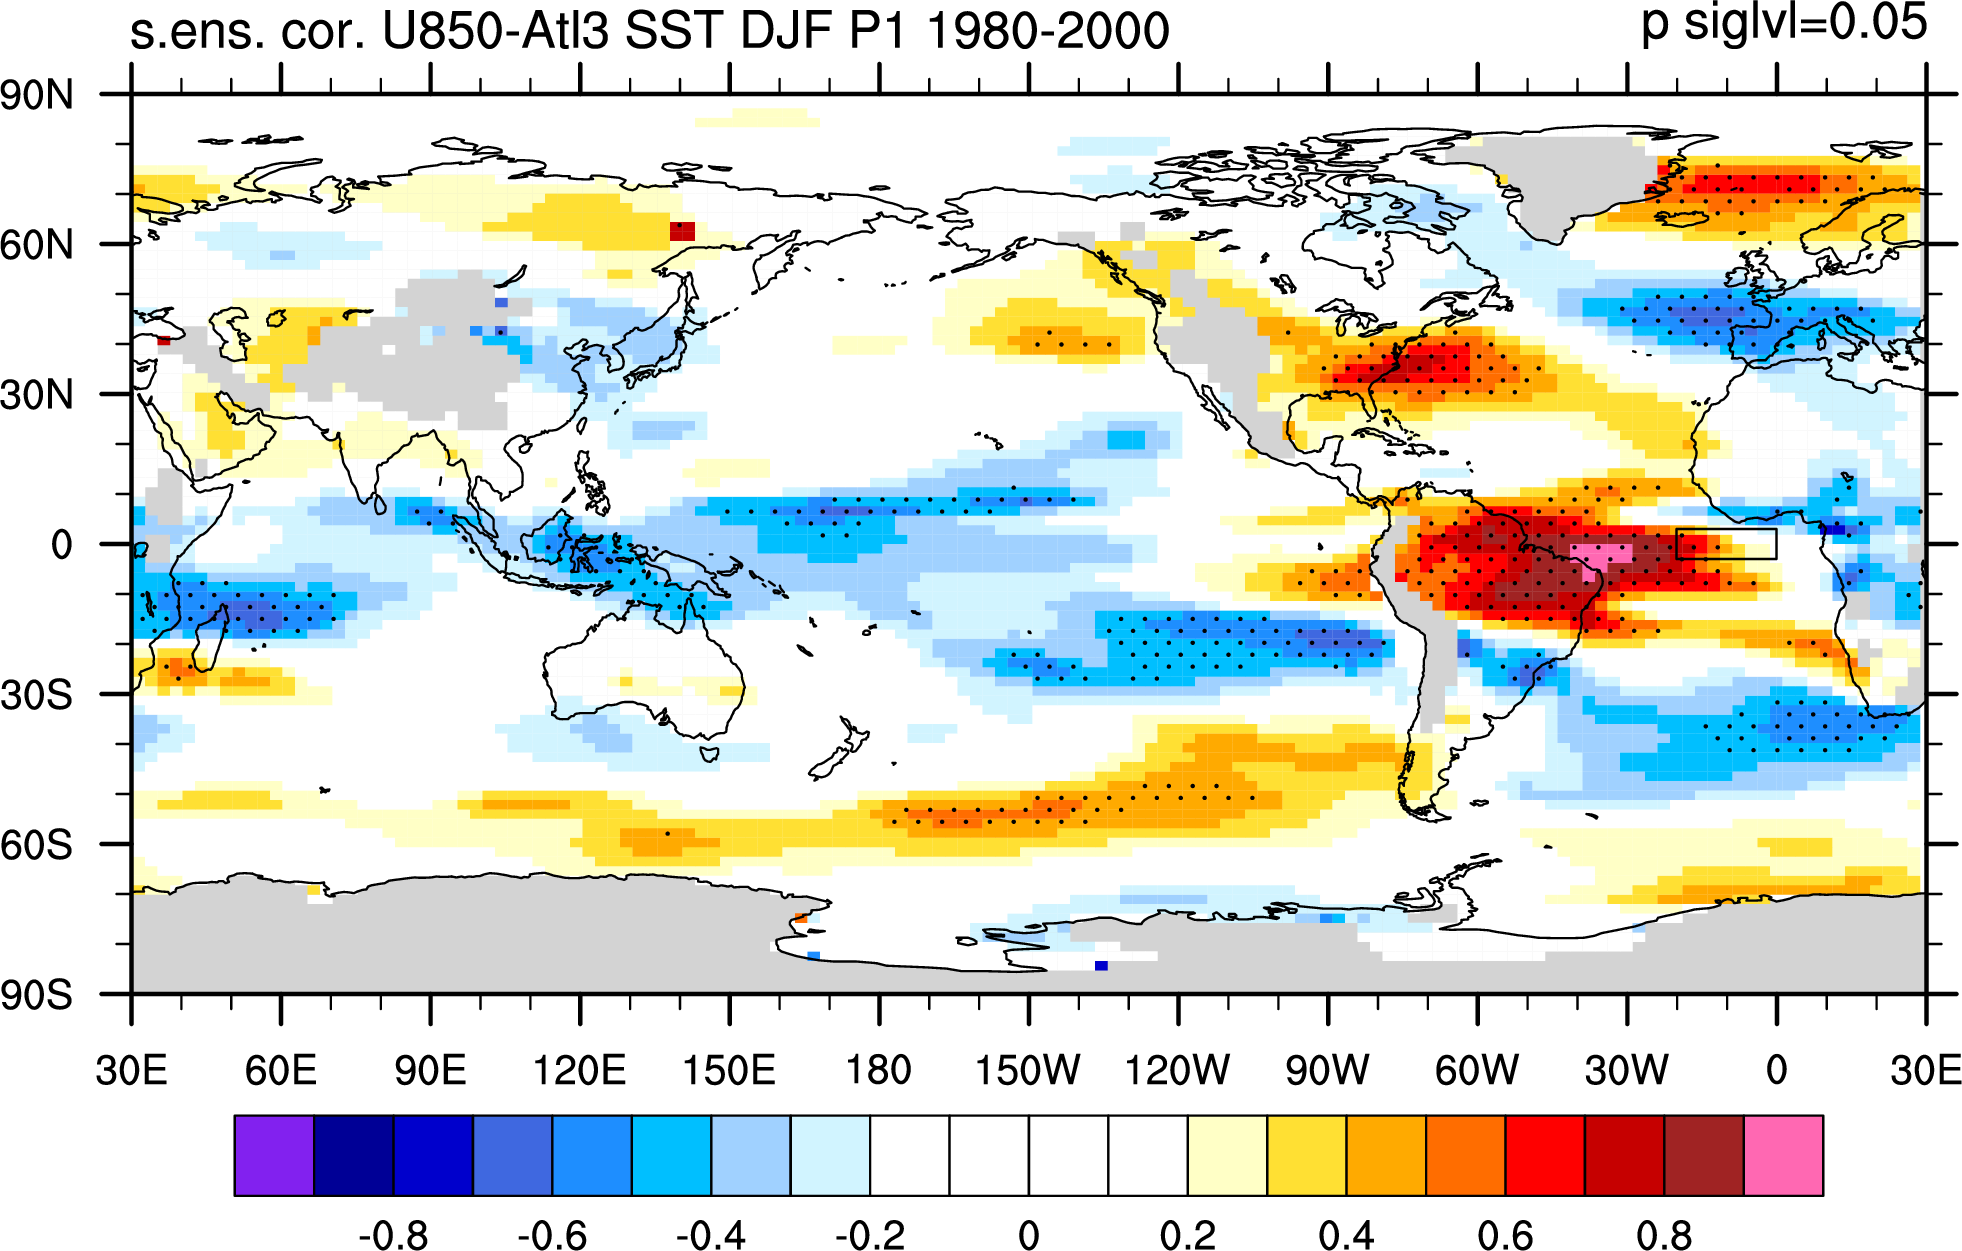
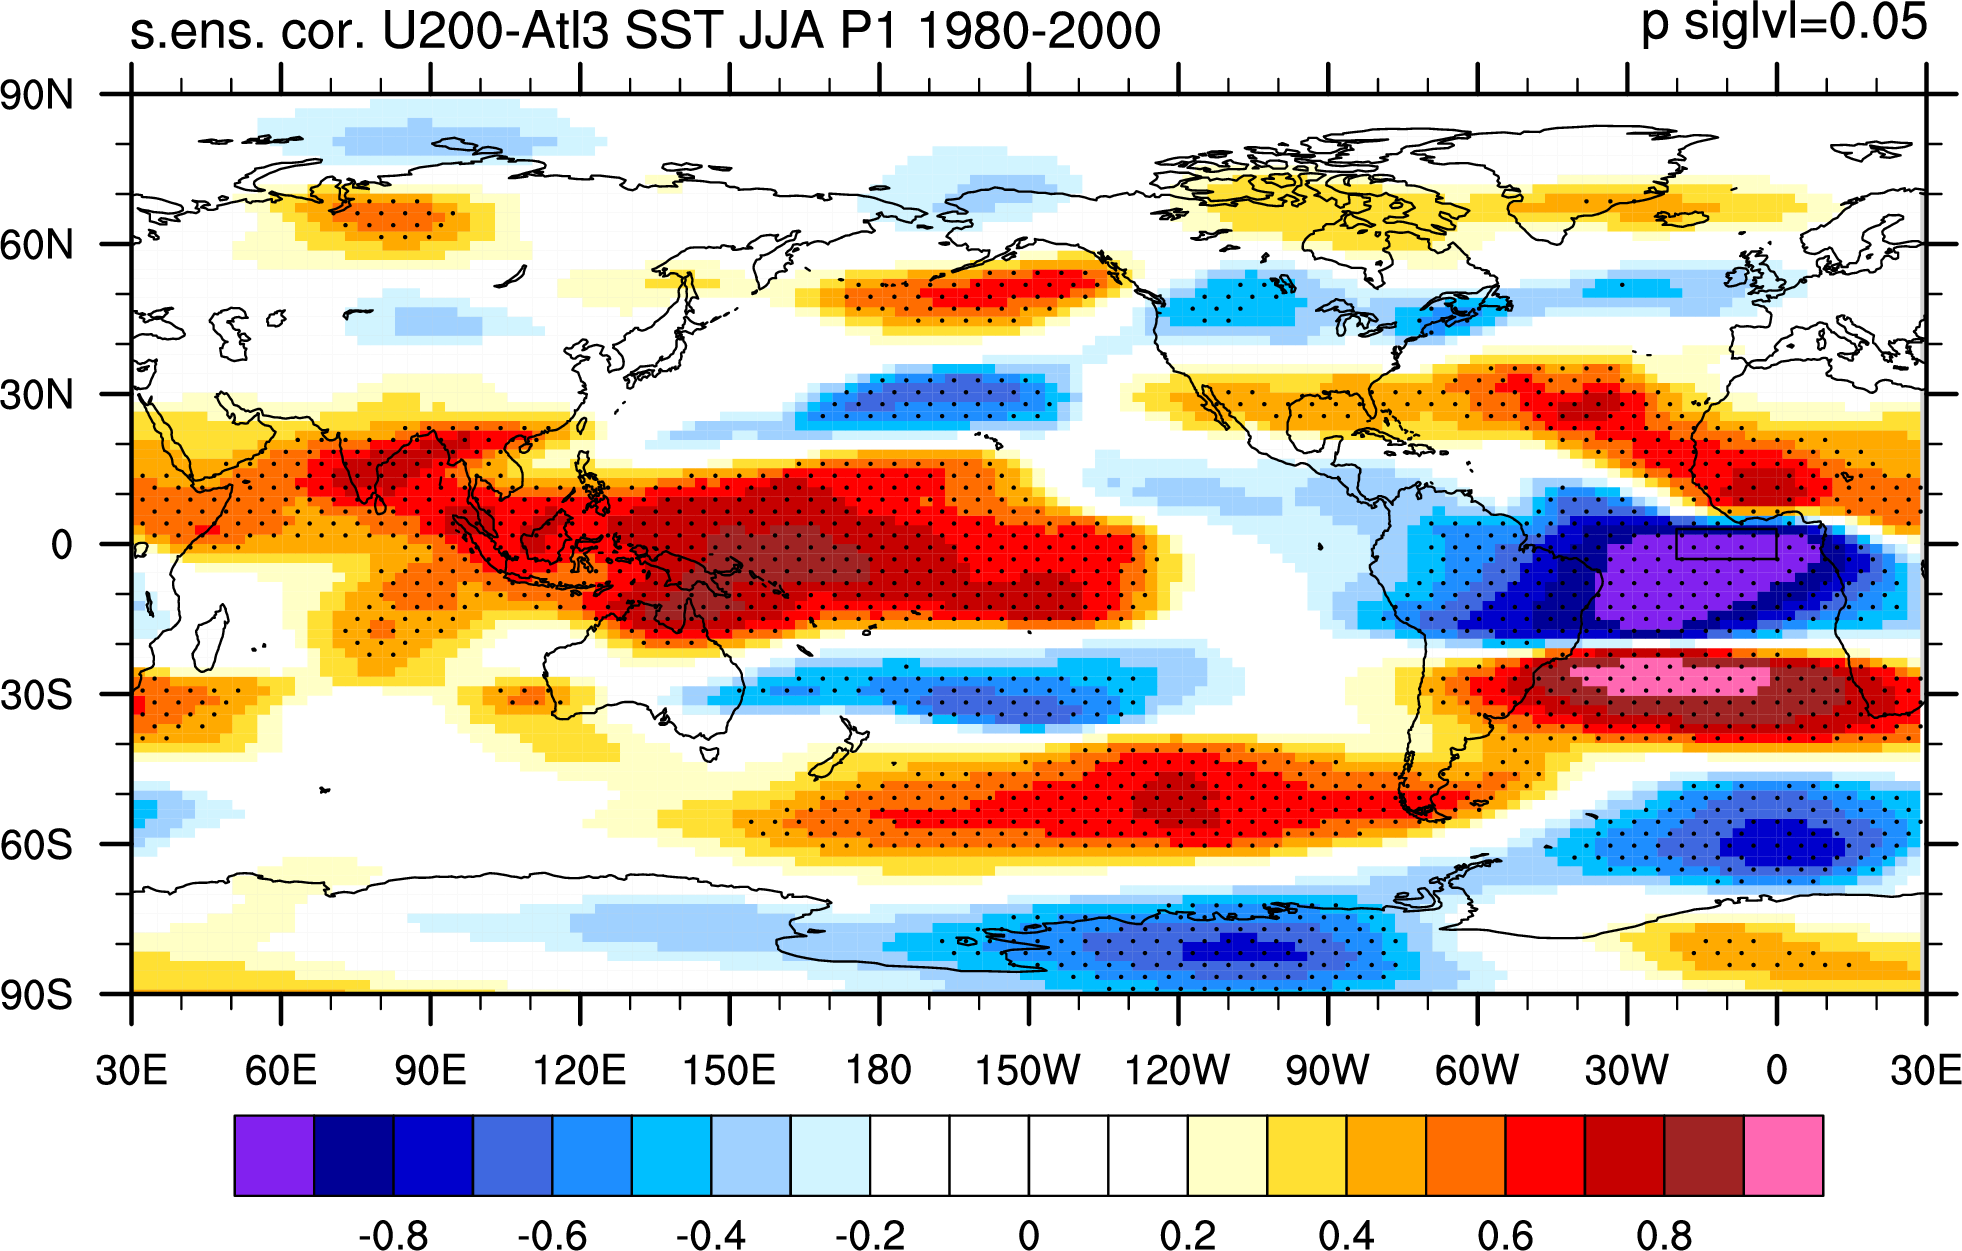
For Atl3 SST to 850hPa zonal wind of 1980-2000(left) and 2000-2020(right) Super ensemble mean shows stong correlation JJA: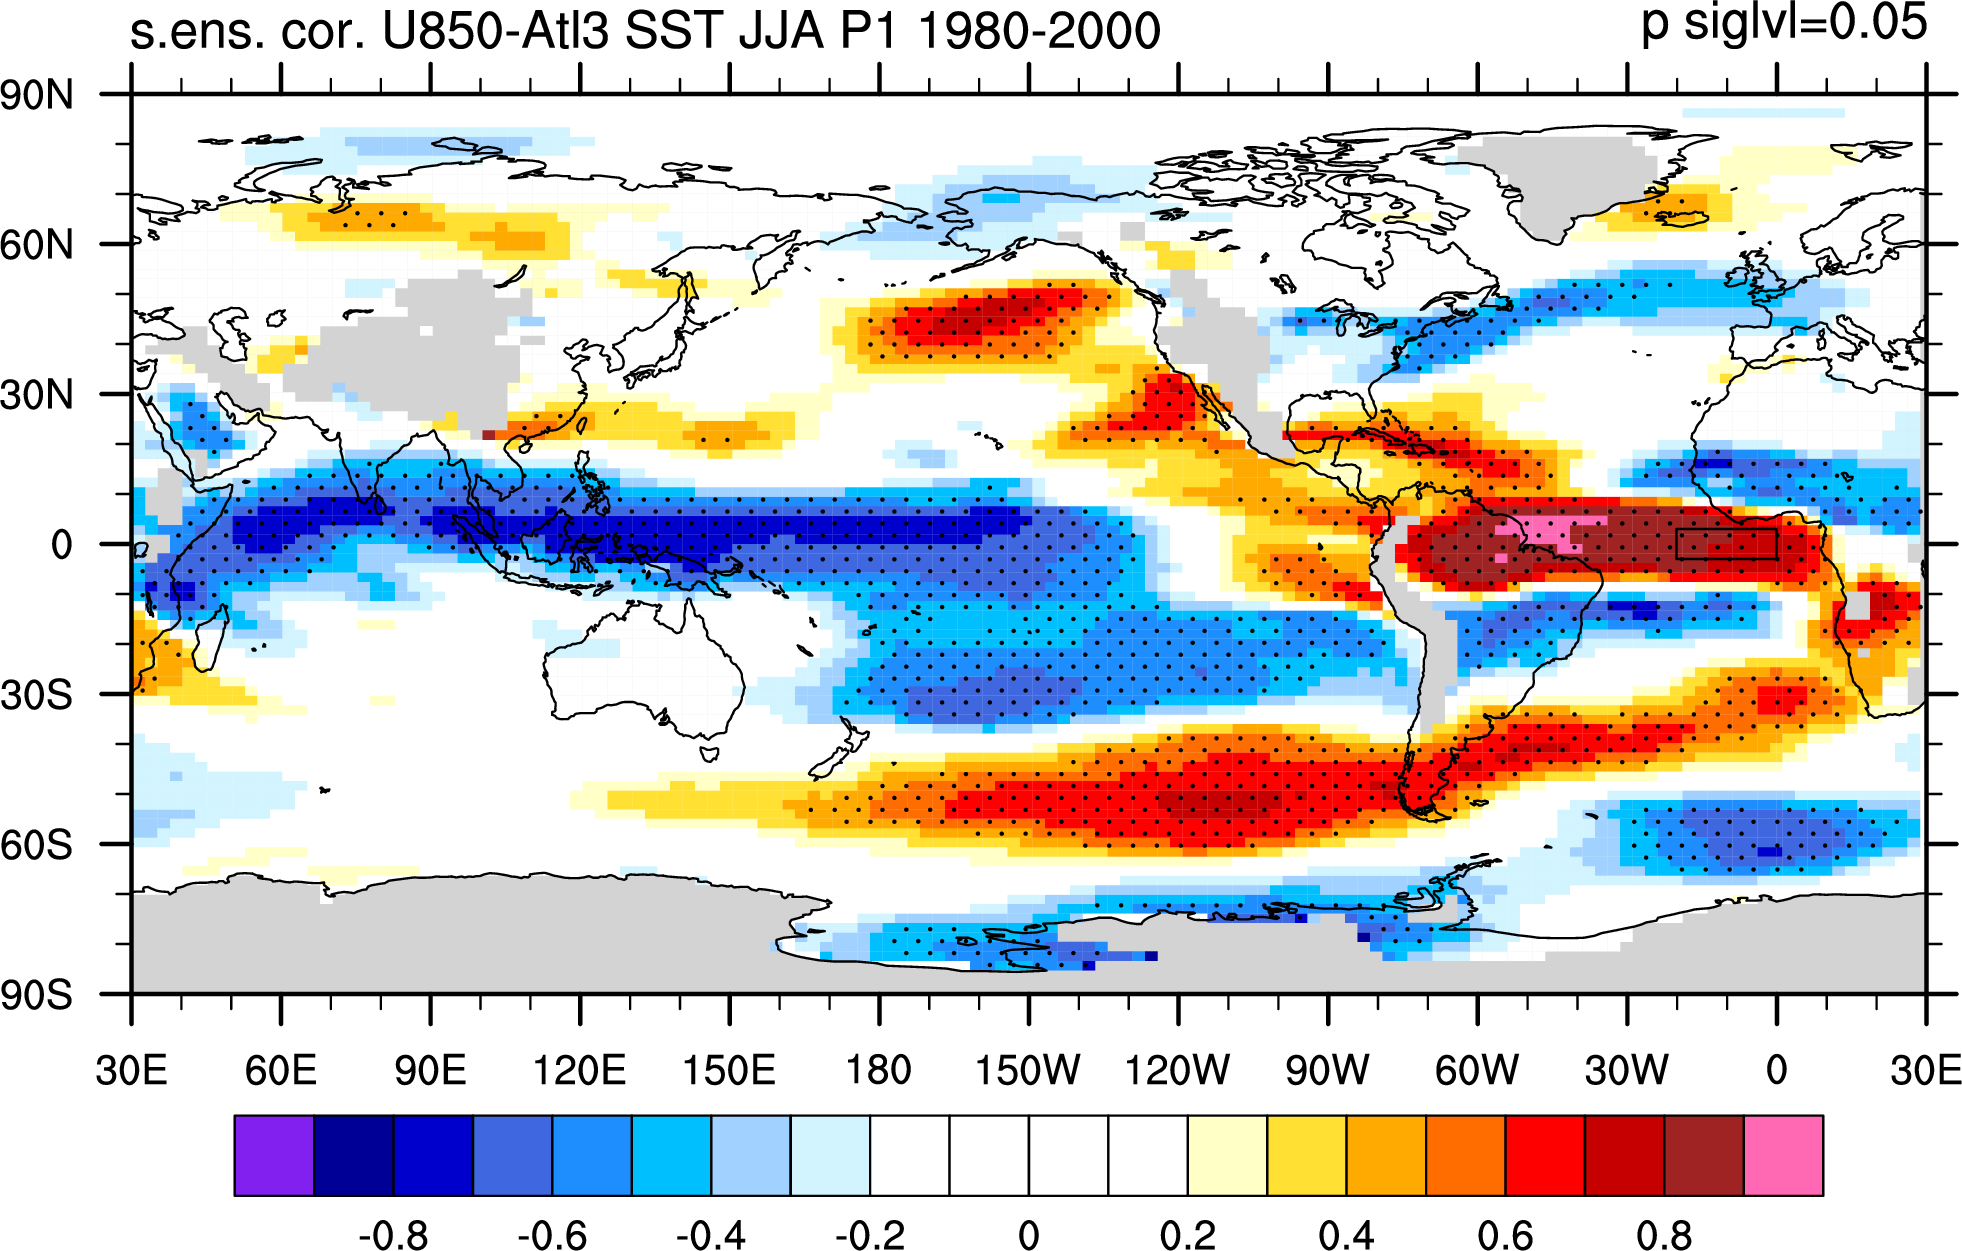
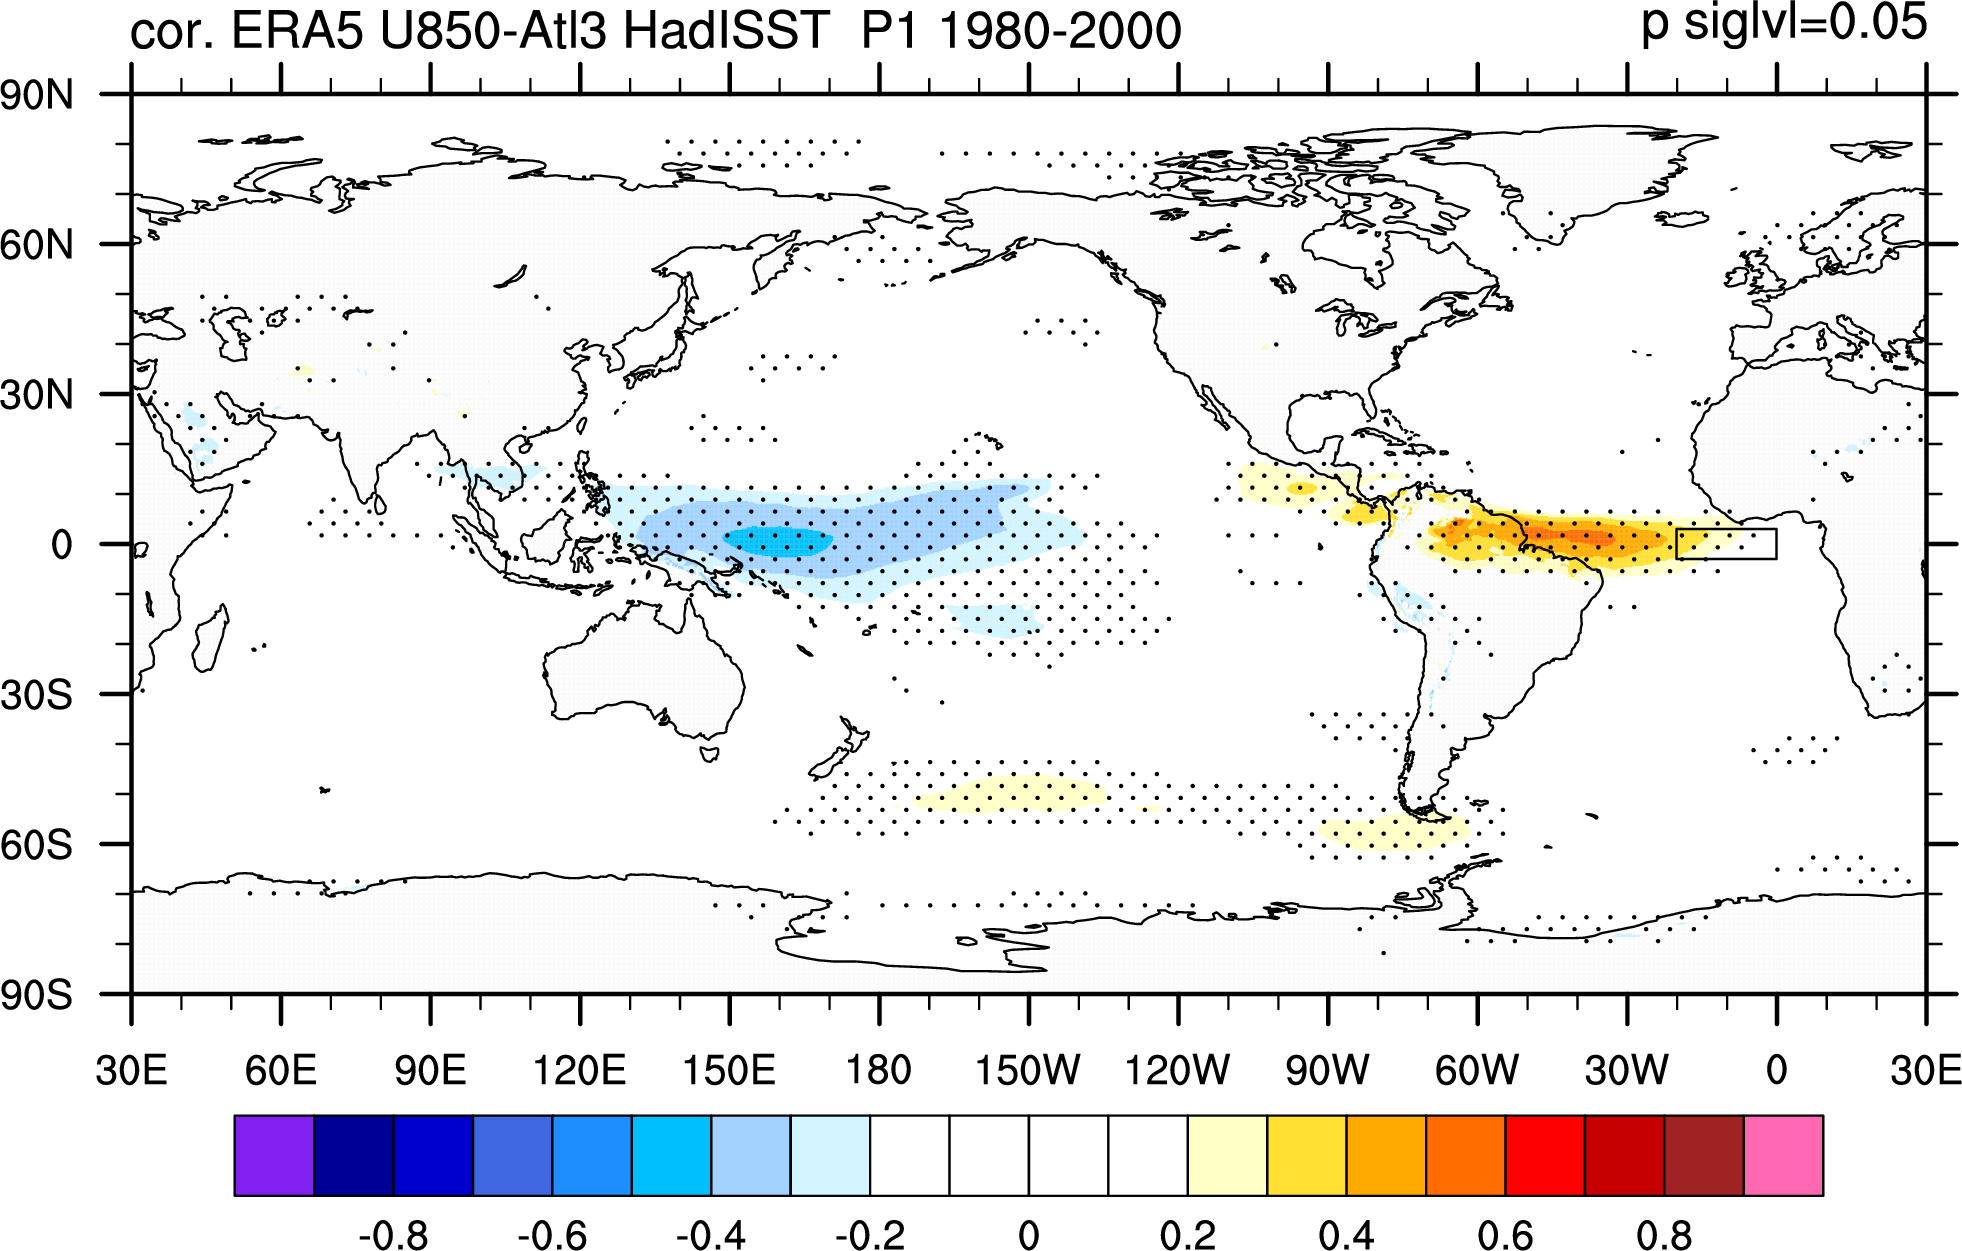
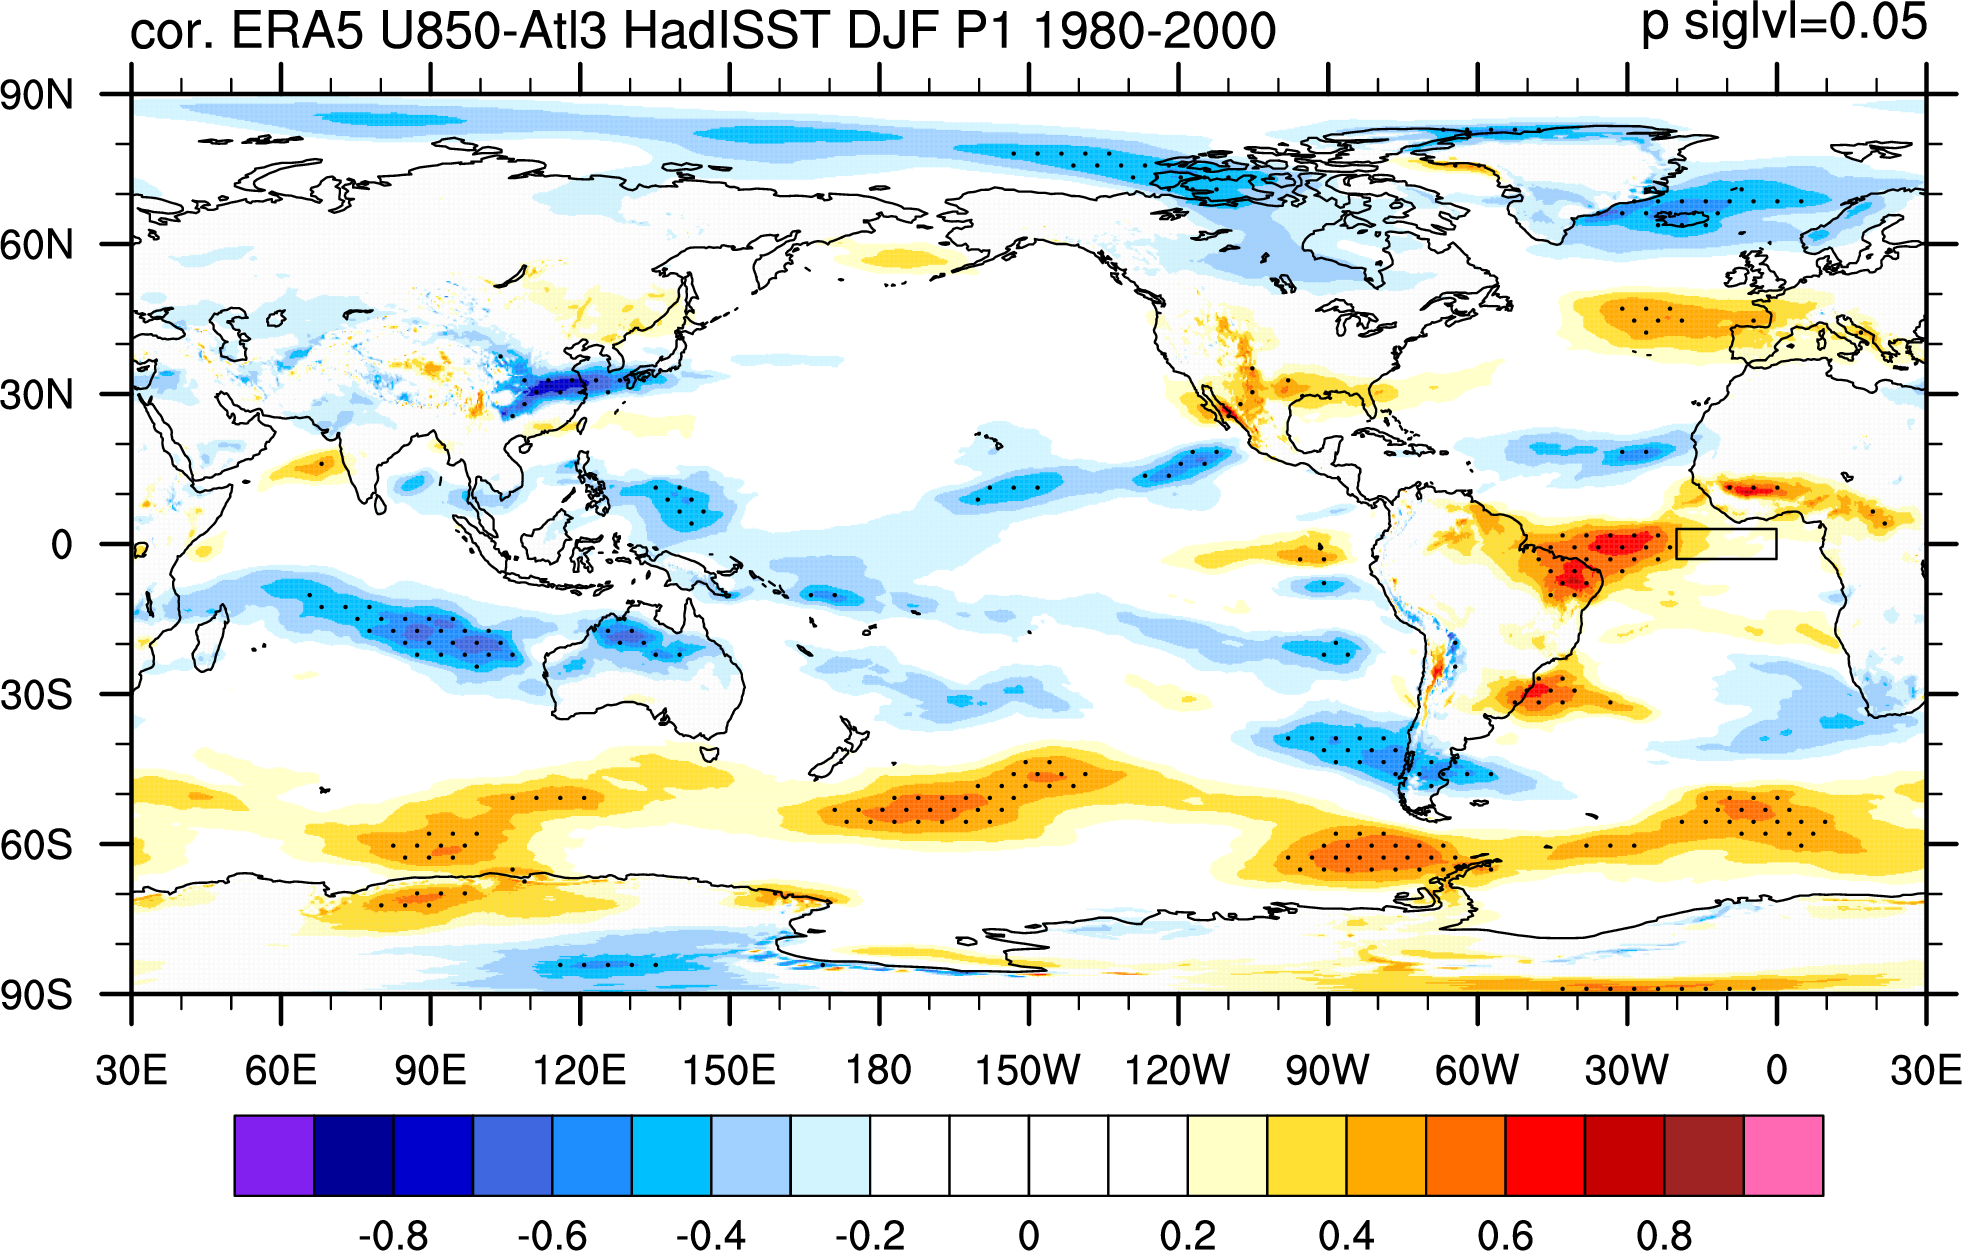
 Same correlation but in ERA5 and HadISST:
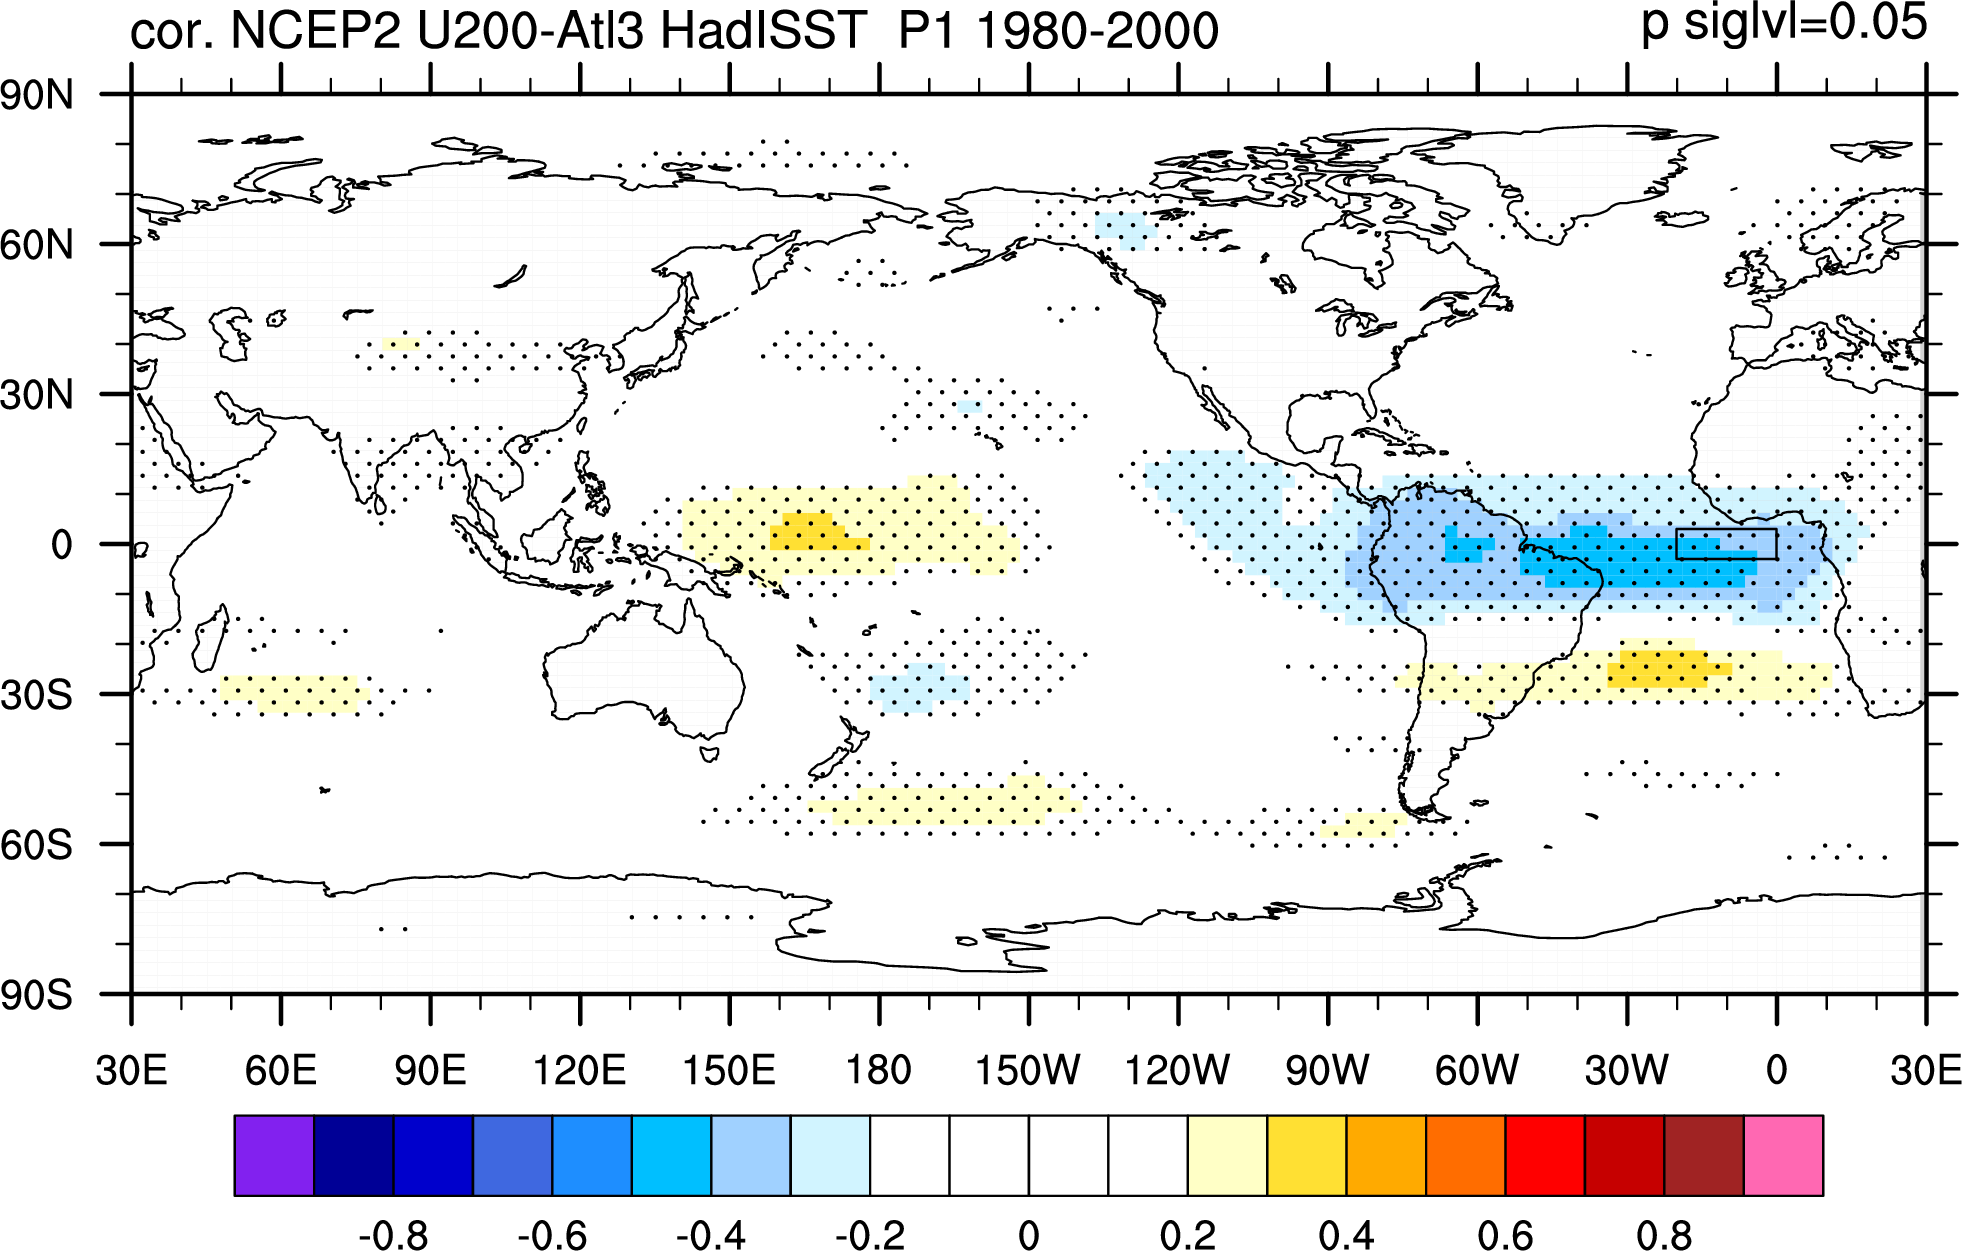
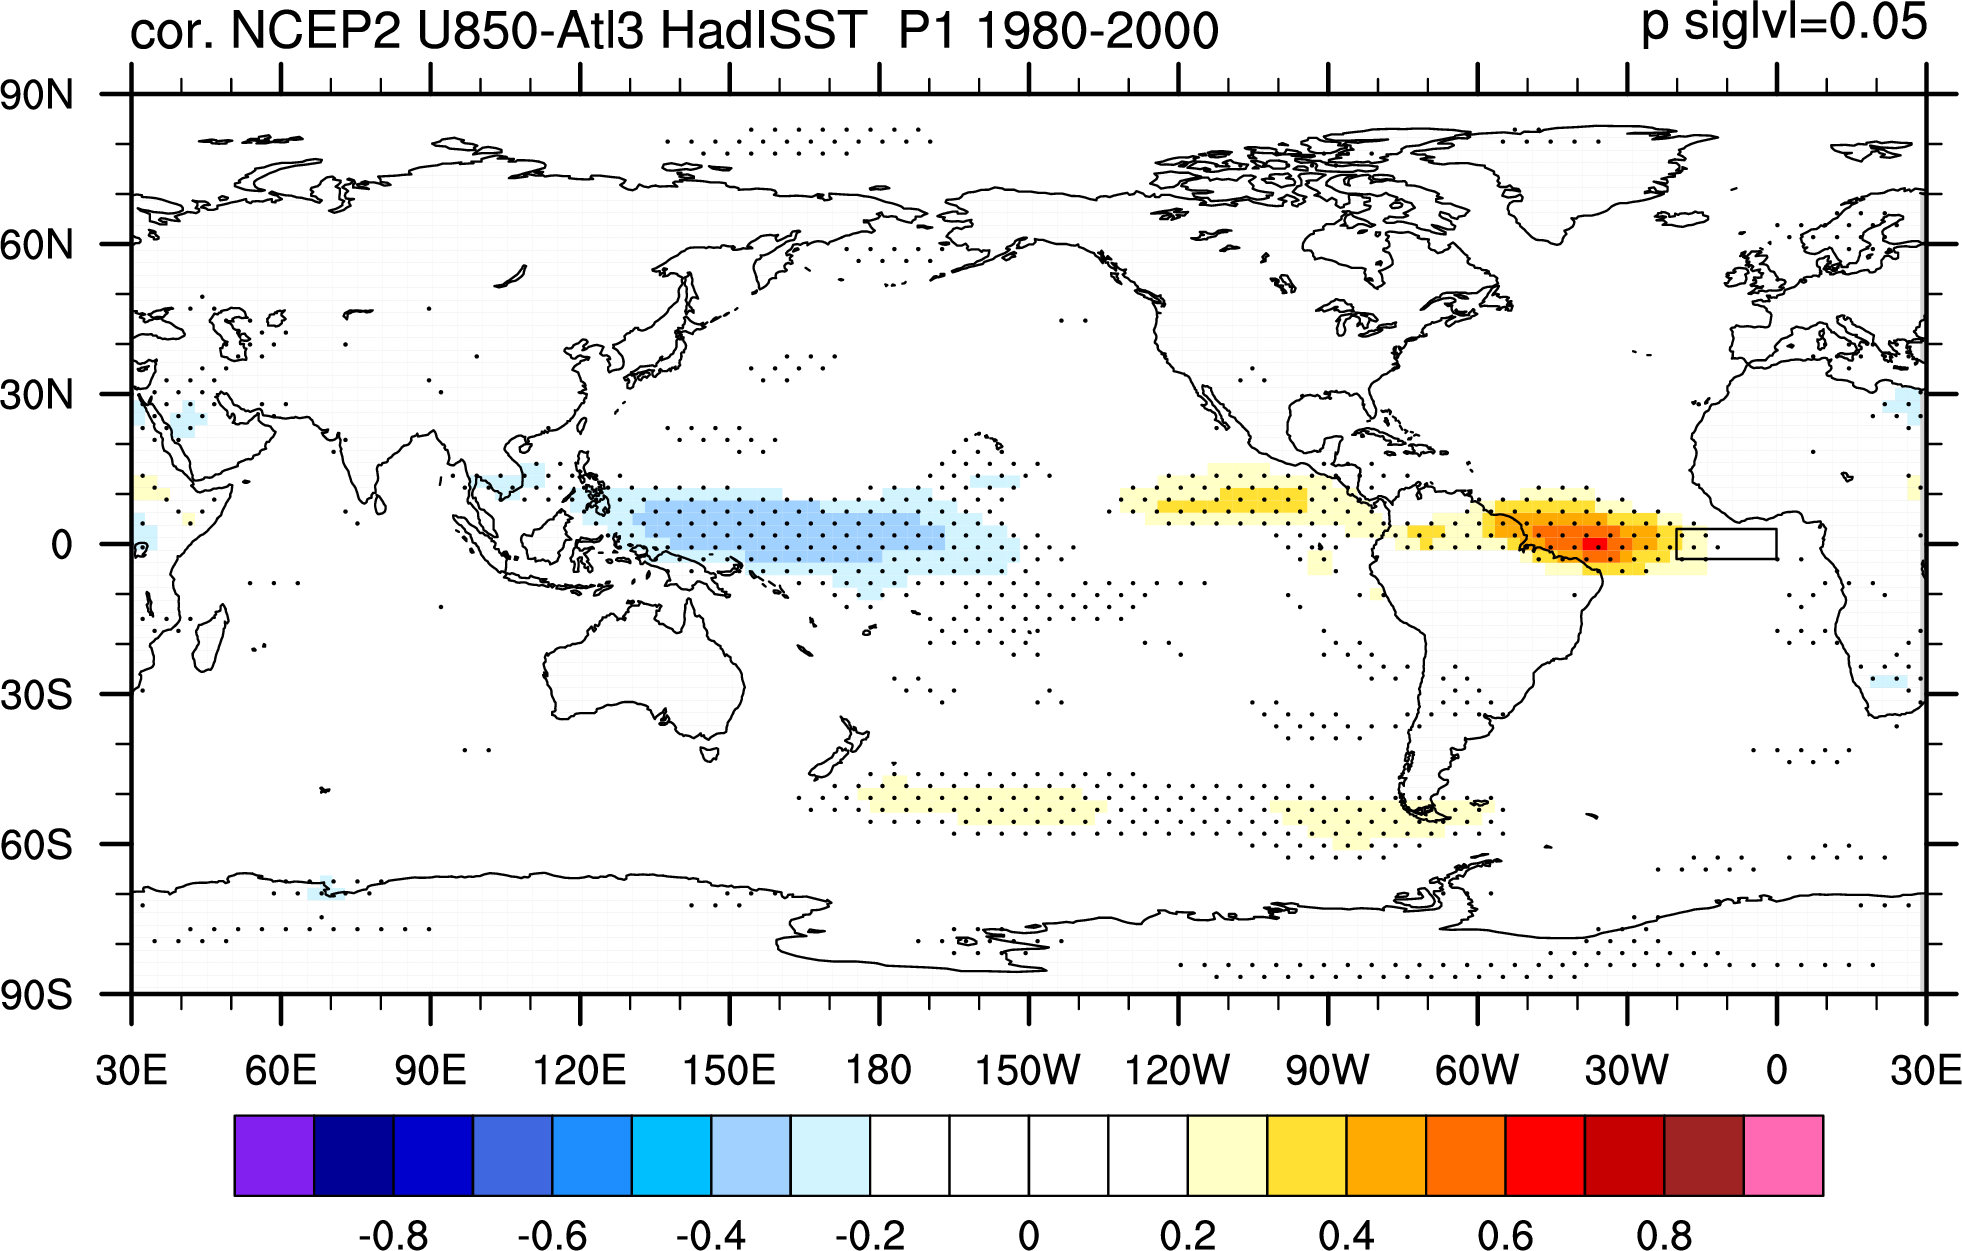
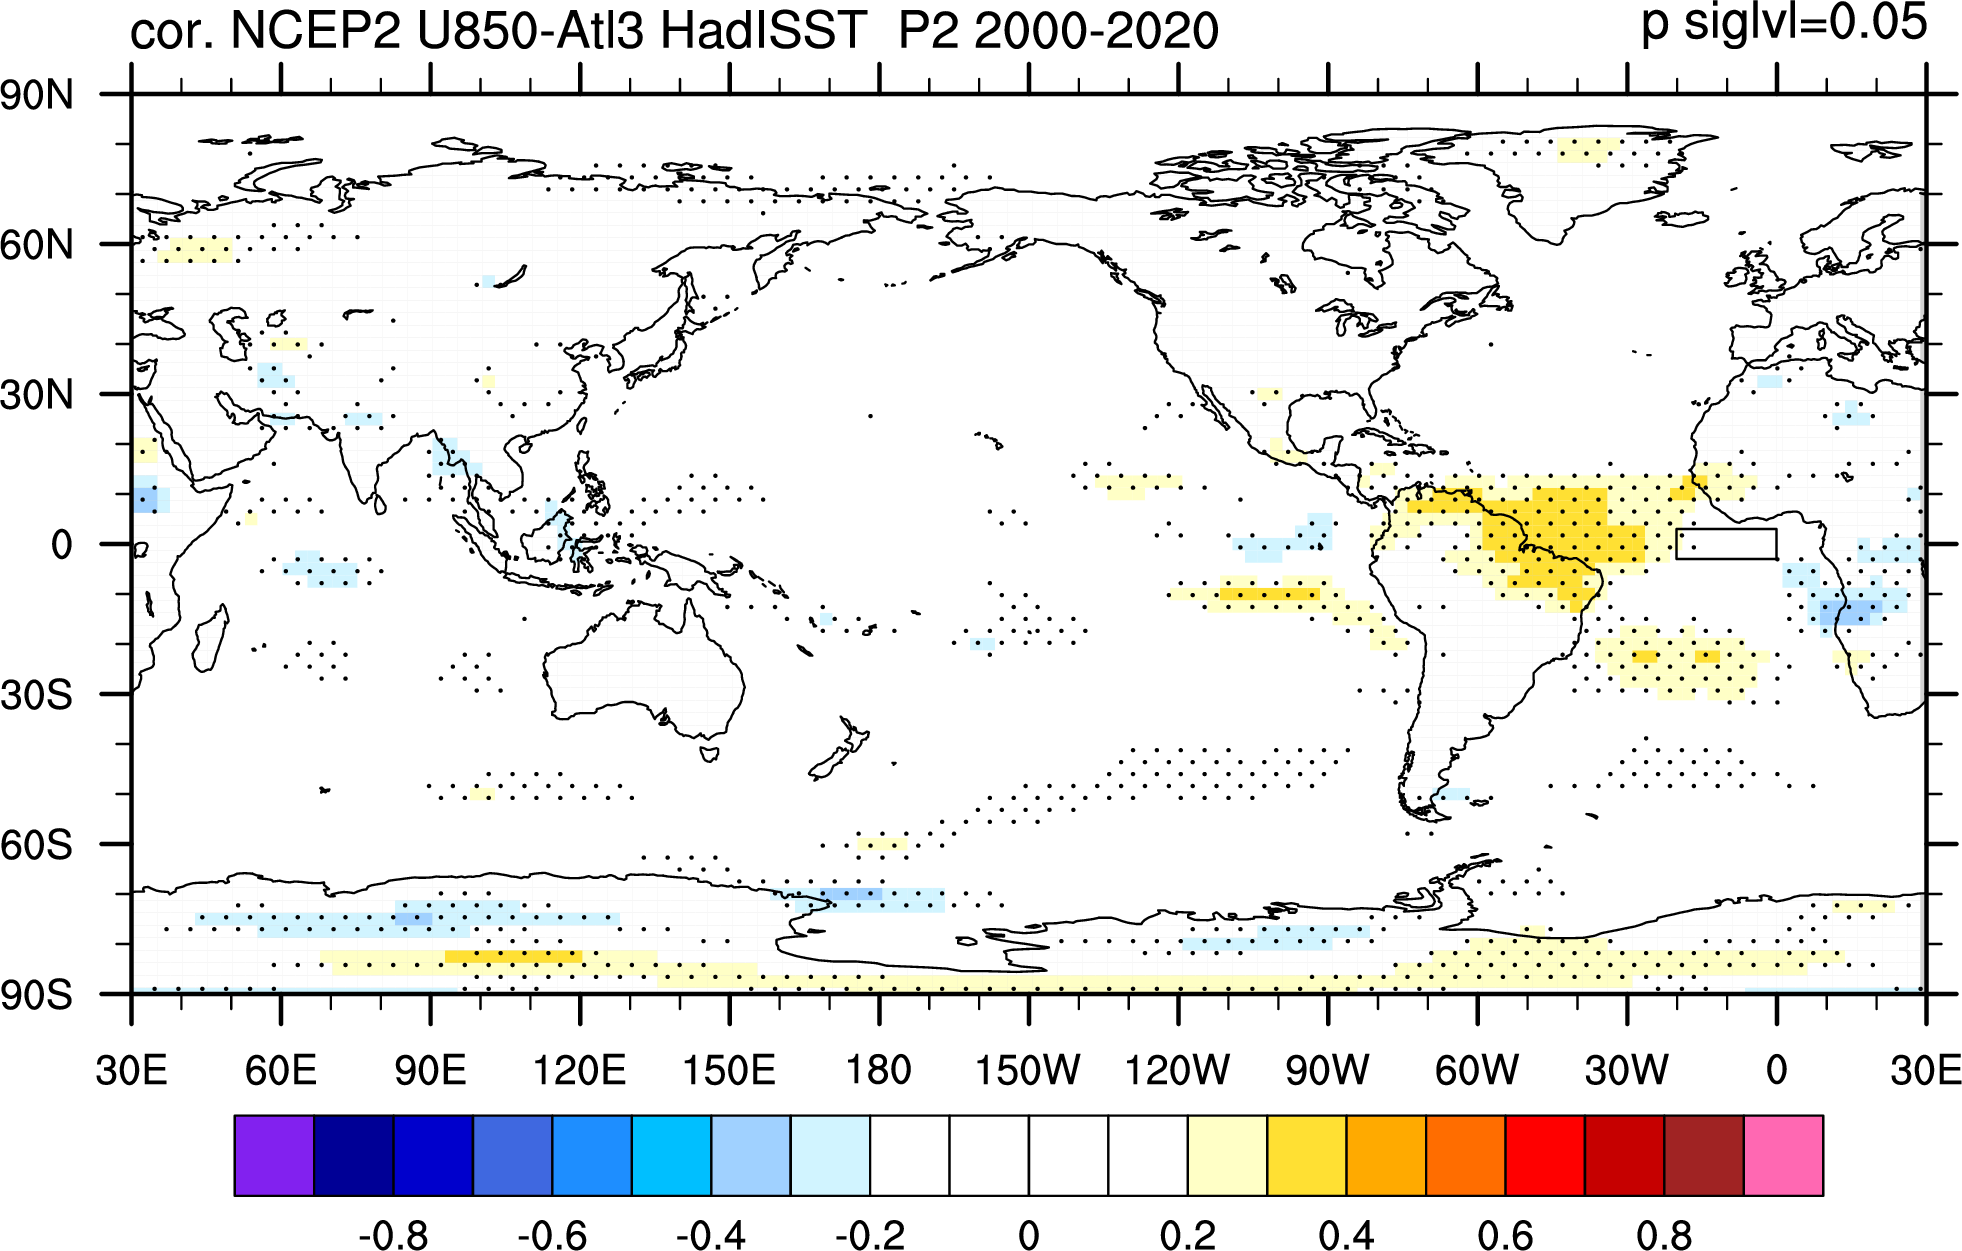
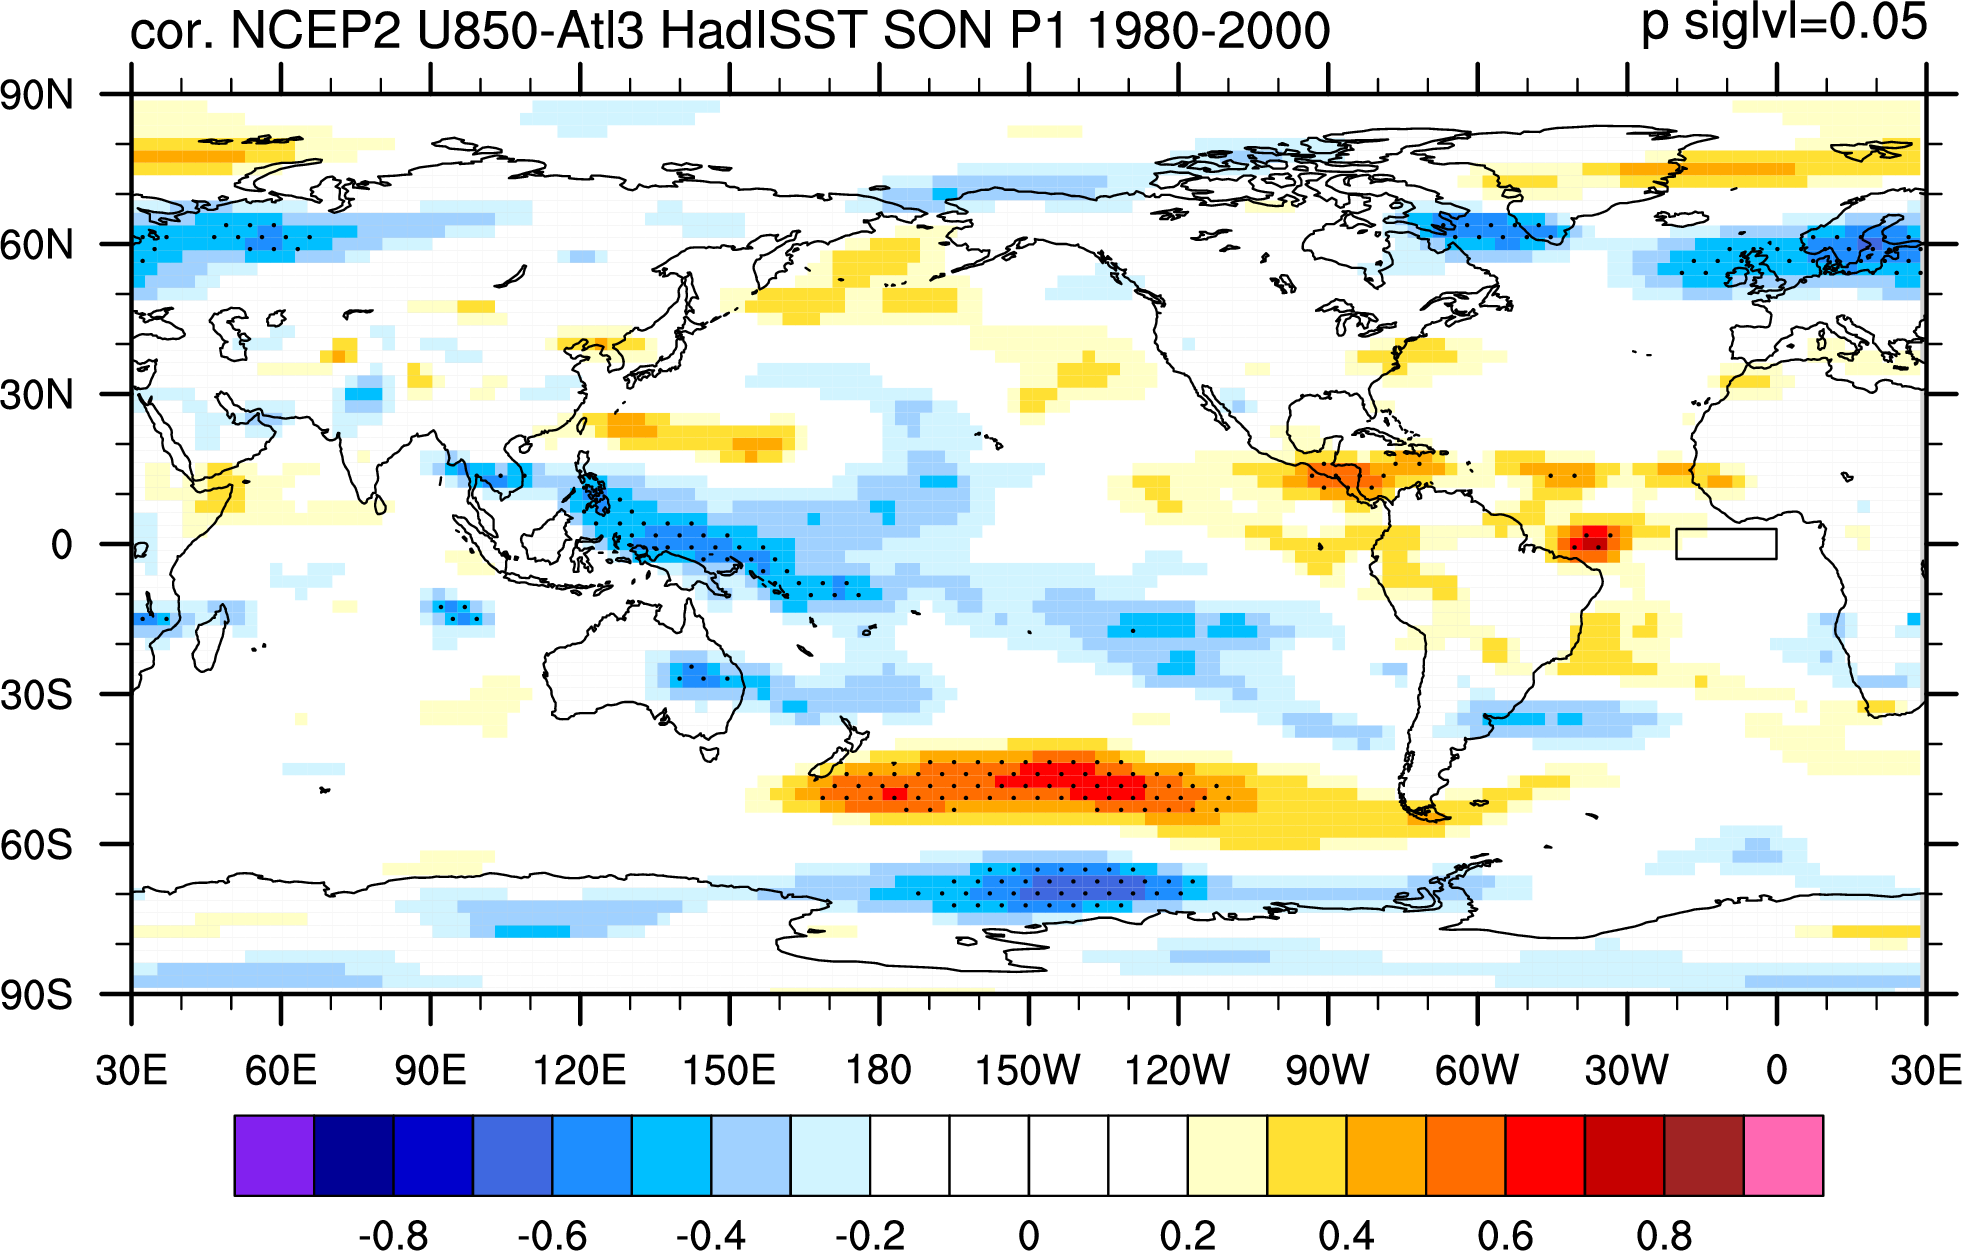
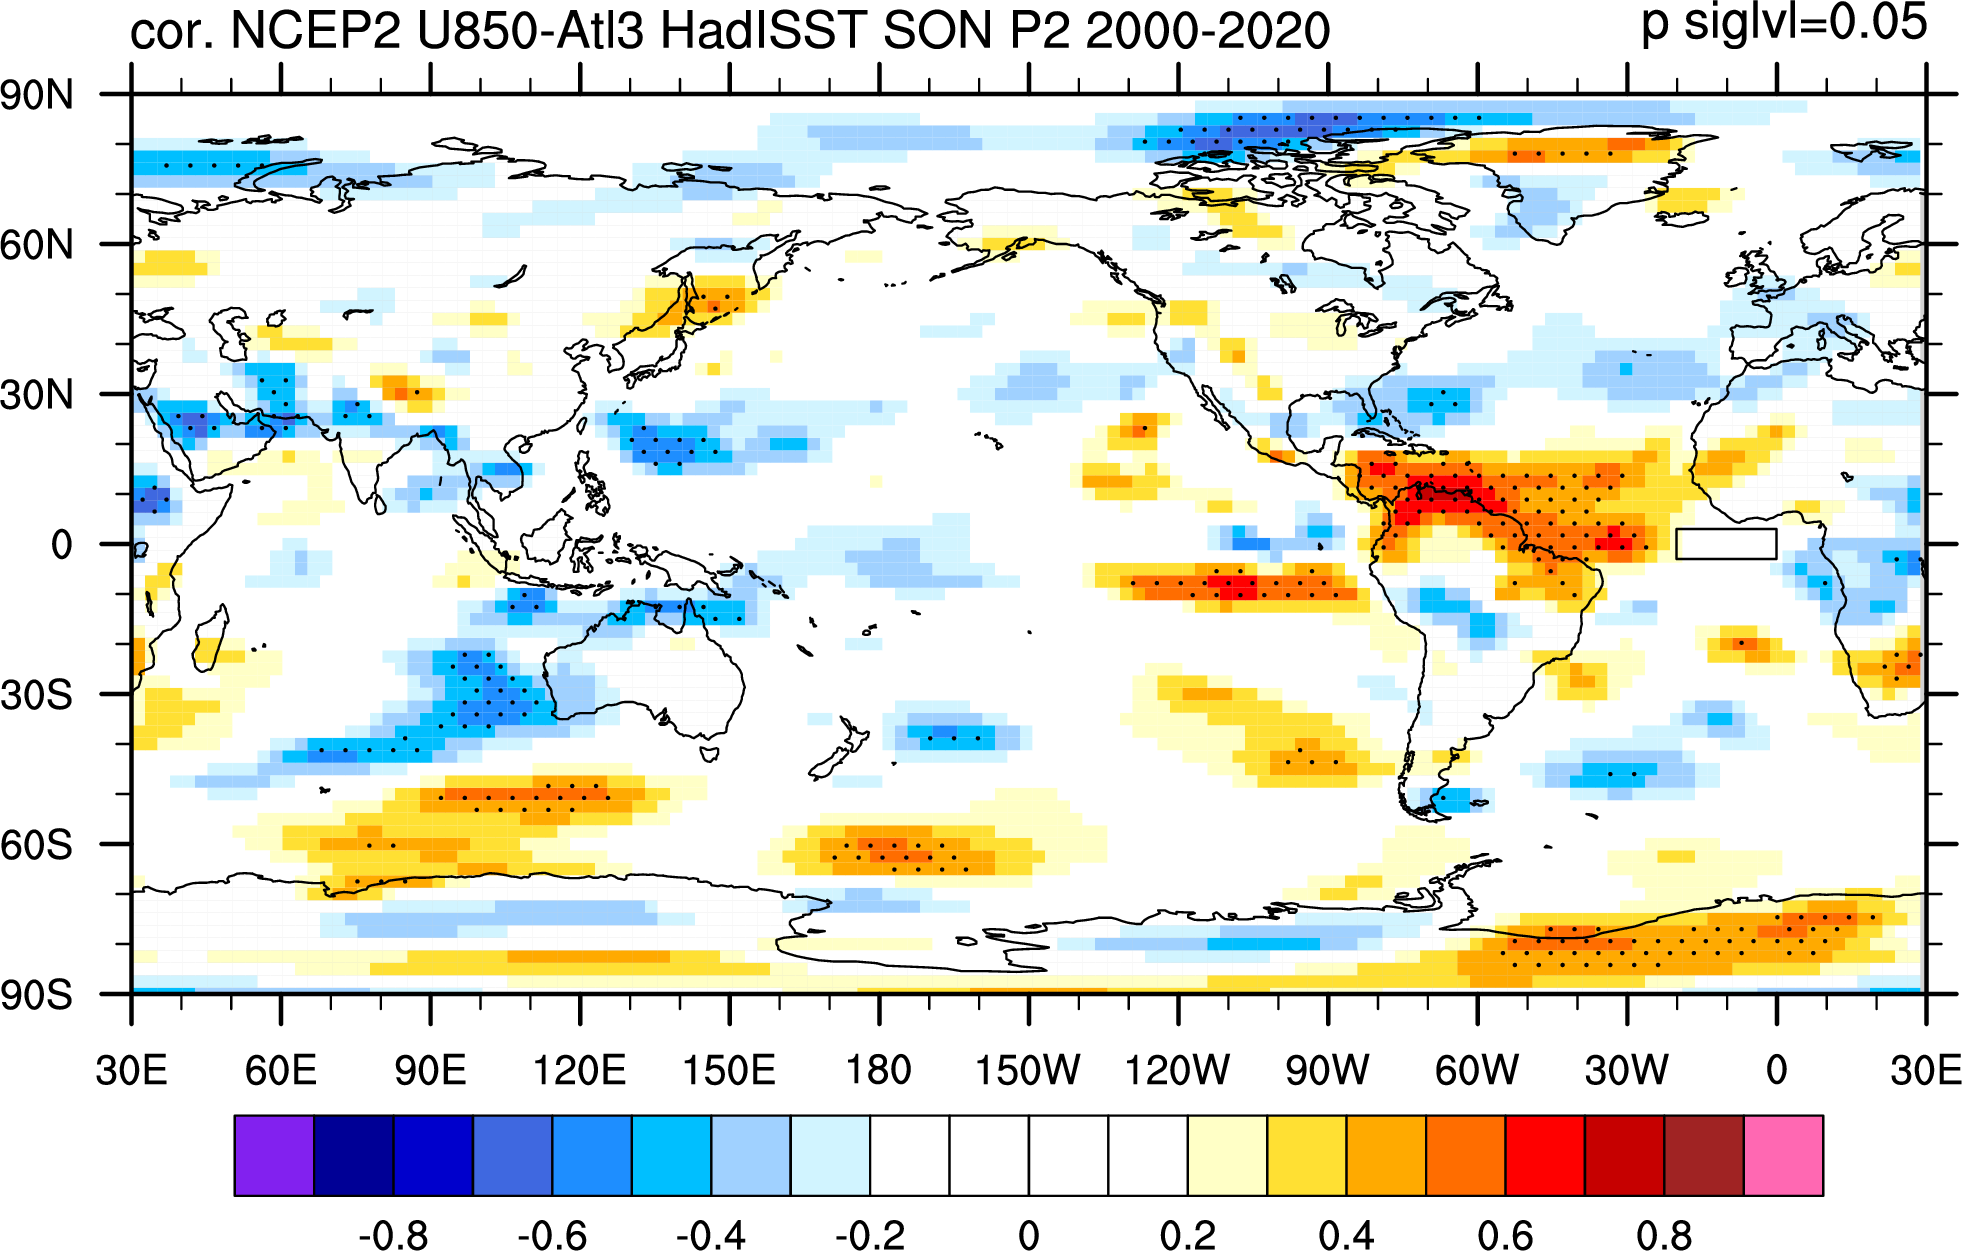
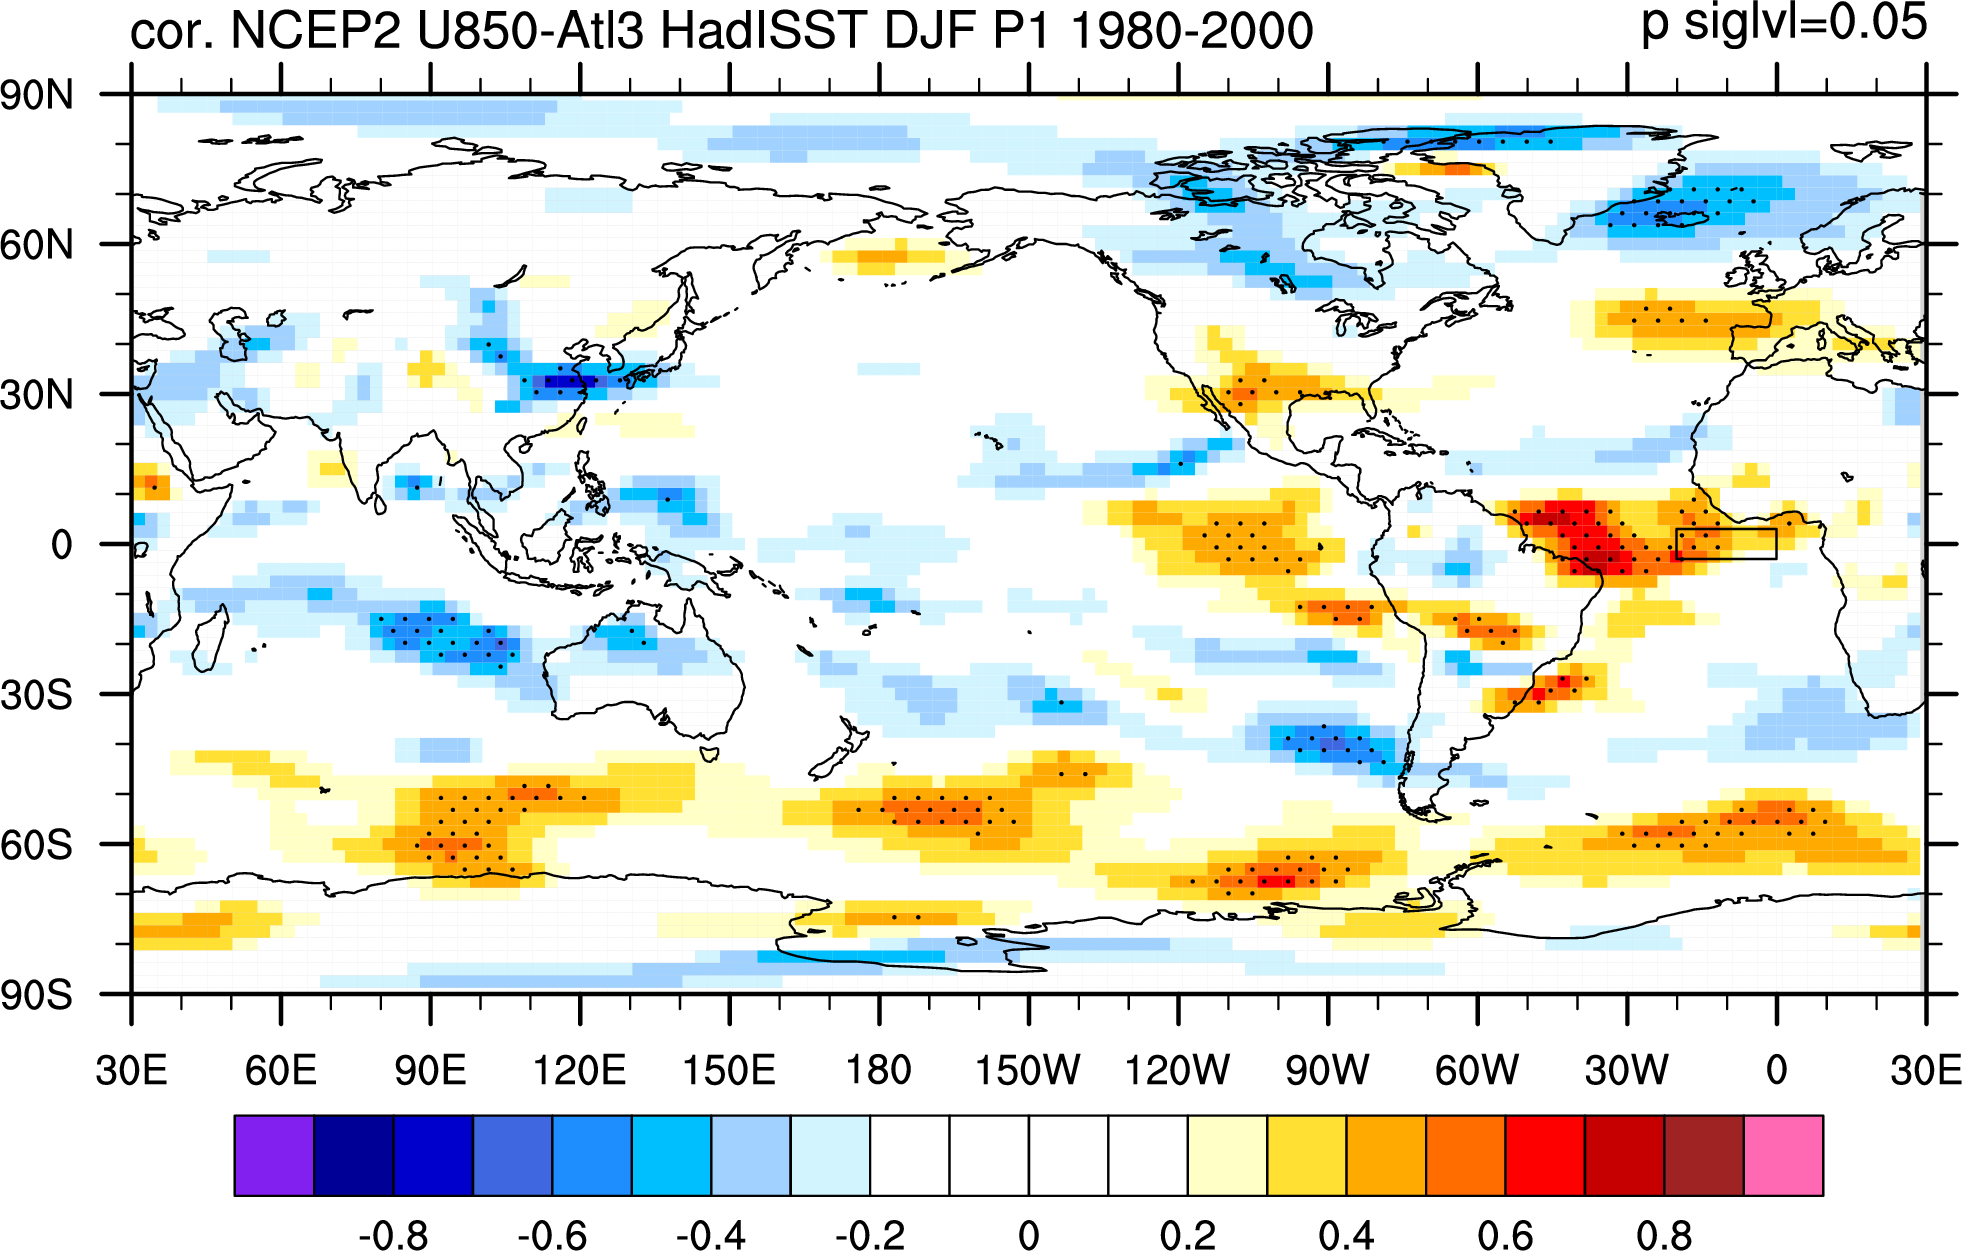
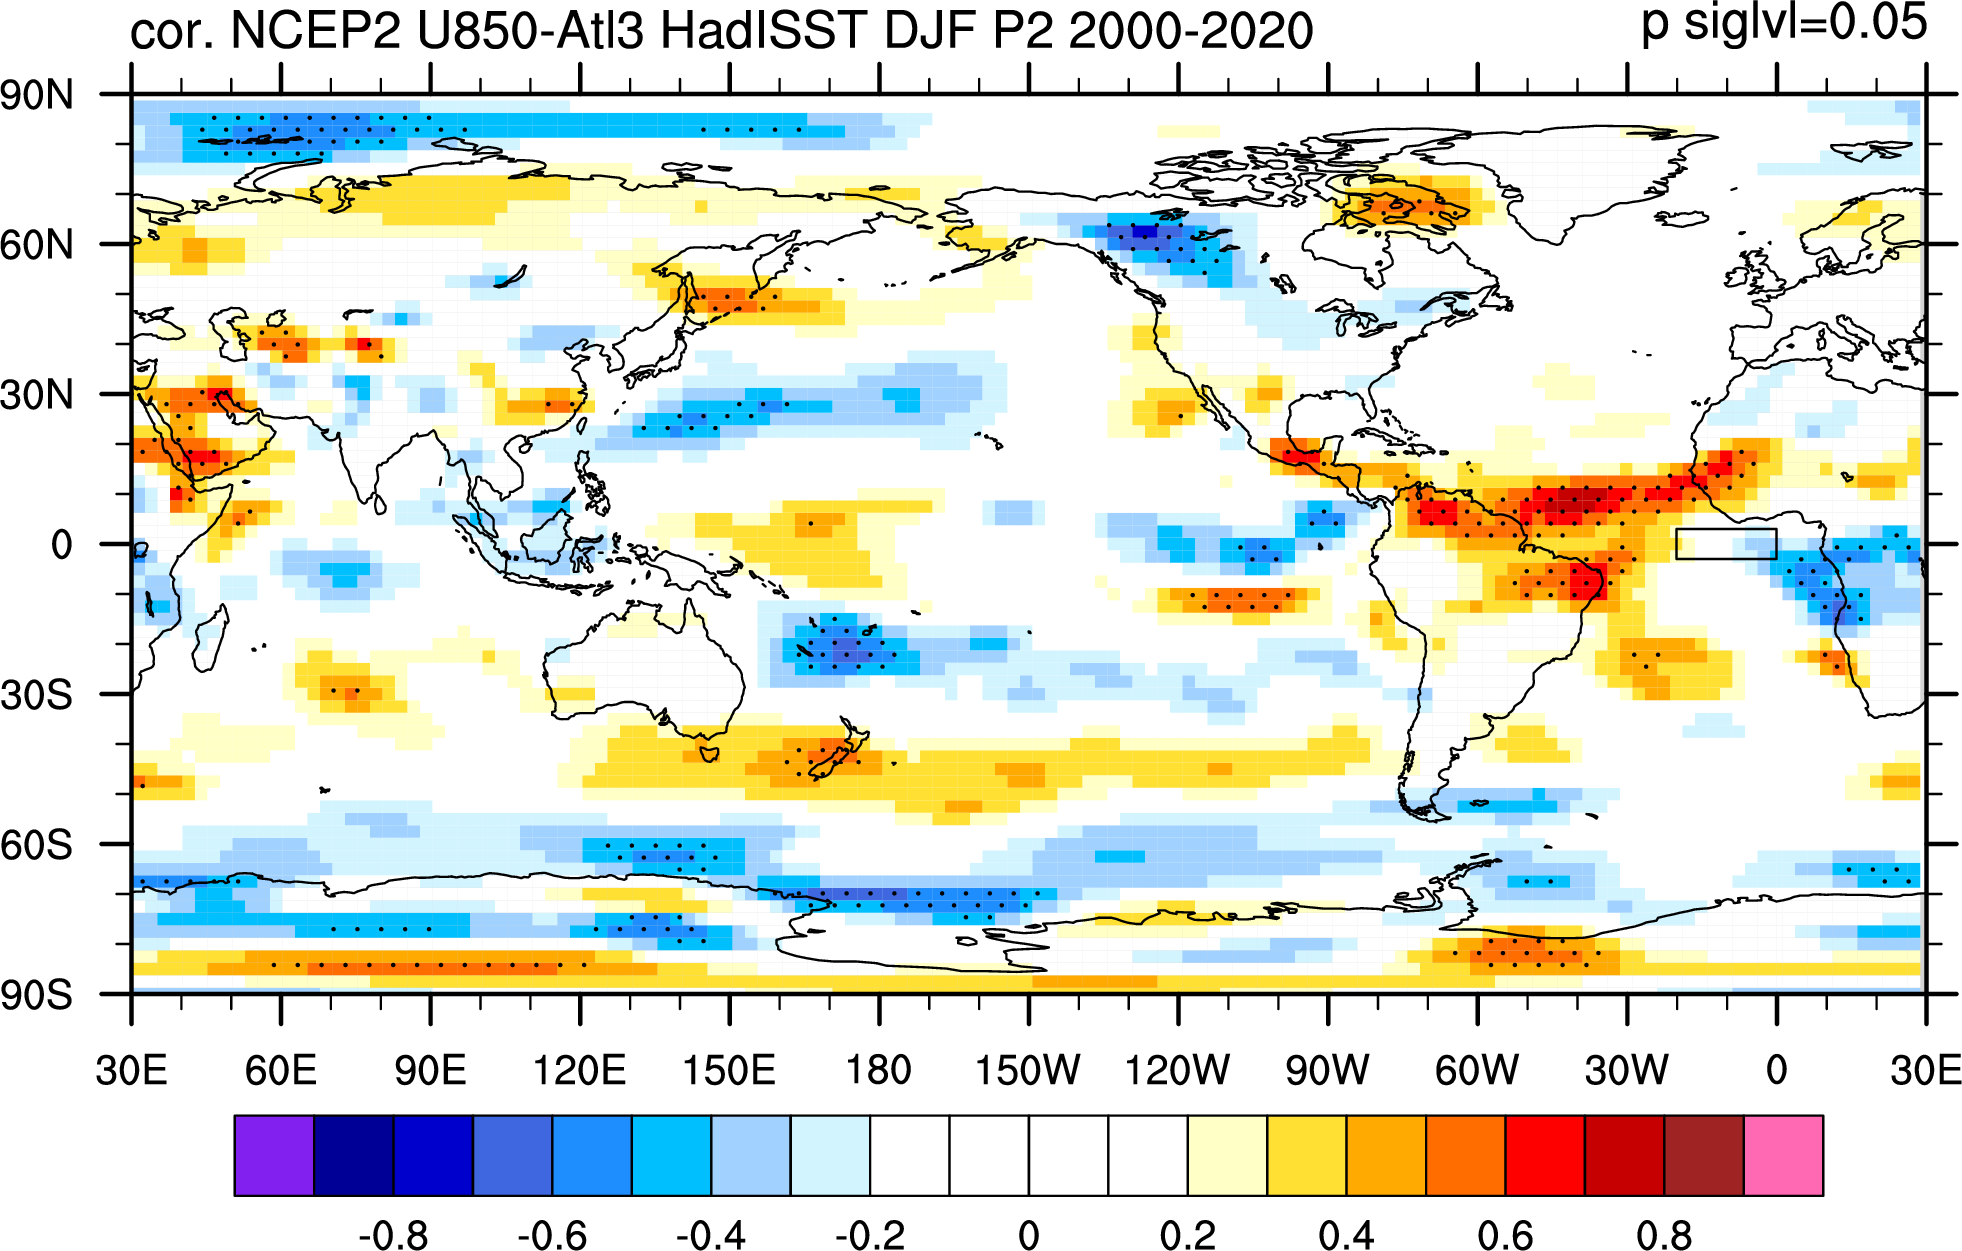
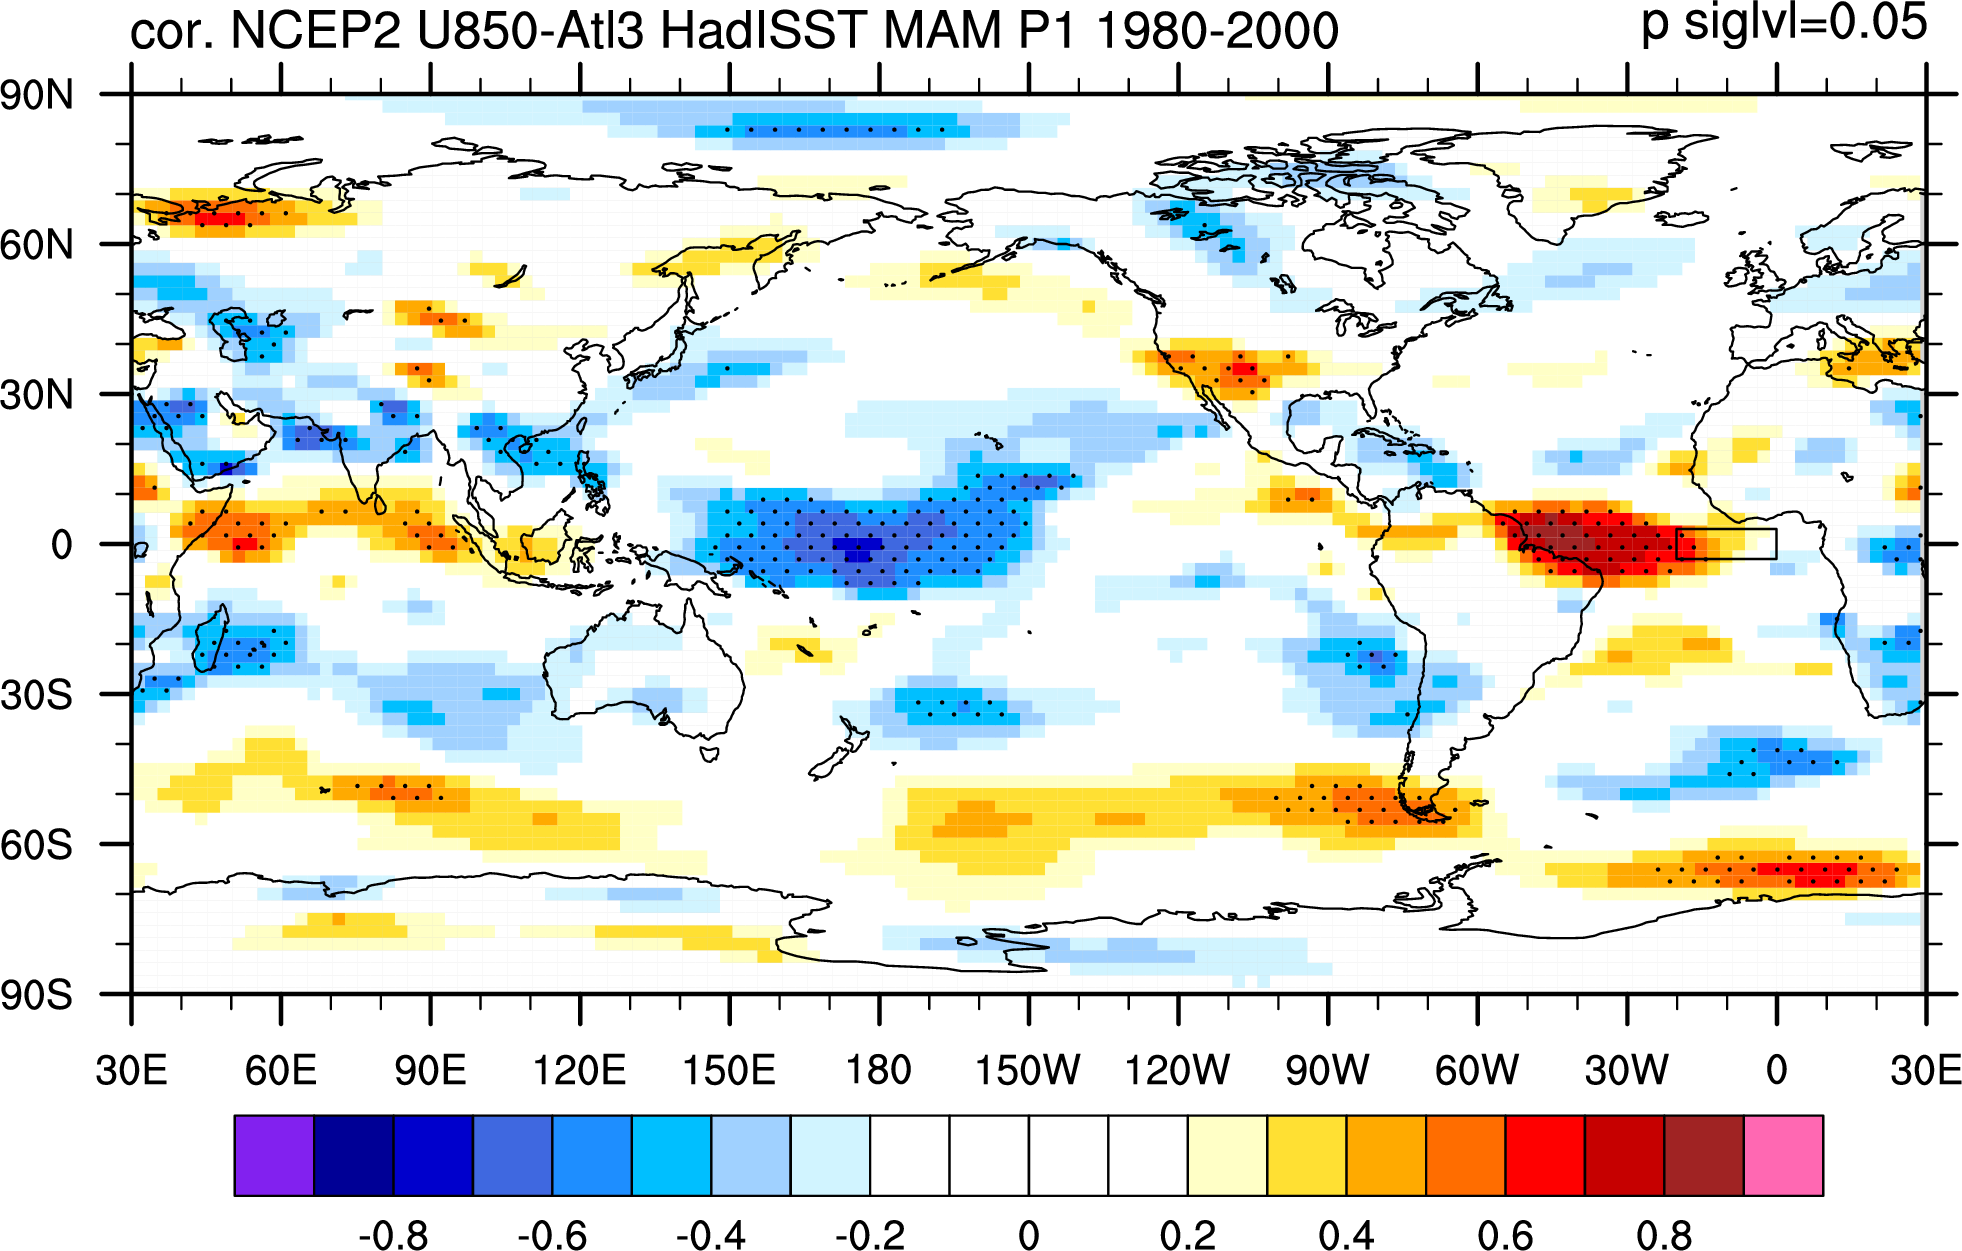
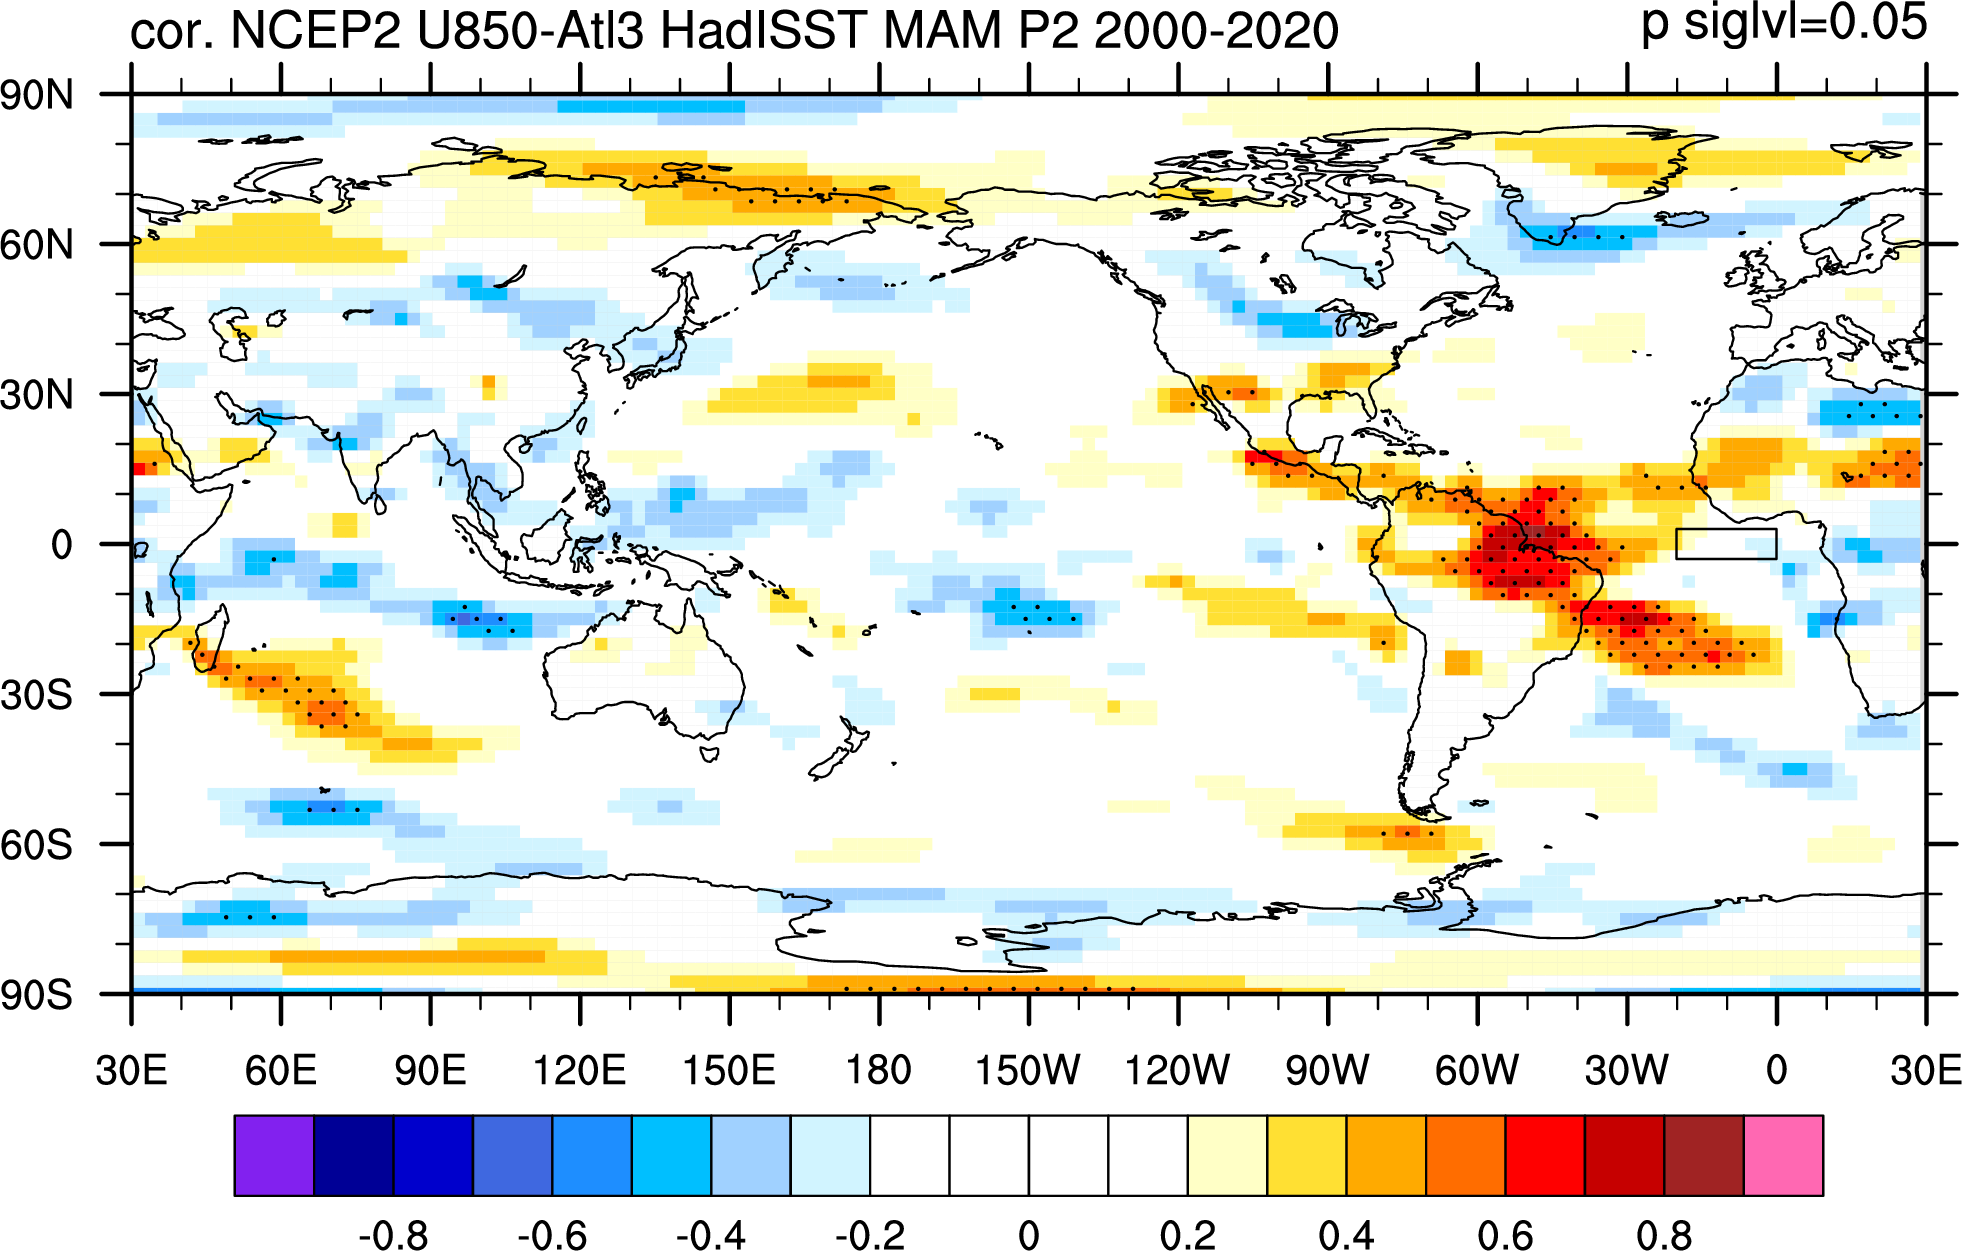
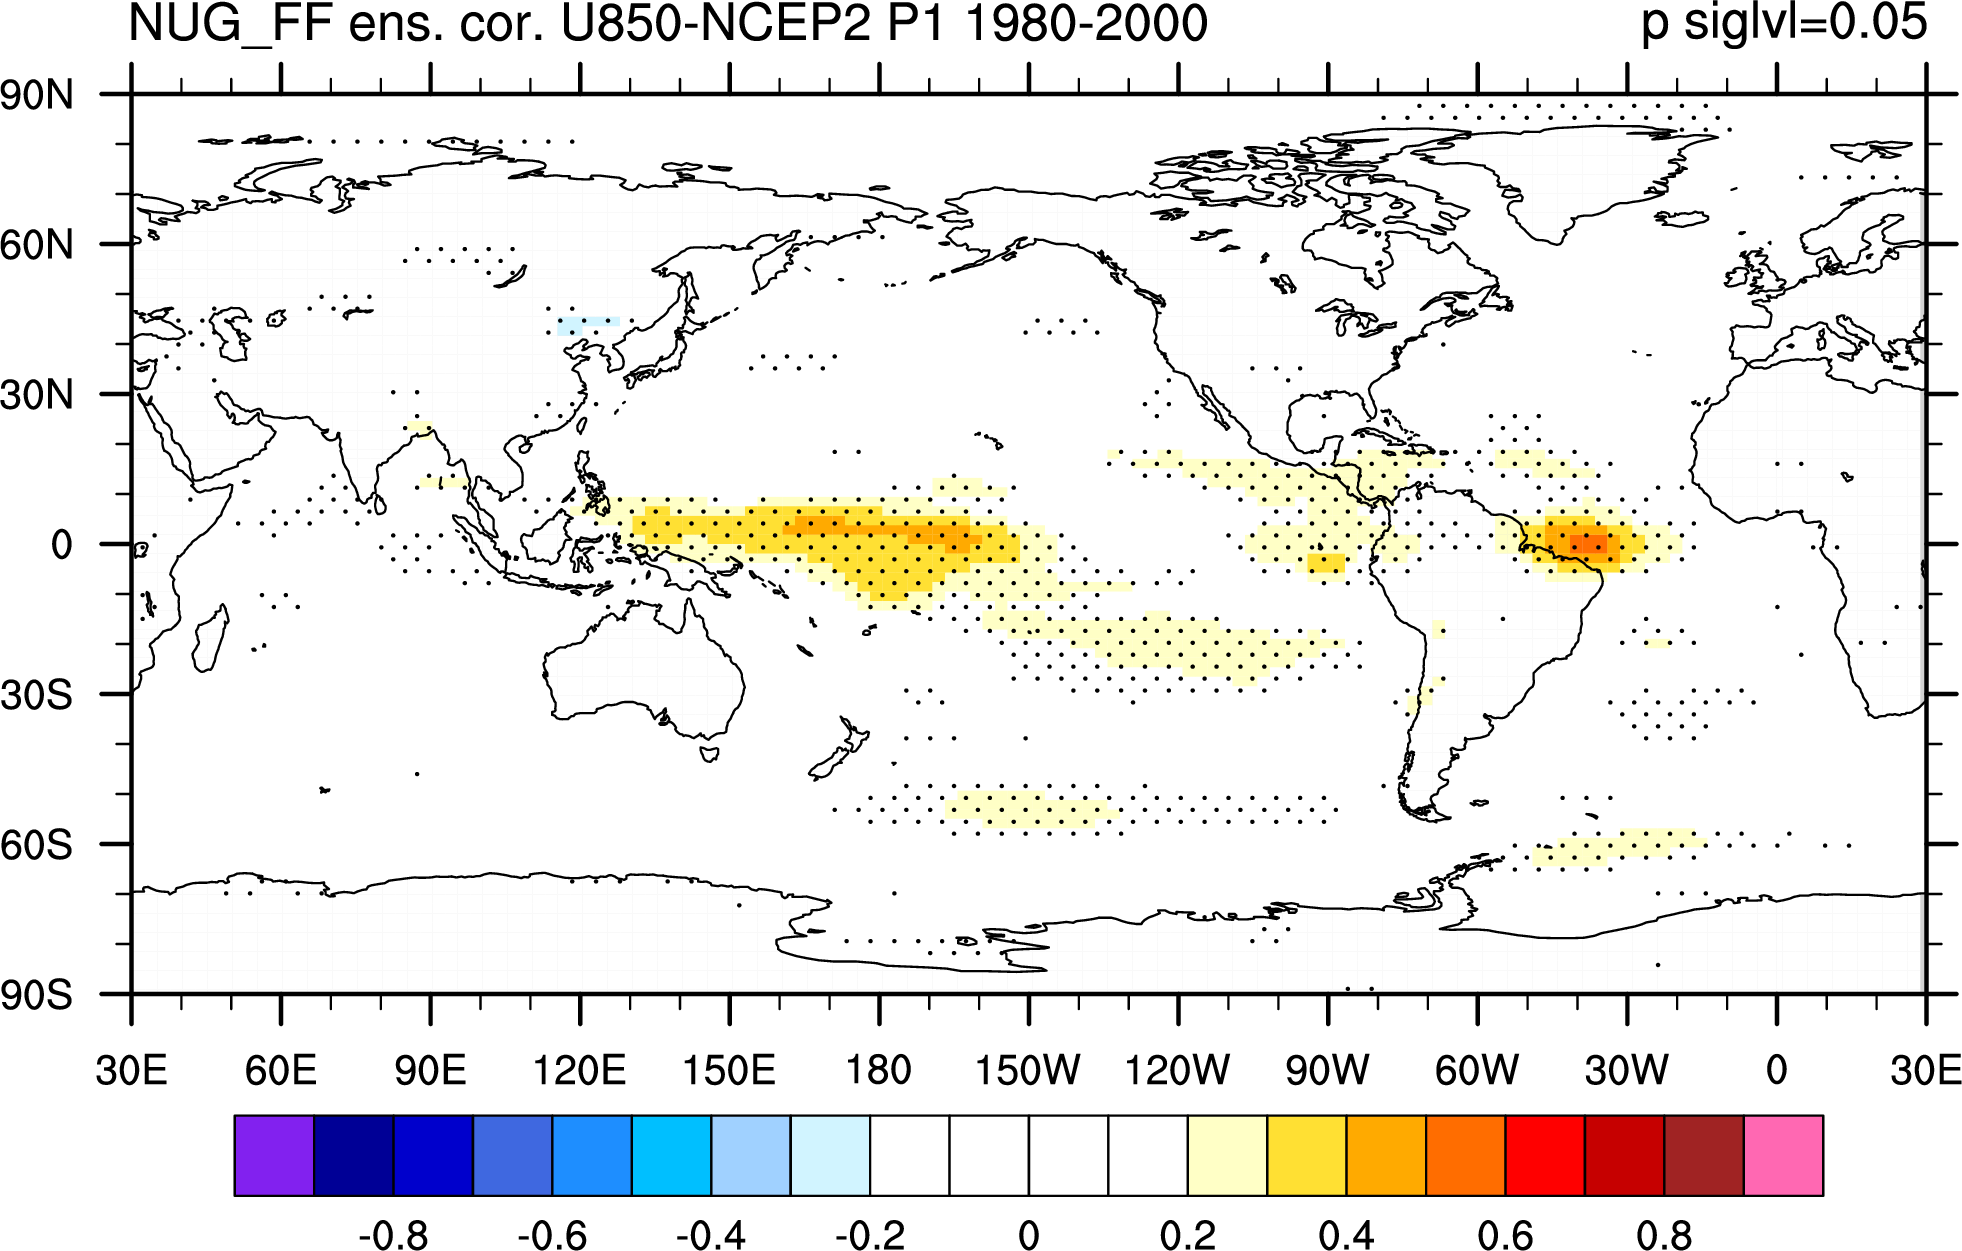
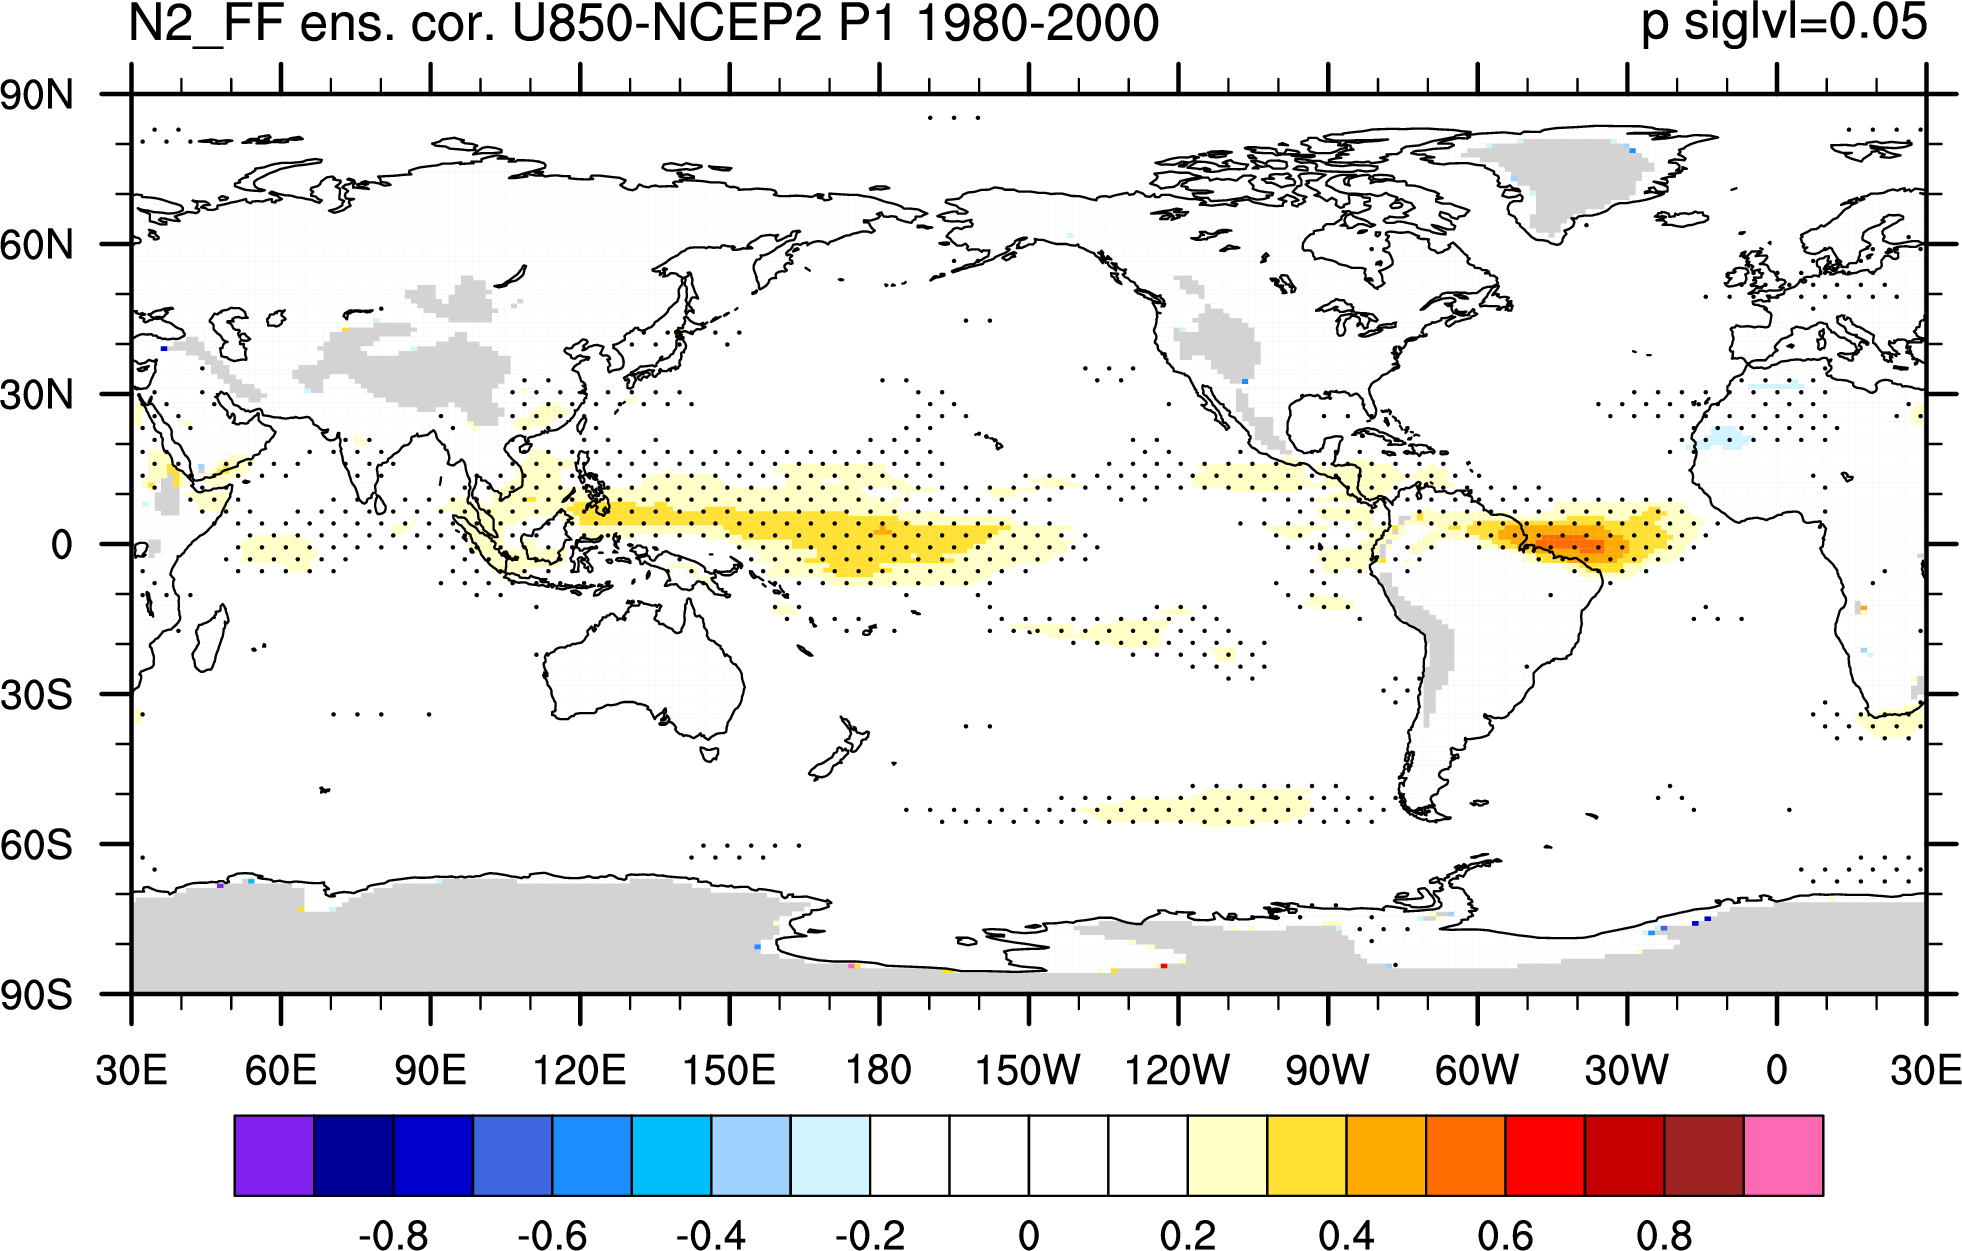
 Same correlation but in NCEP2 and HadISST:
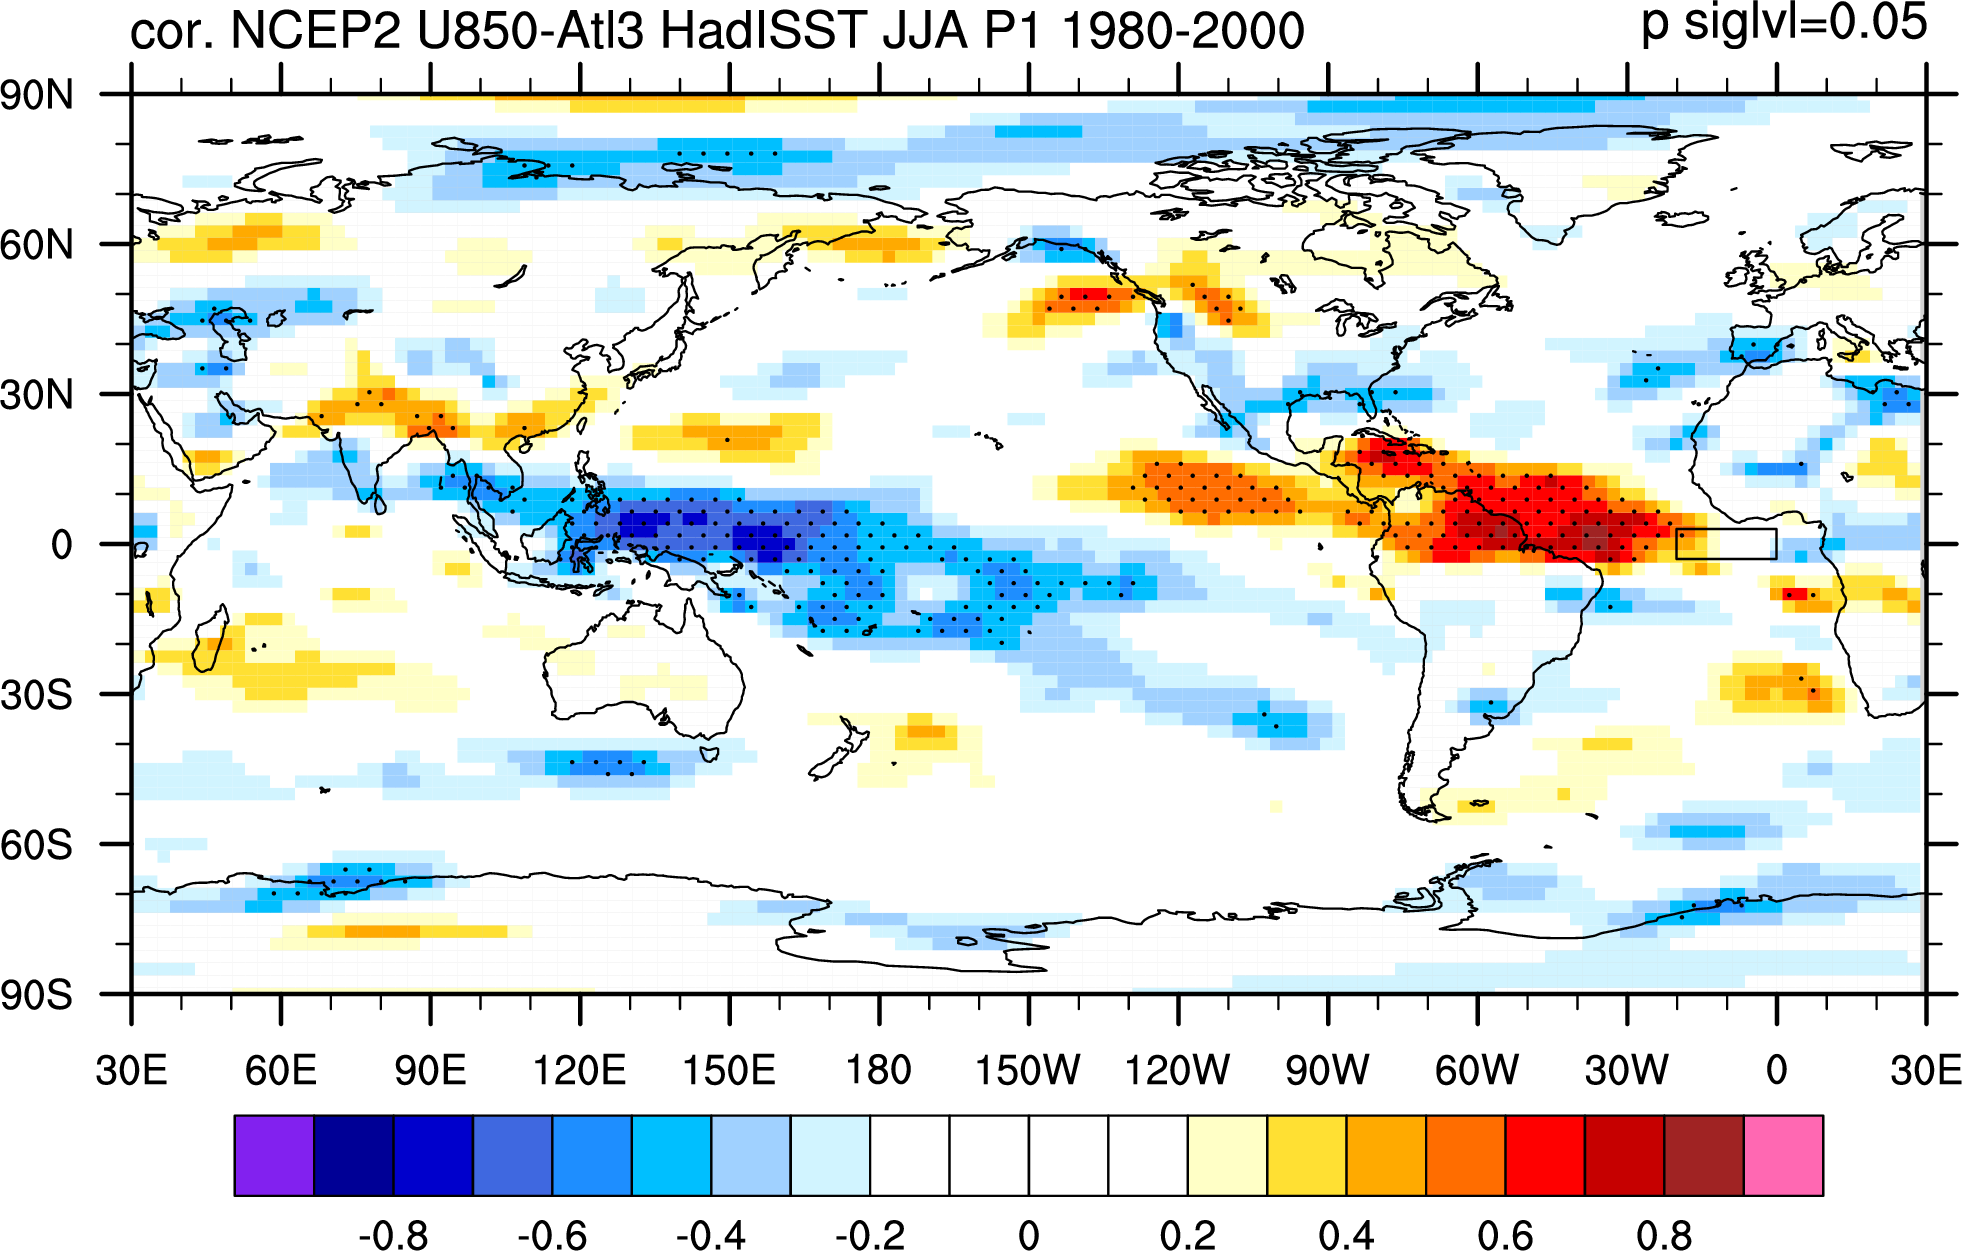
 The correlation is start from MAM (1980-2000):
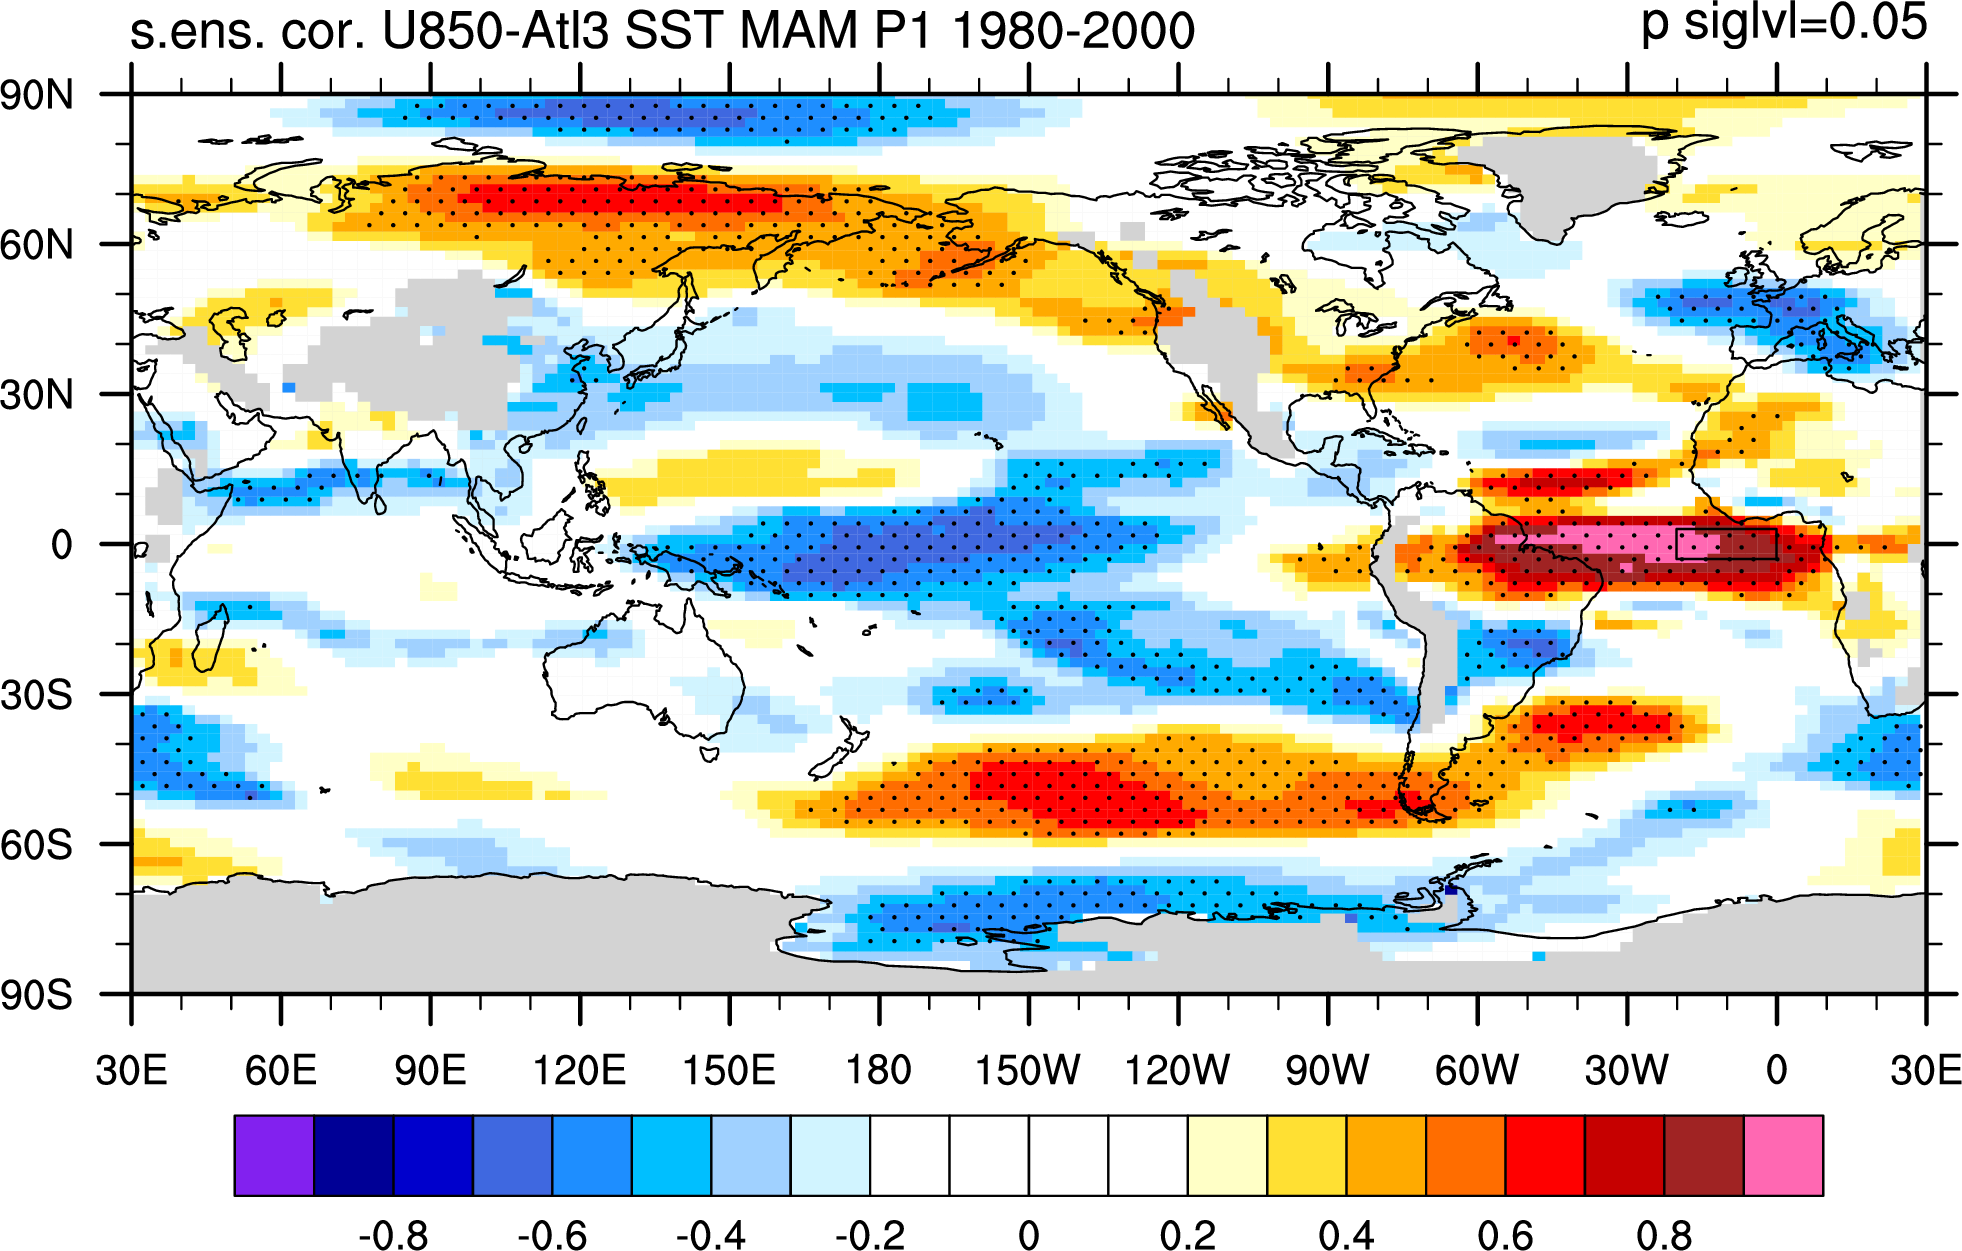
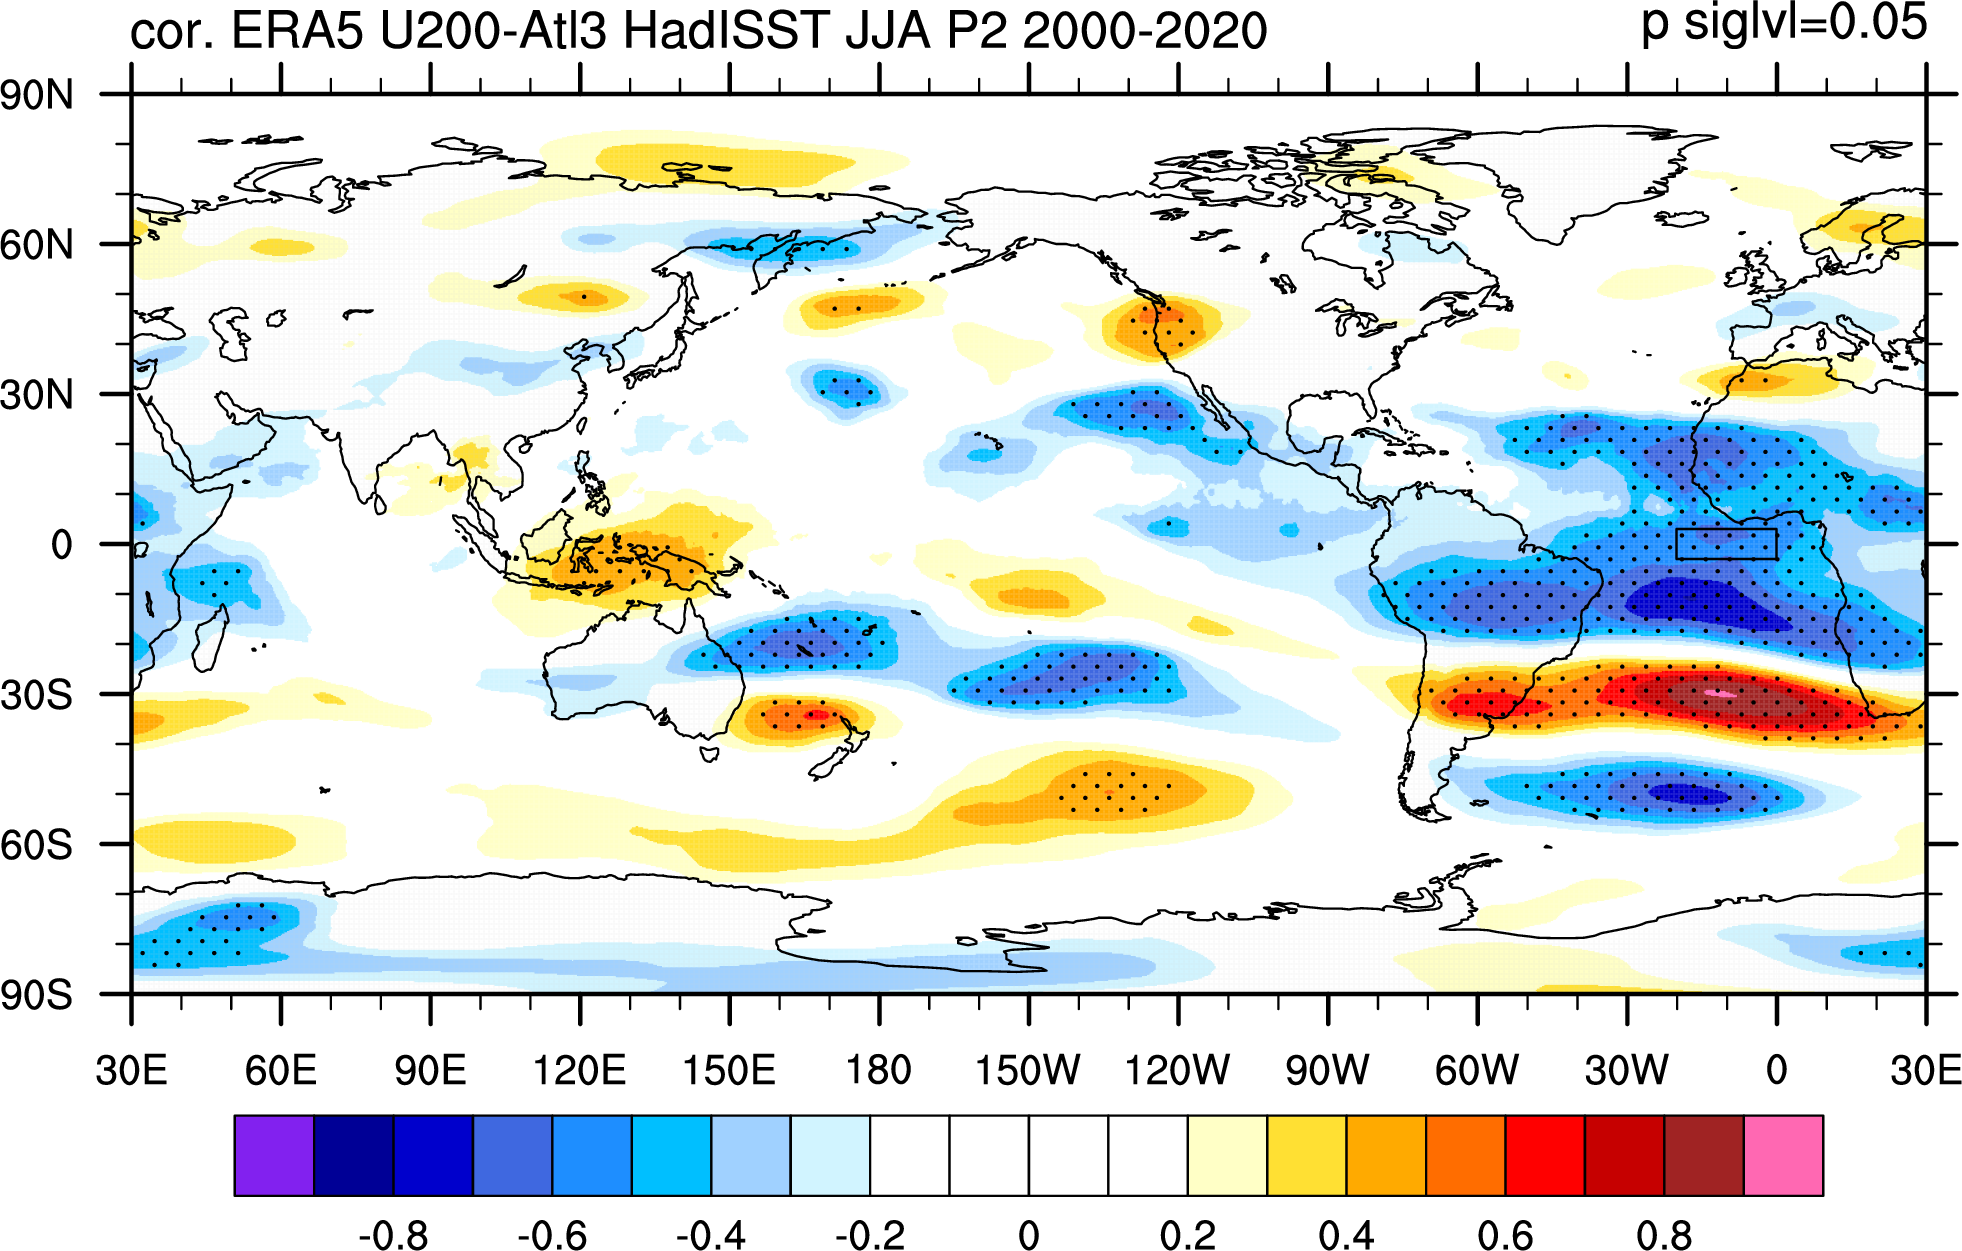
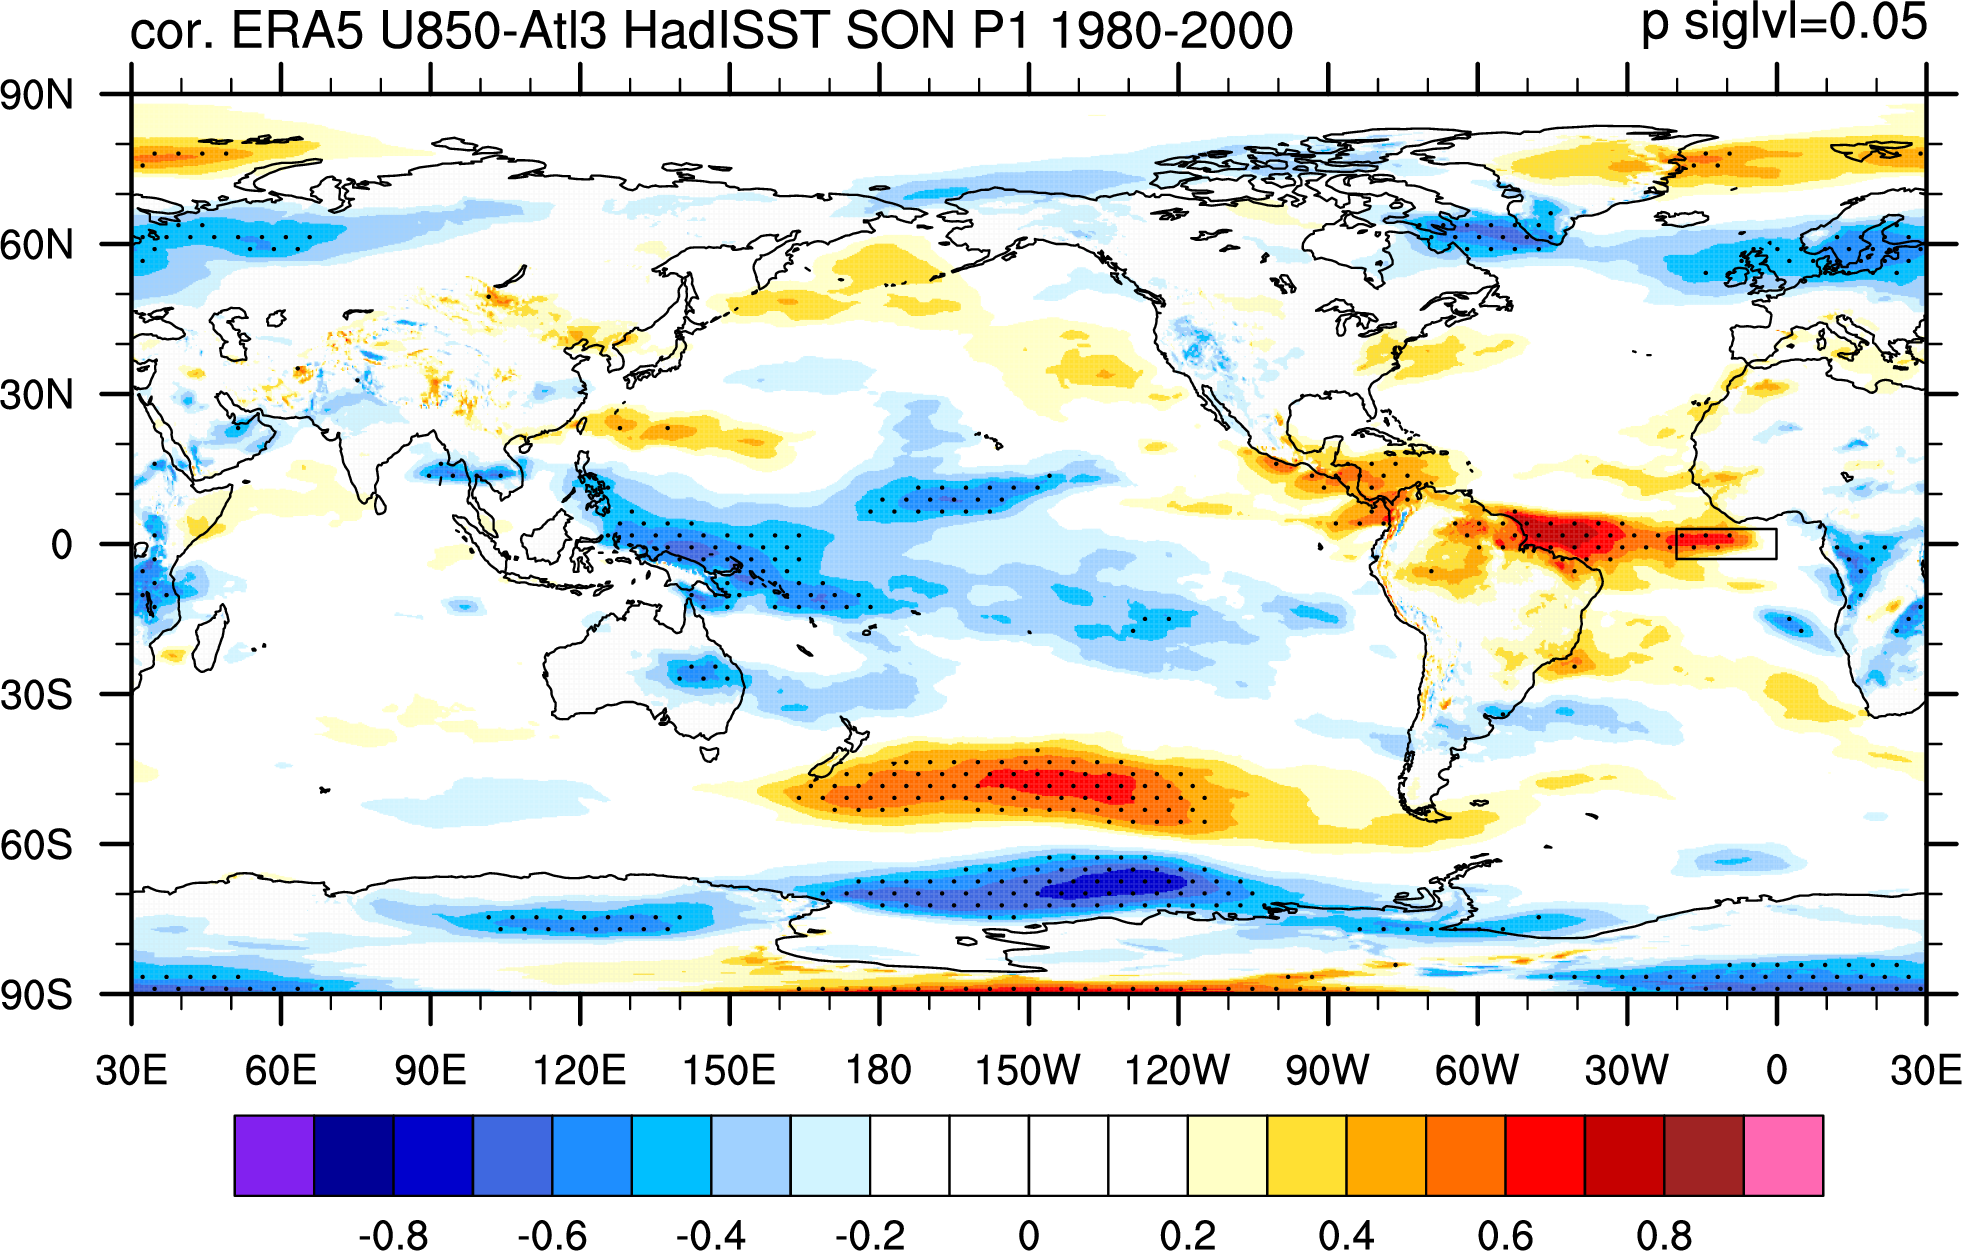
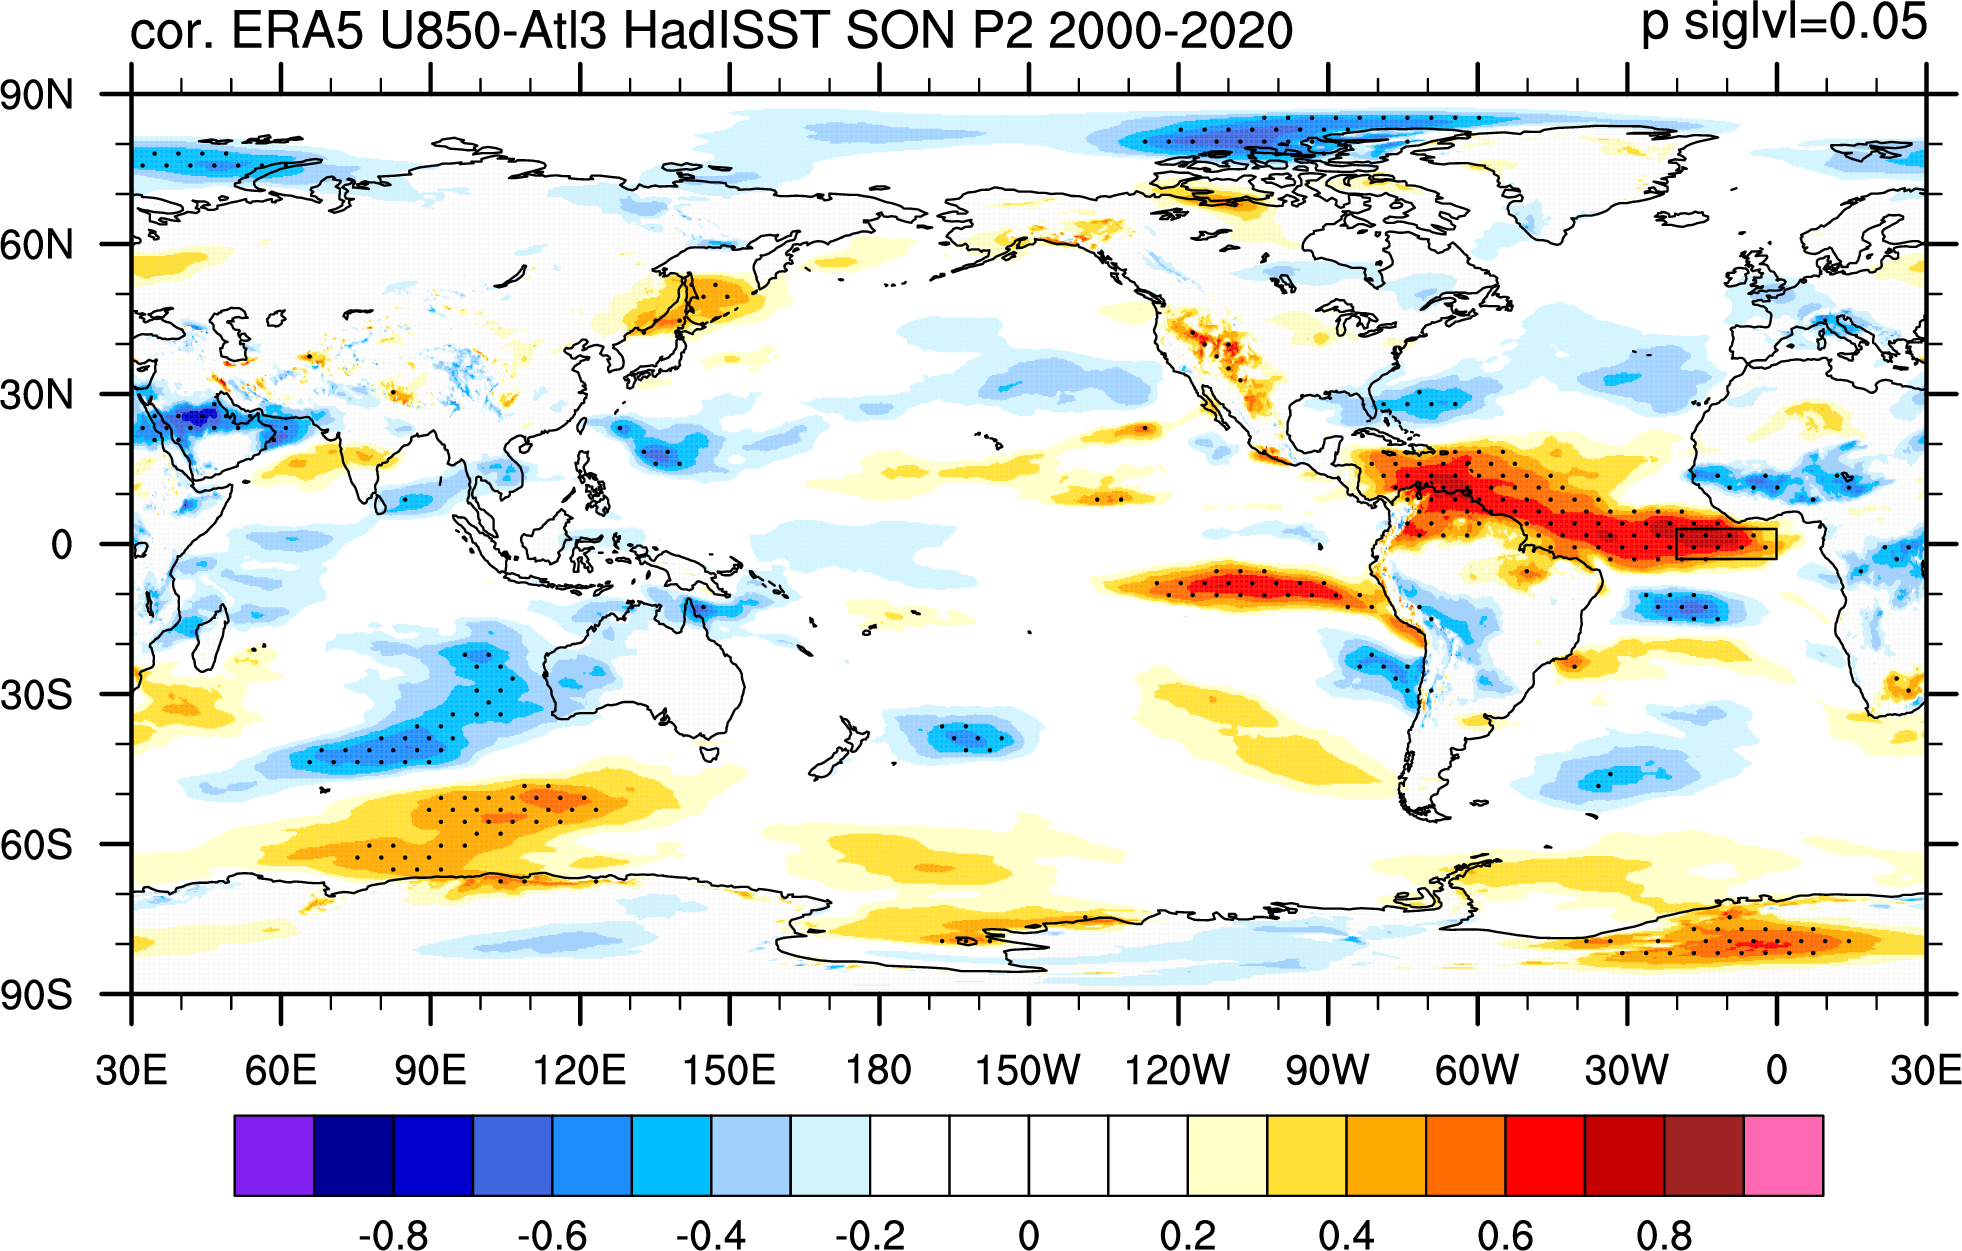
 Compare to reanalysis (ERA5-HadISST):
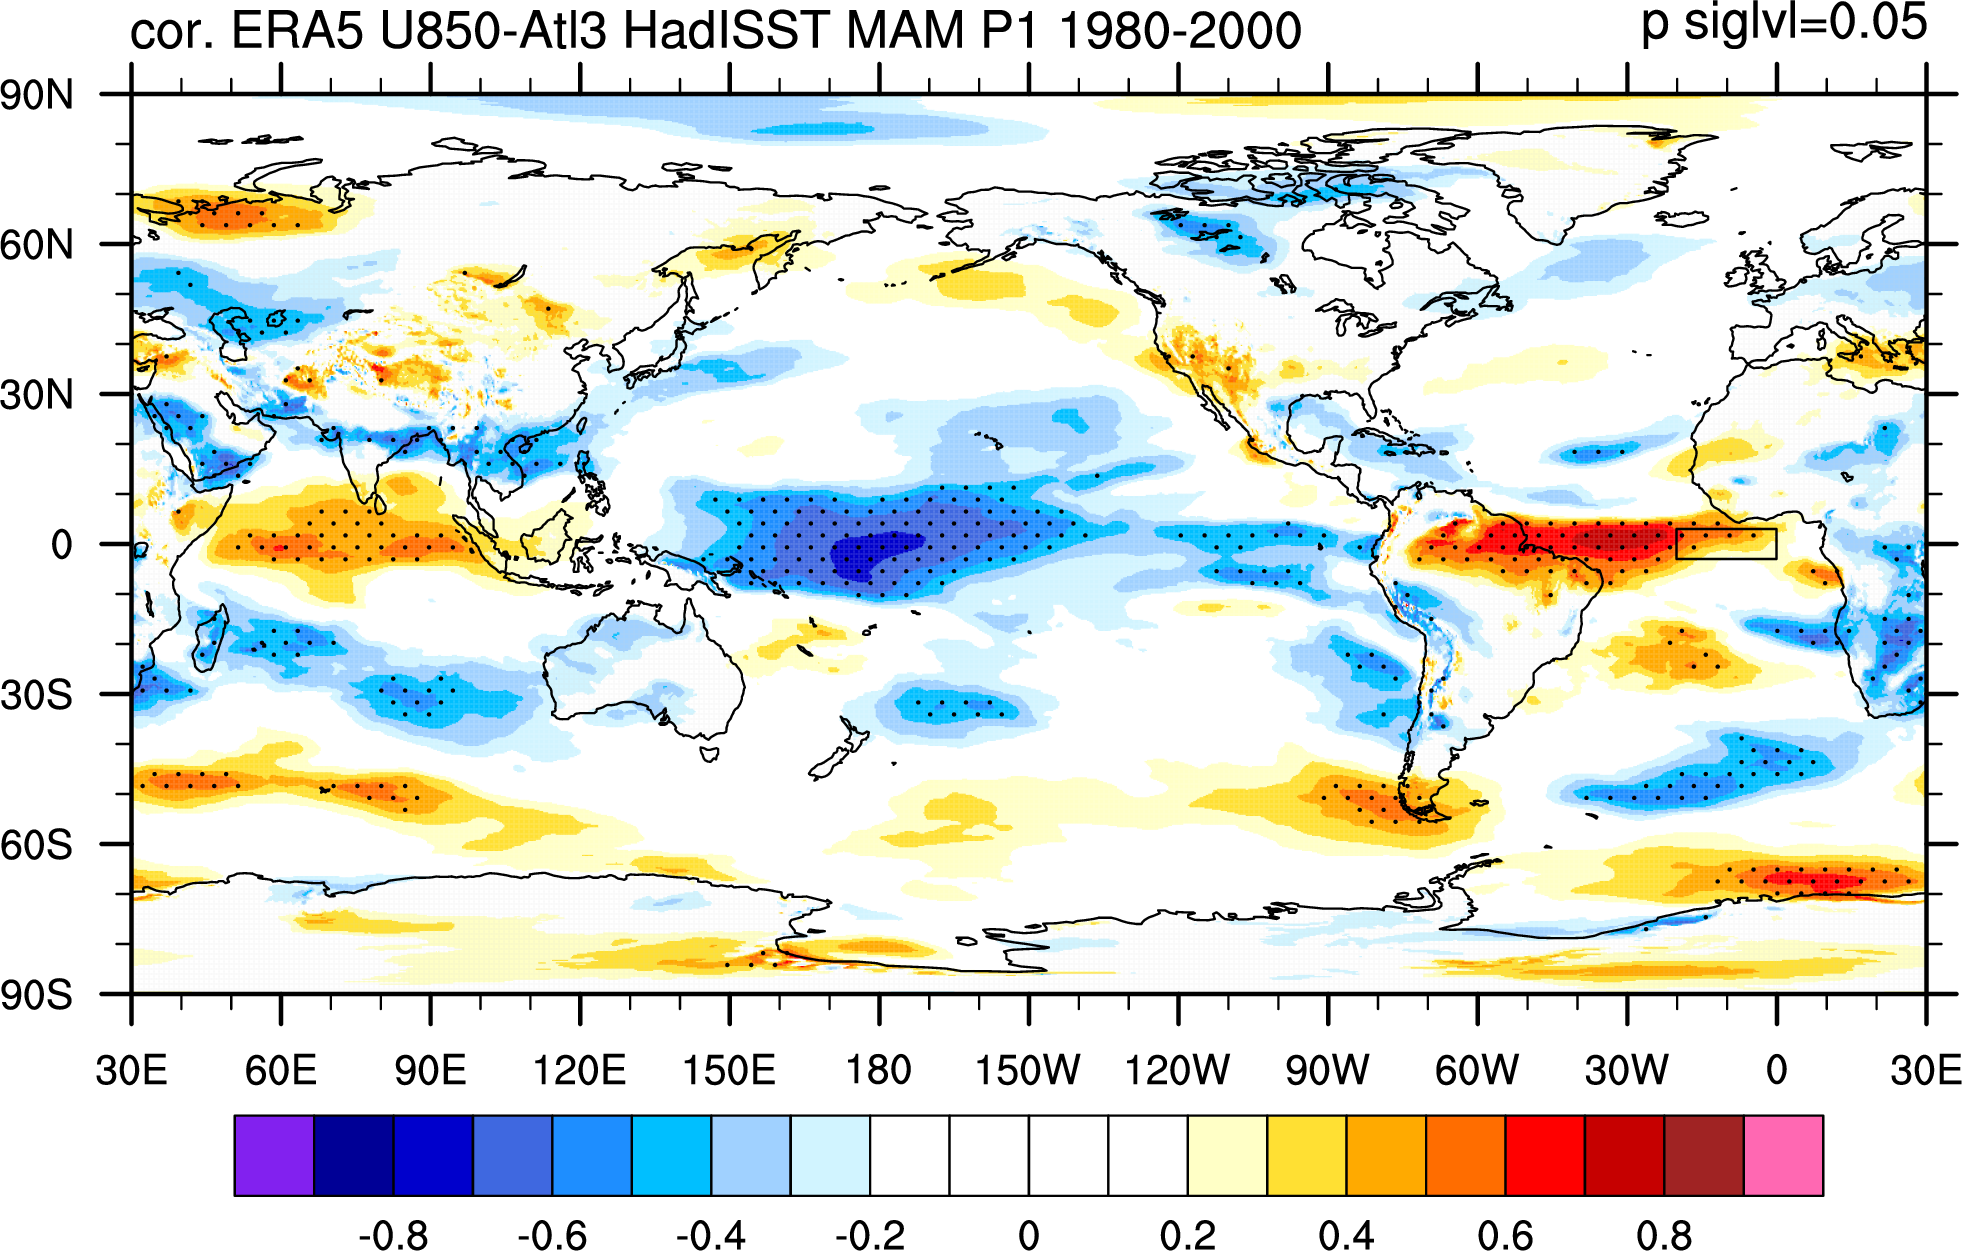
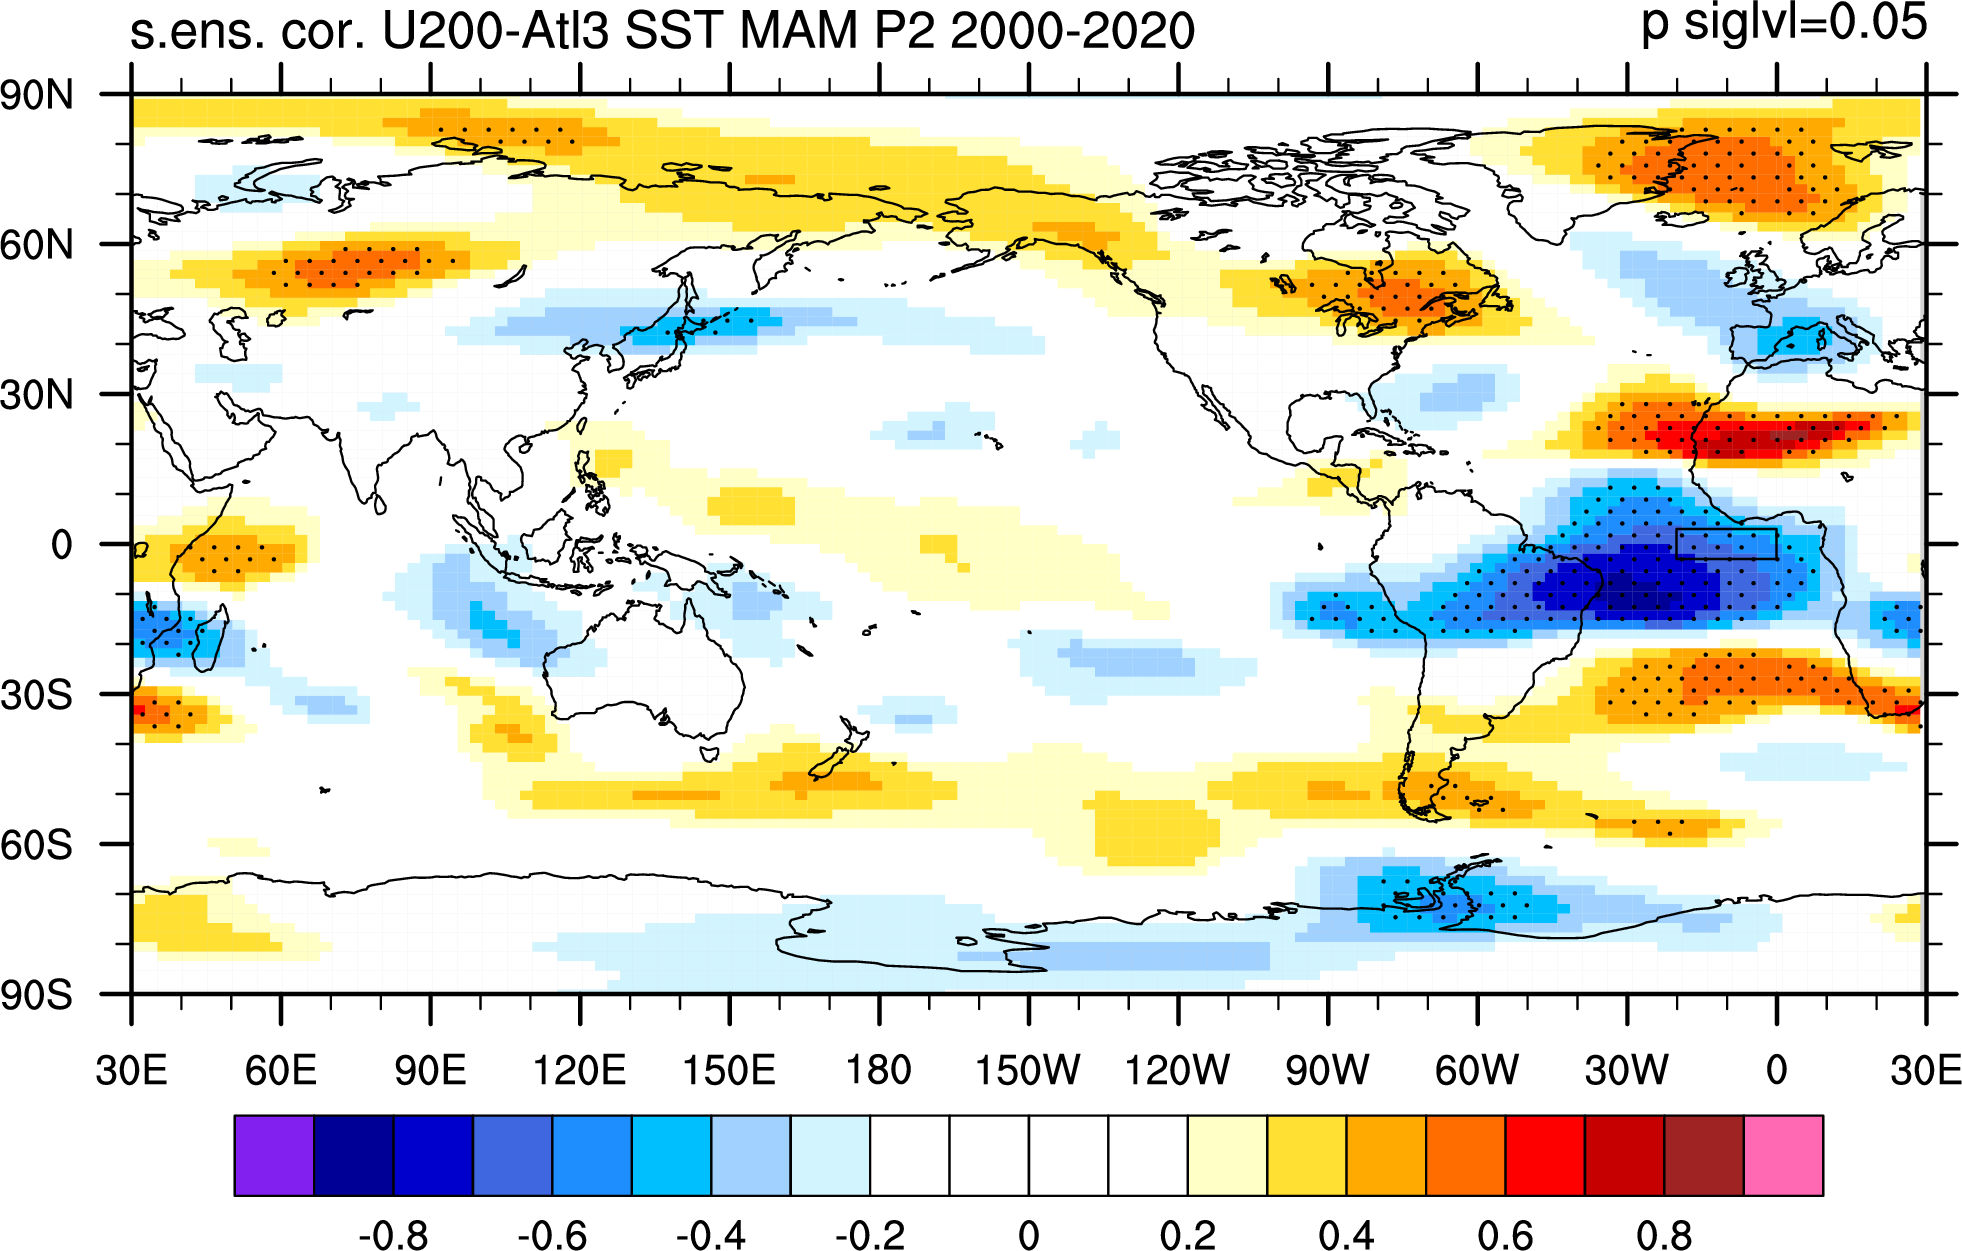
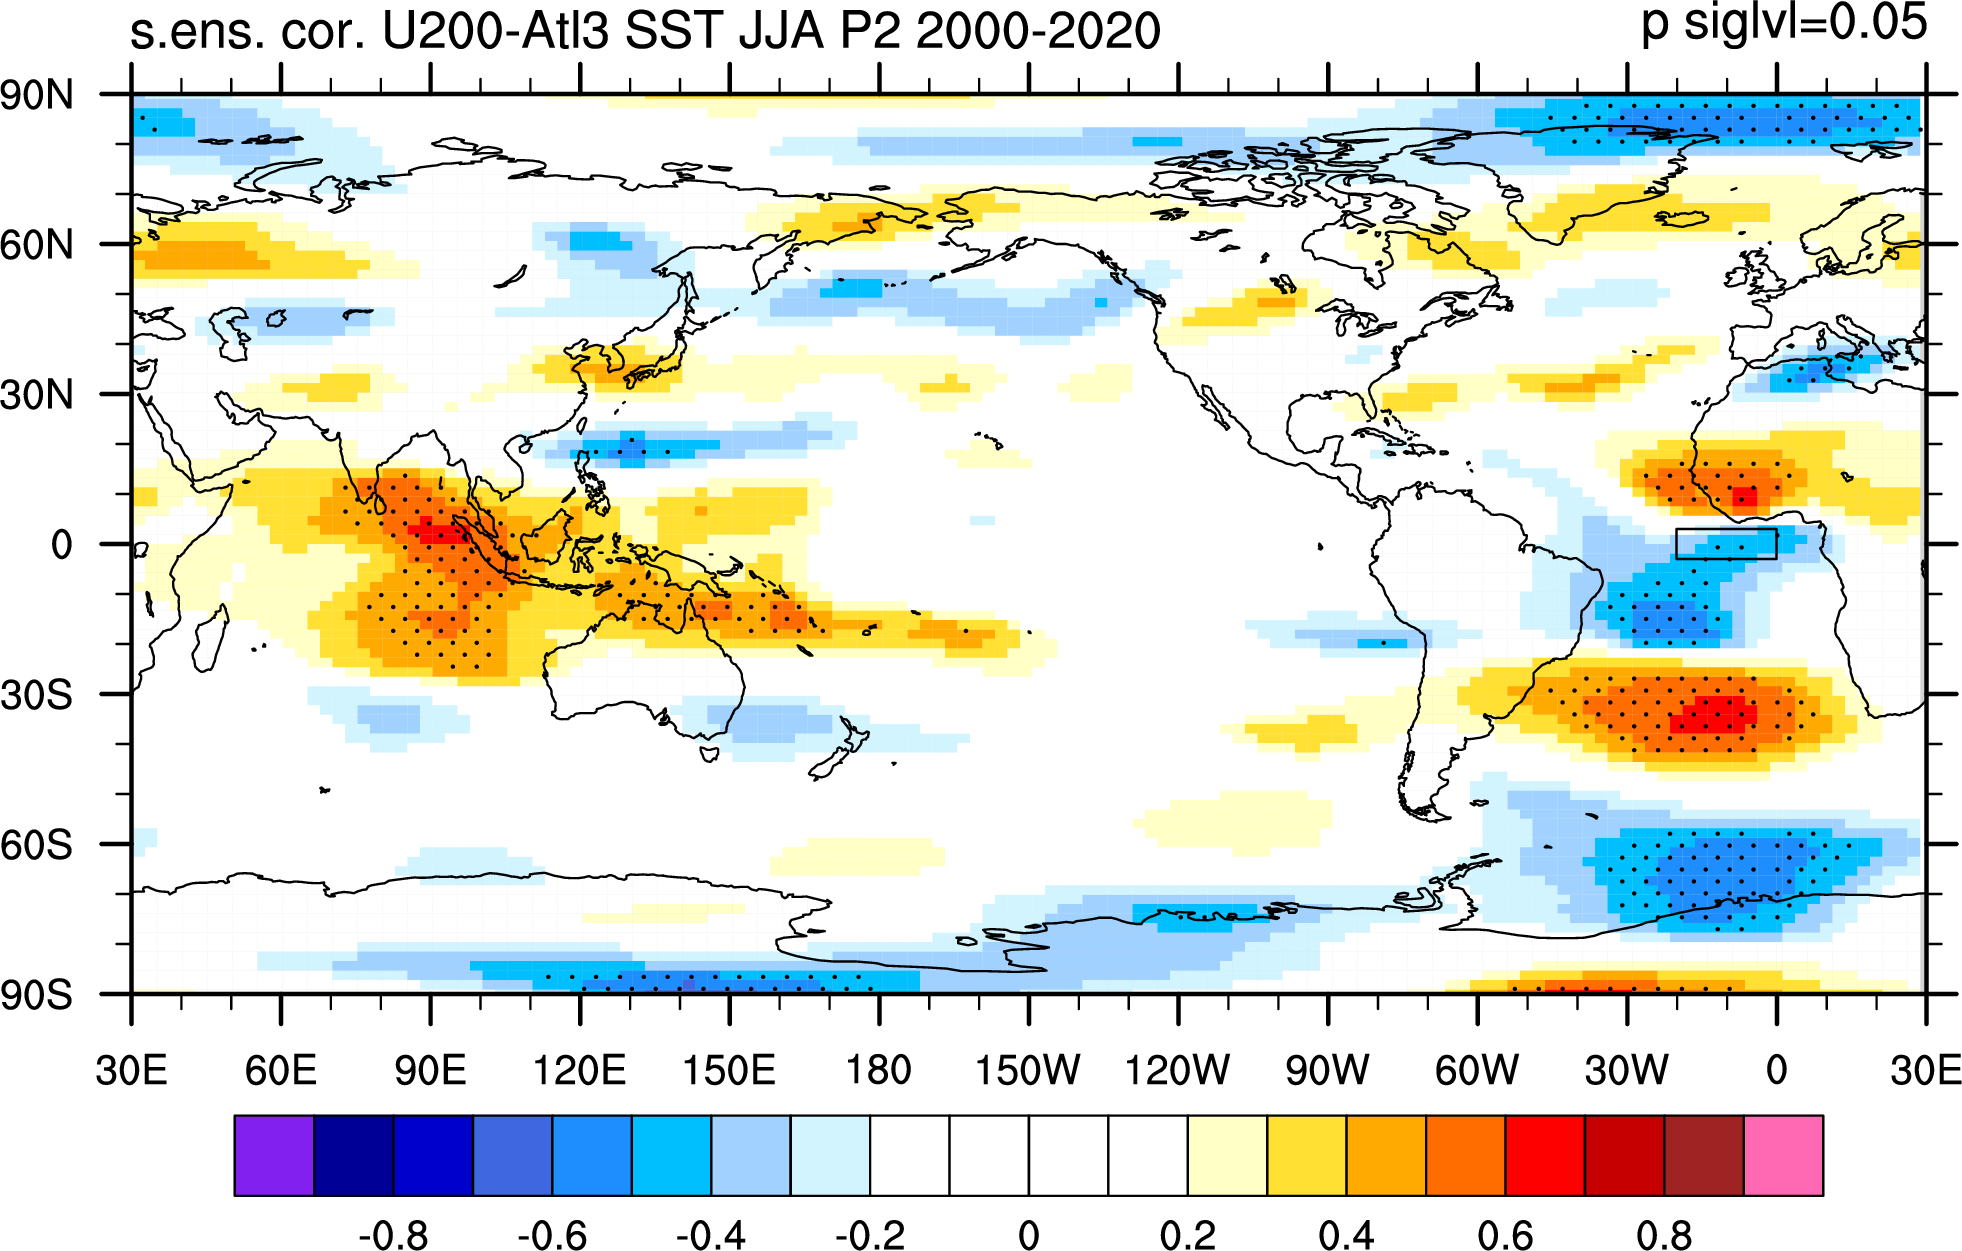
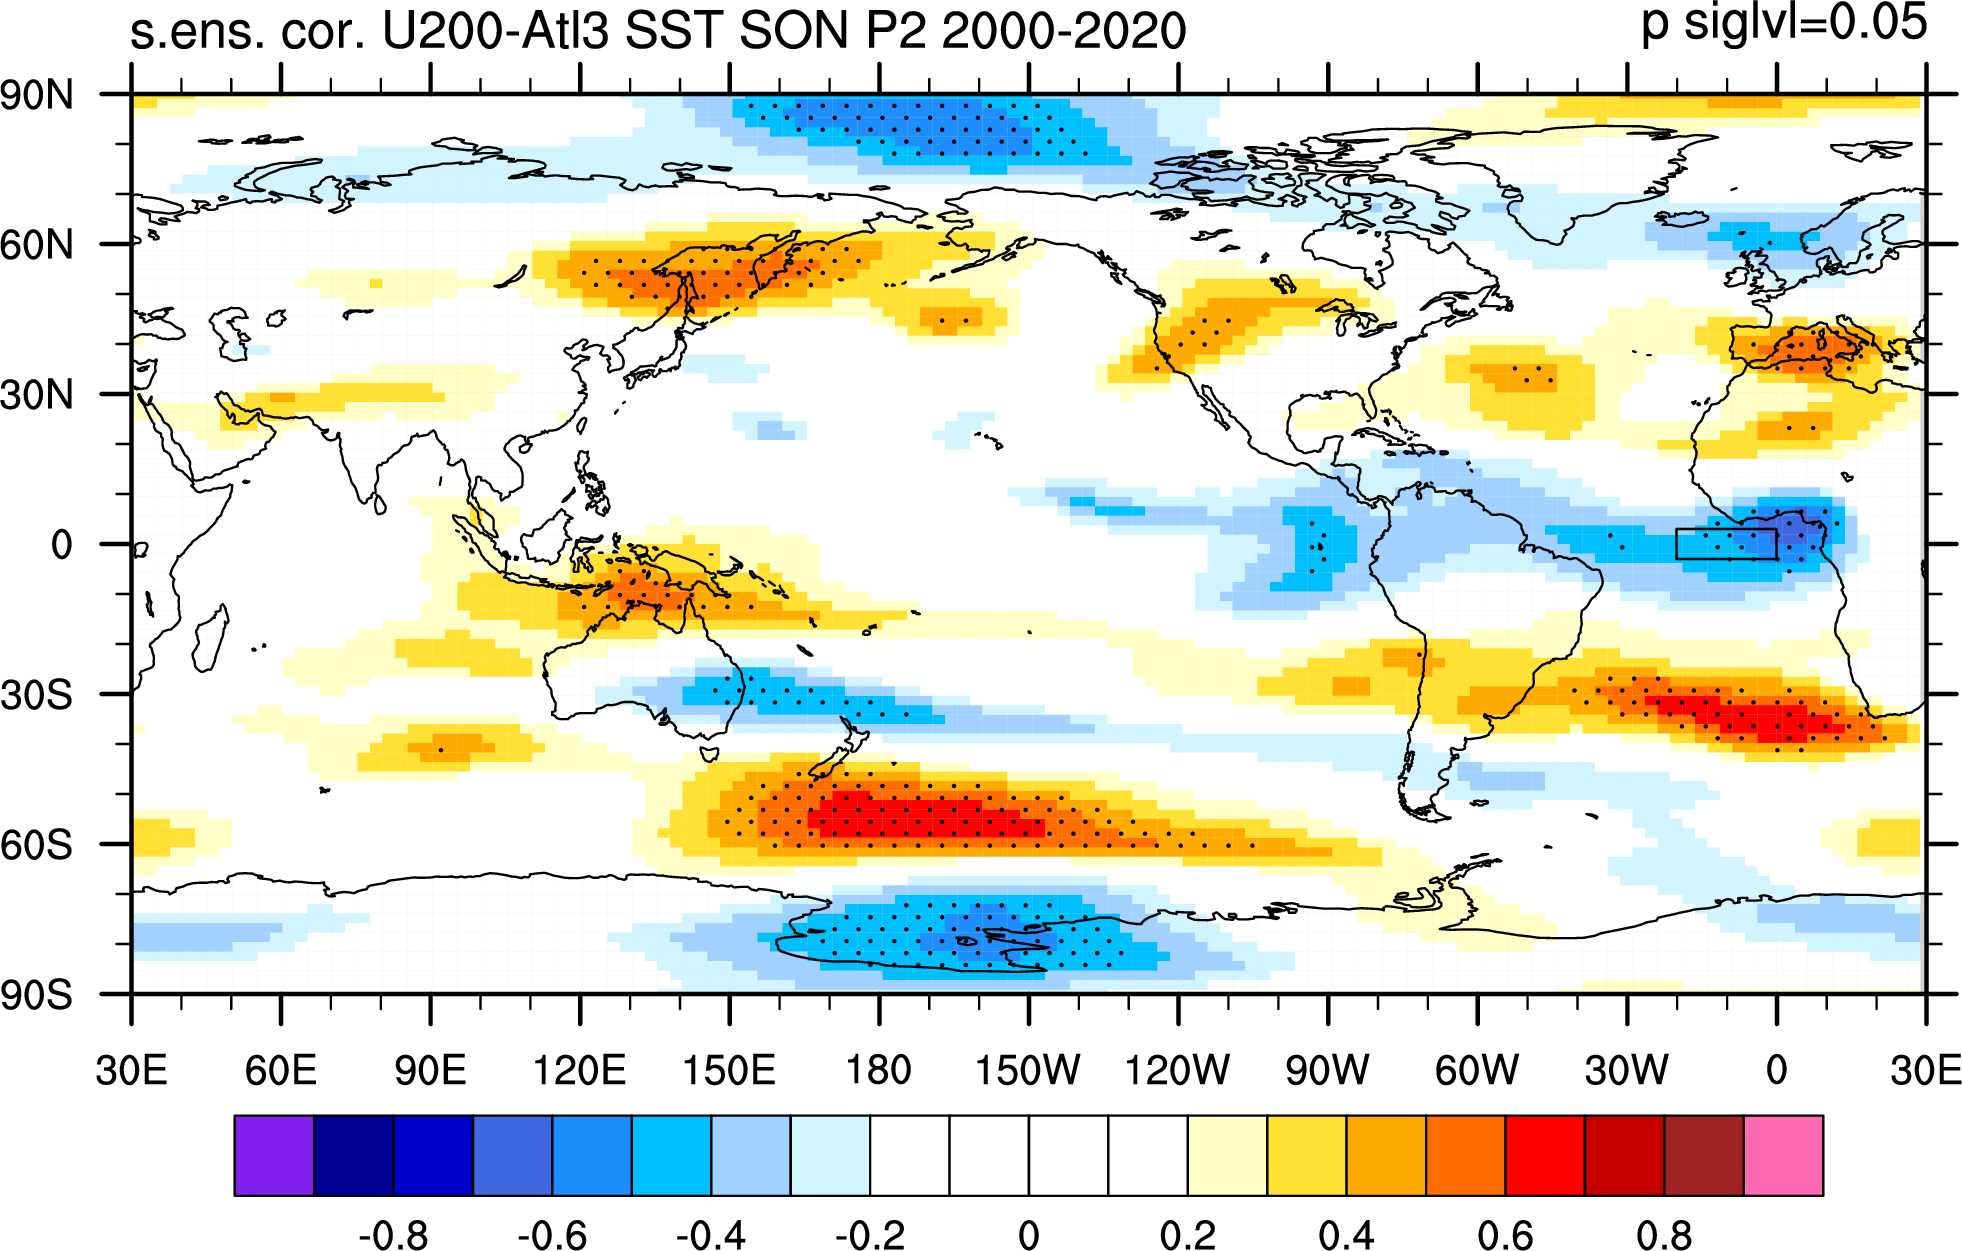
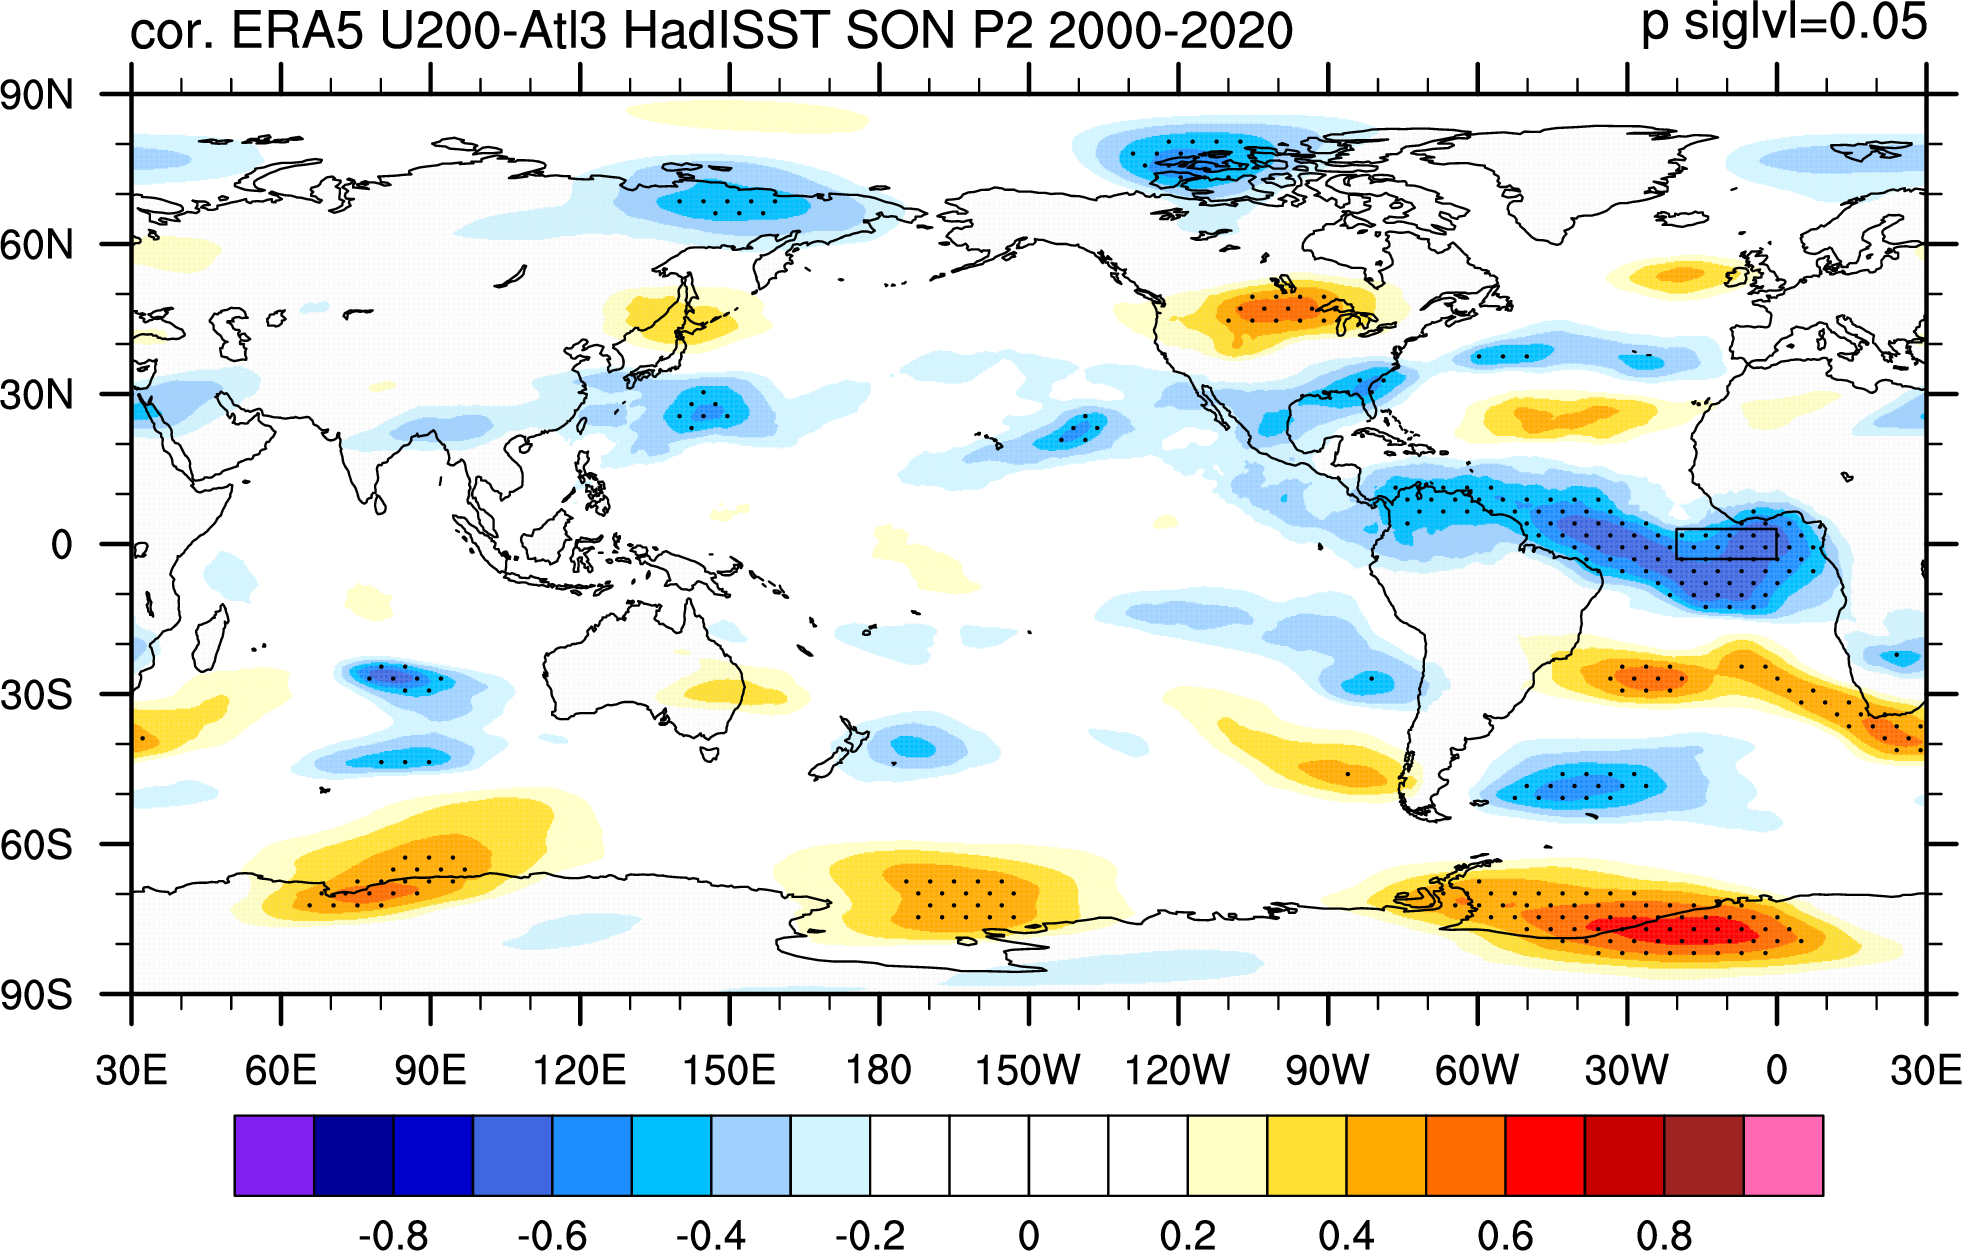
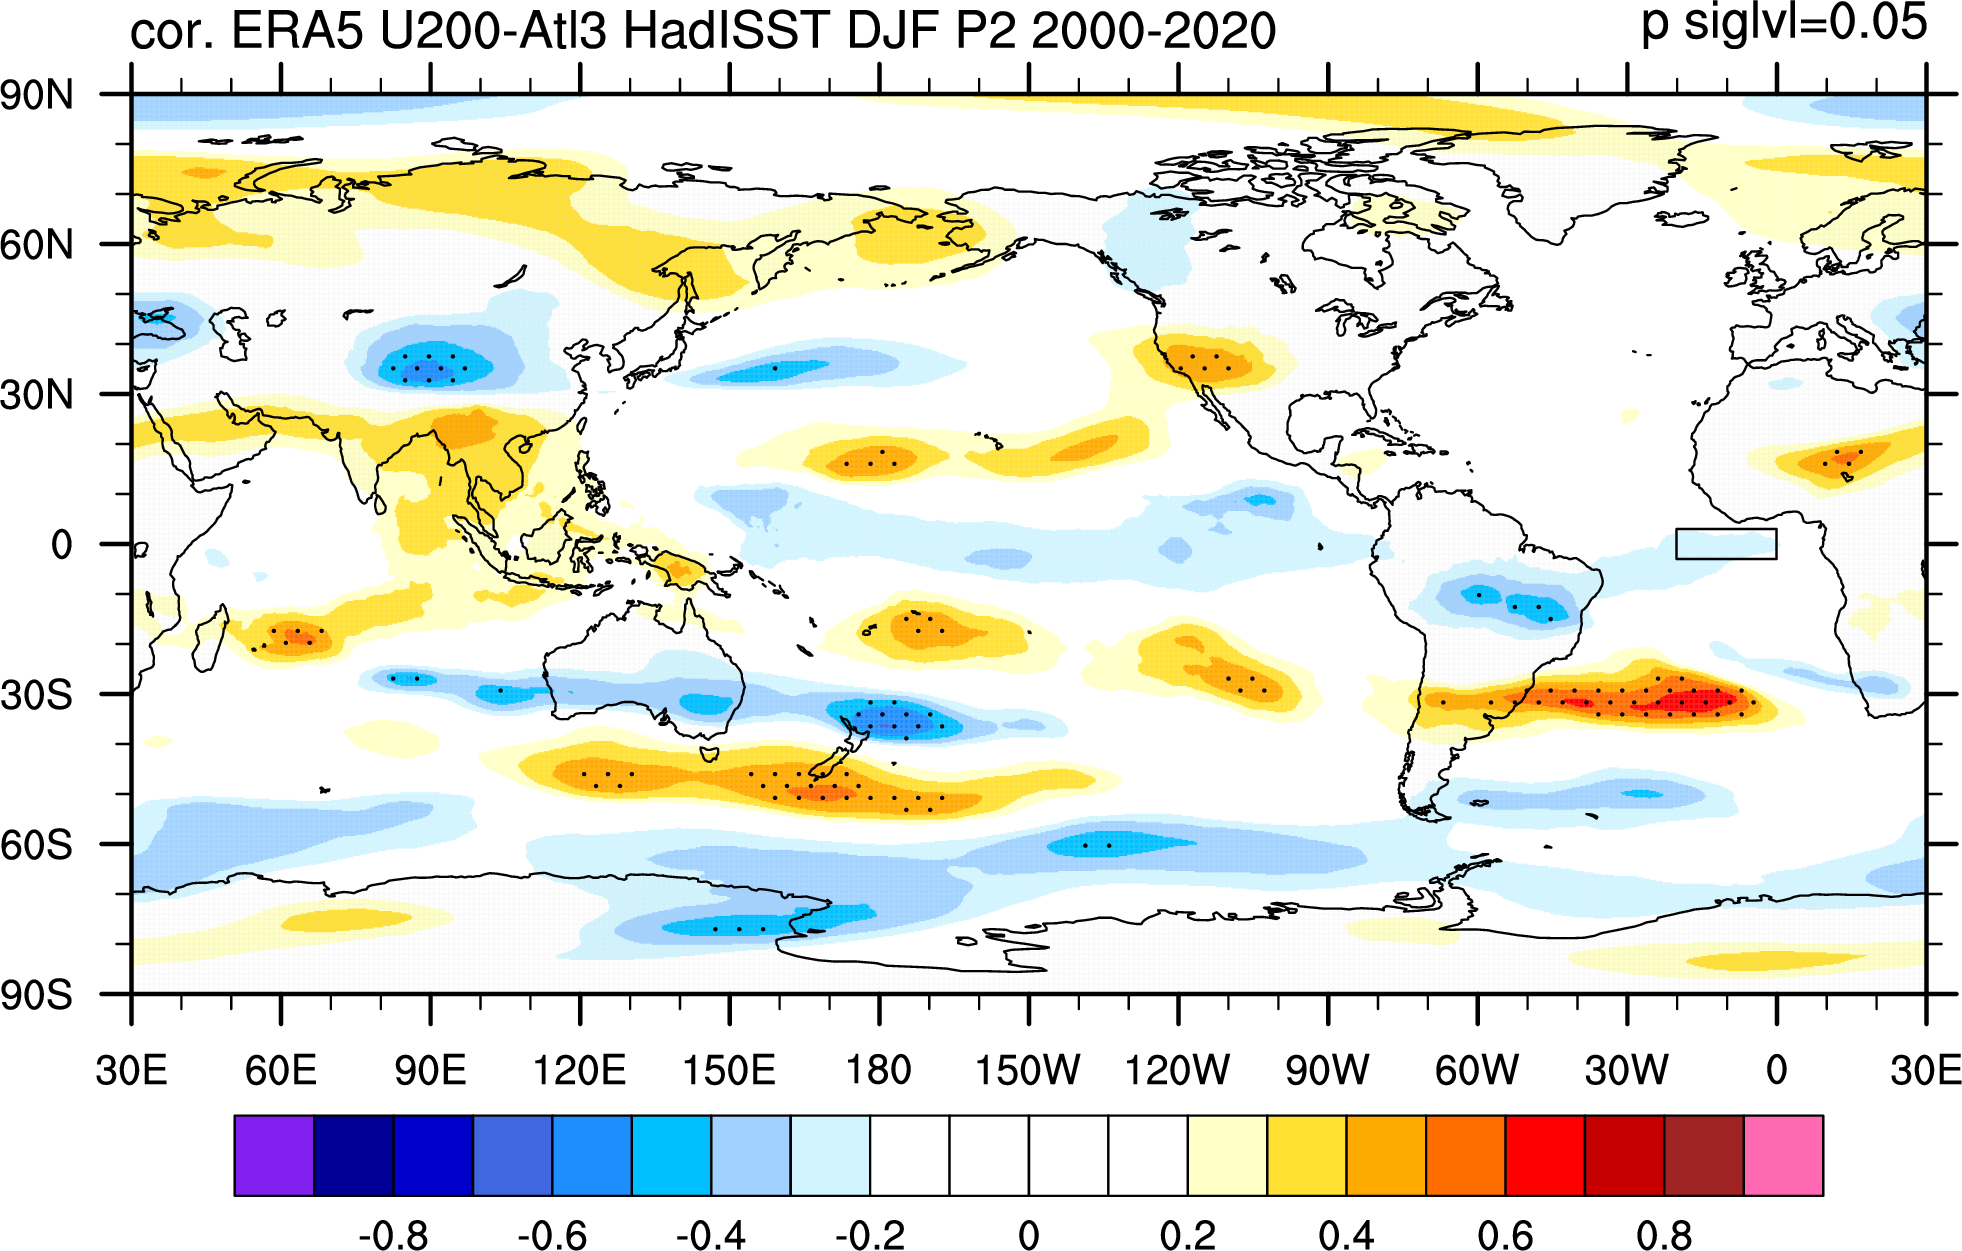
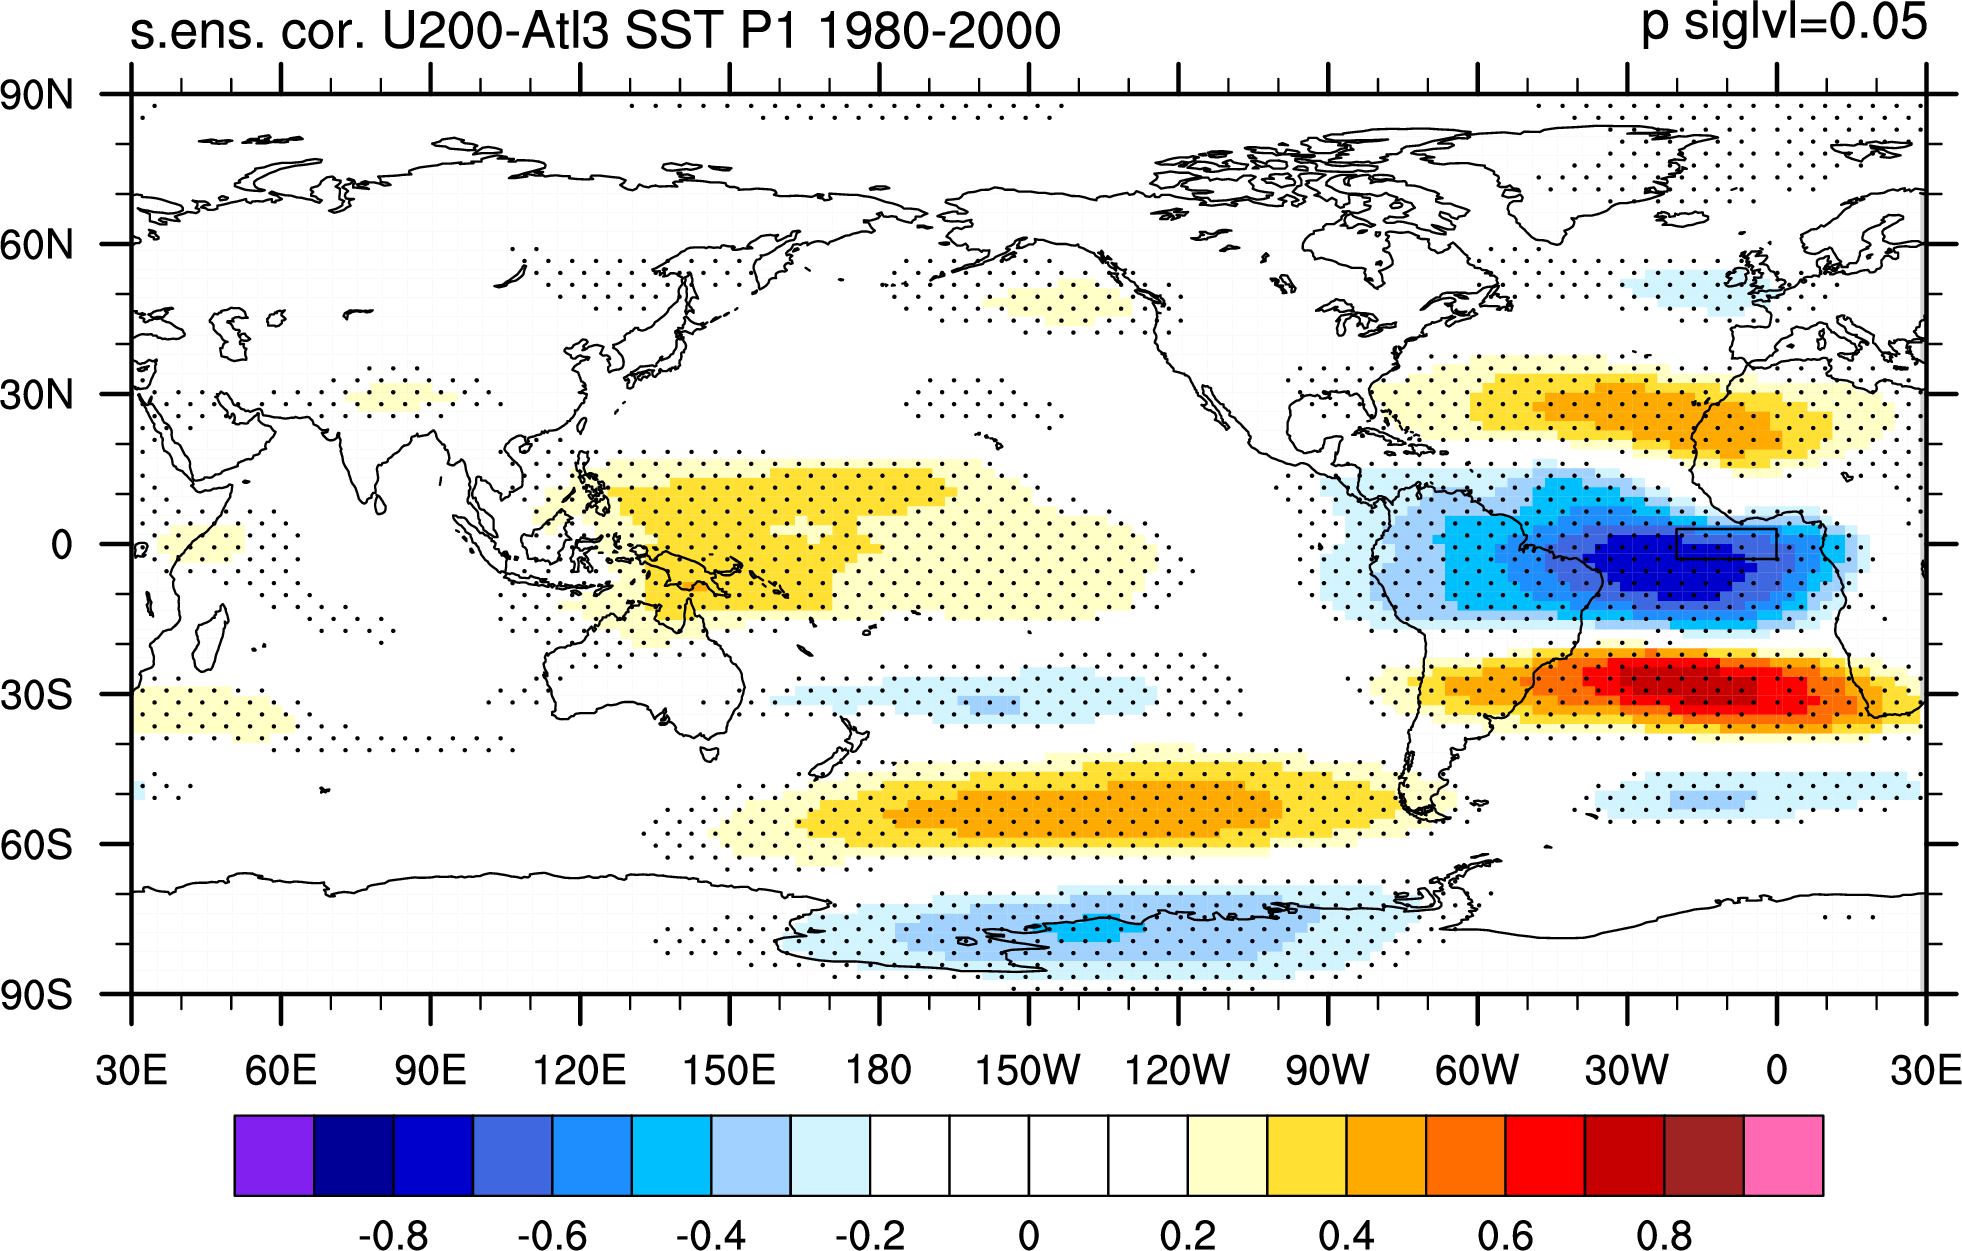
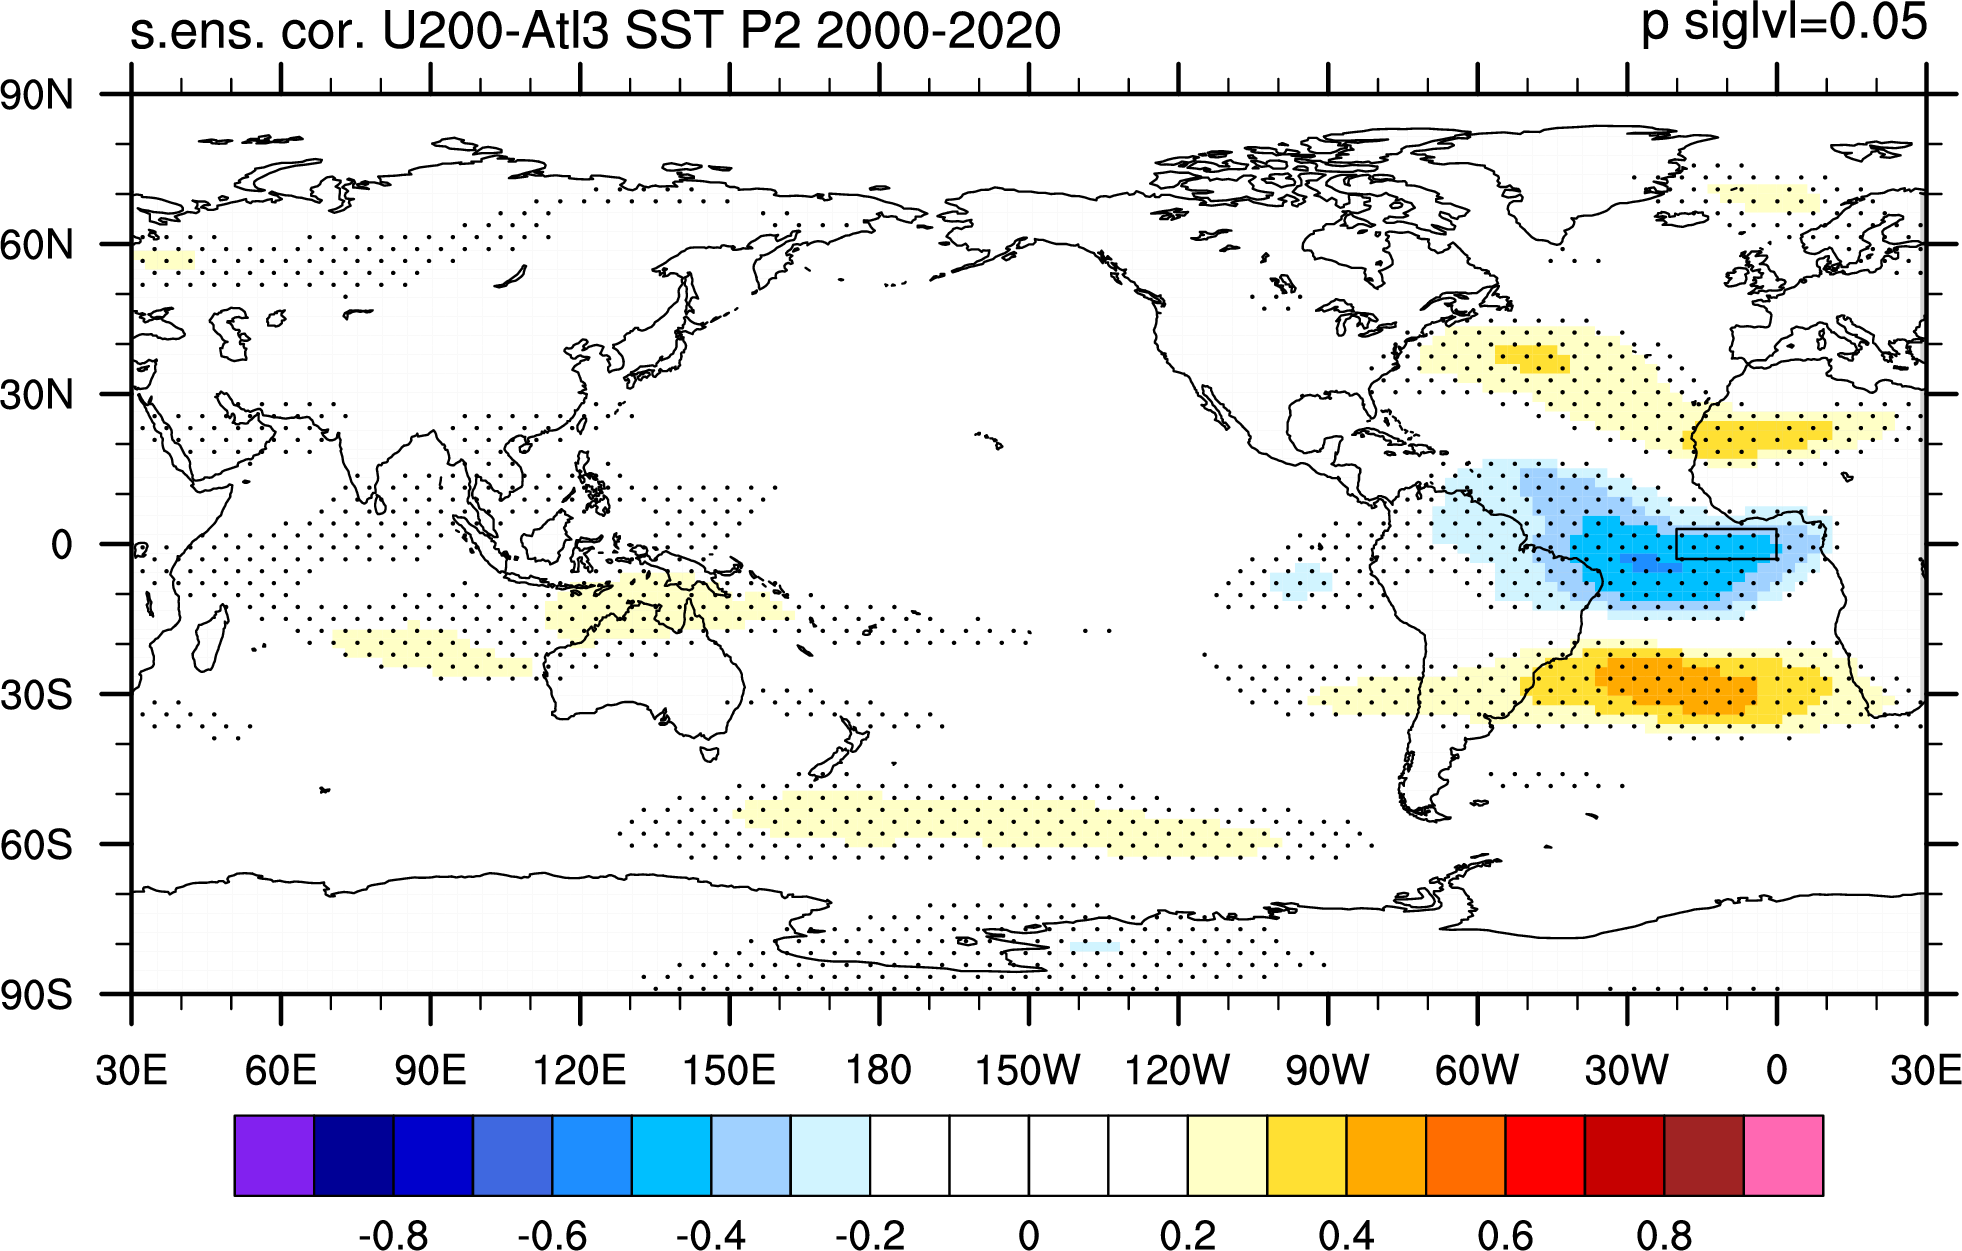
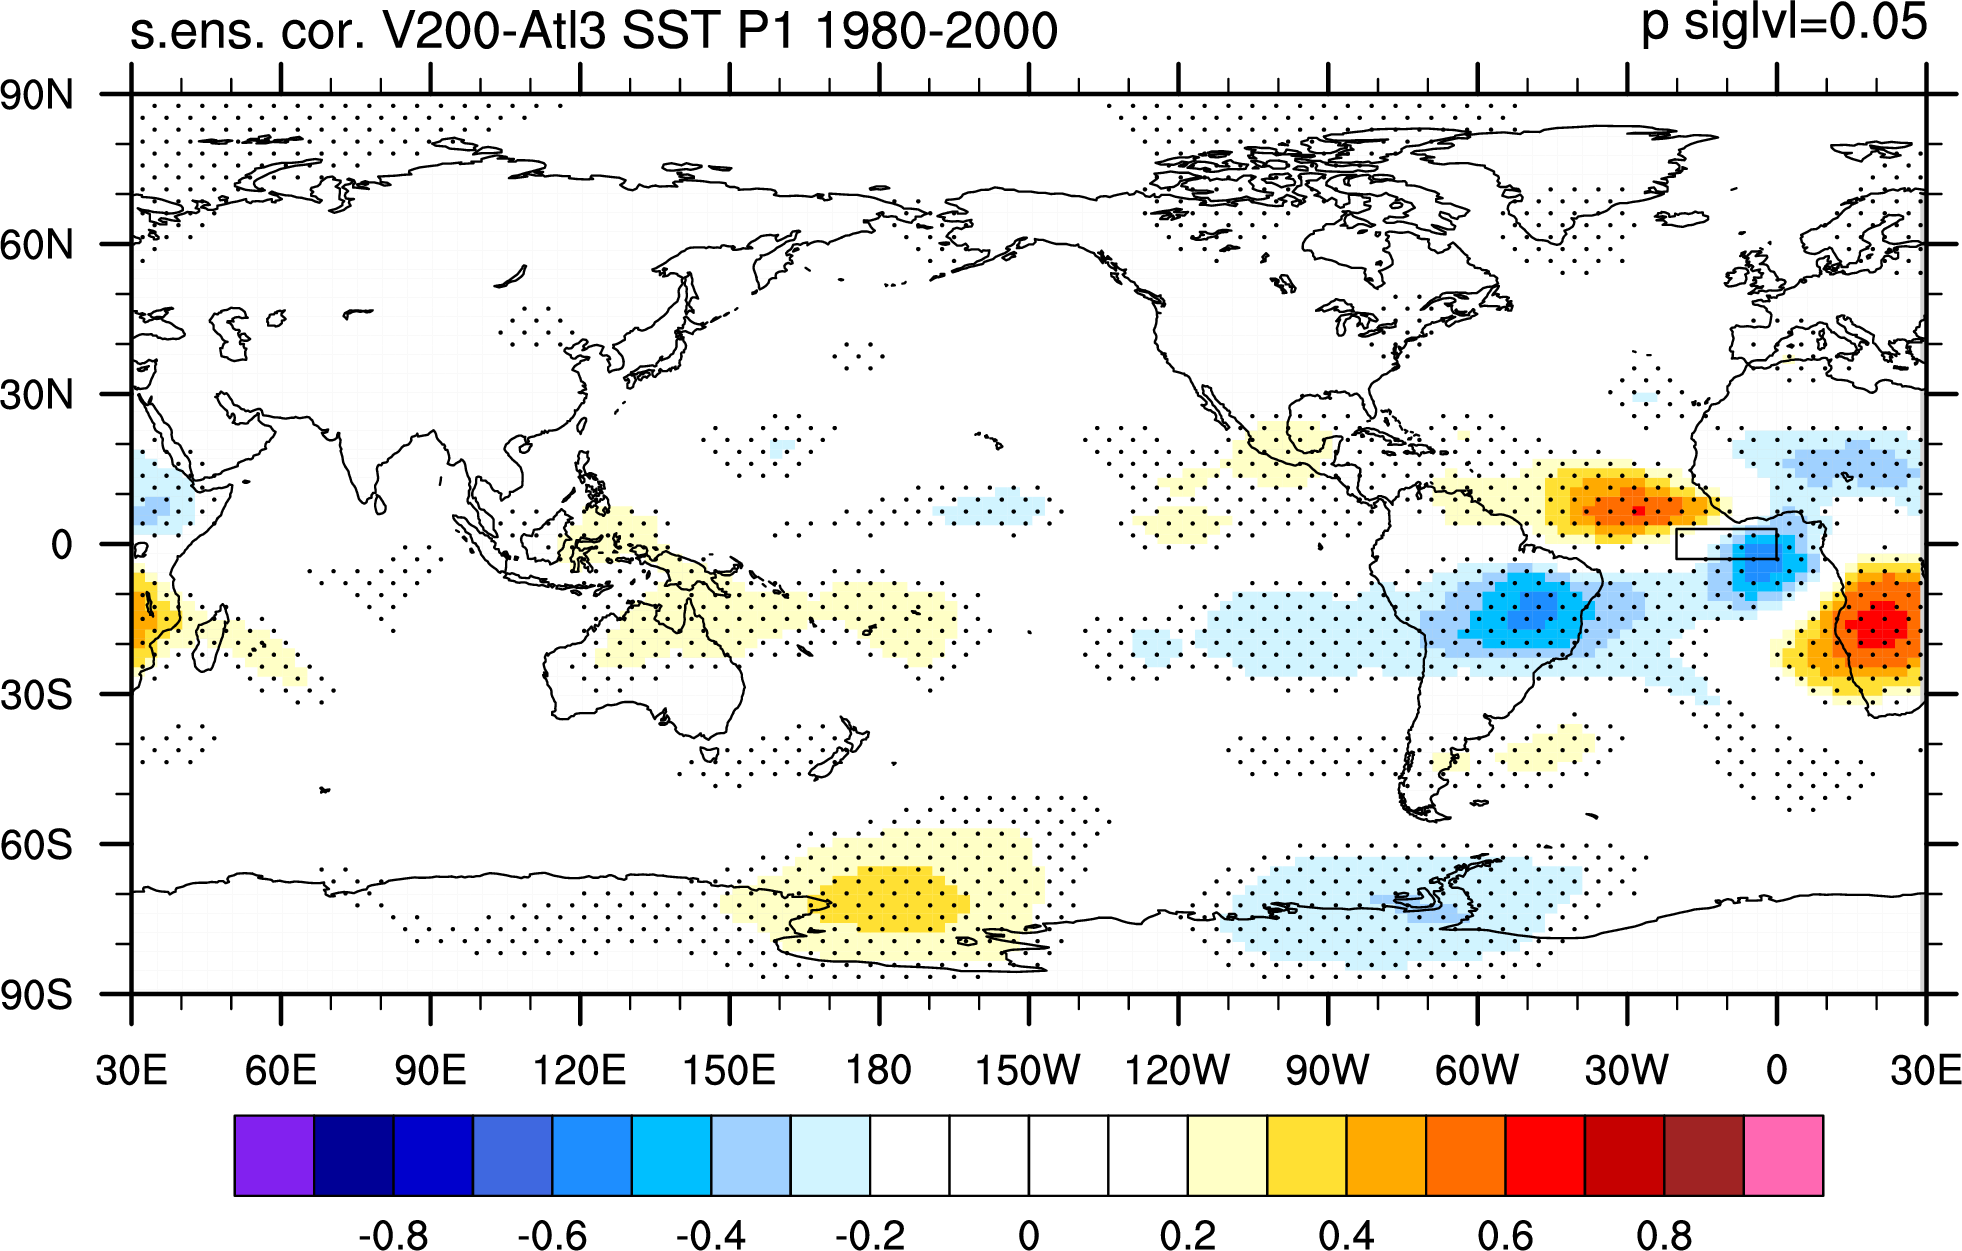
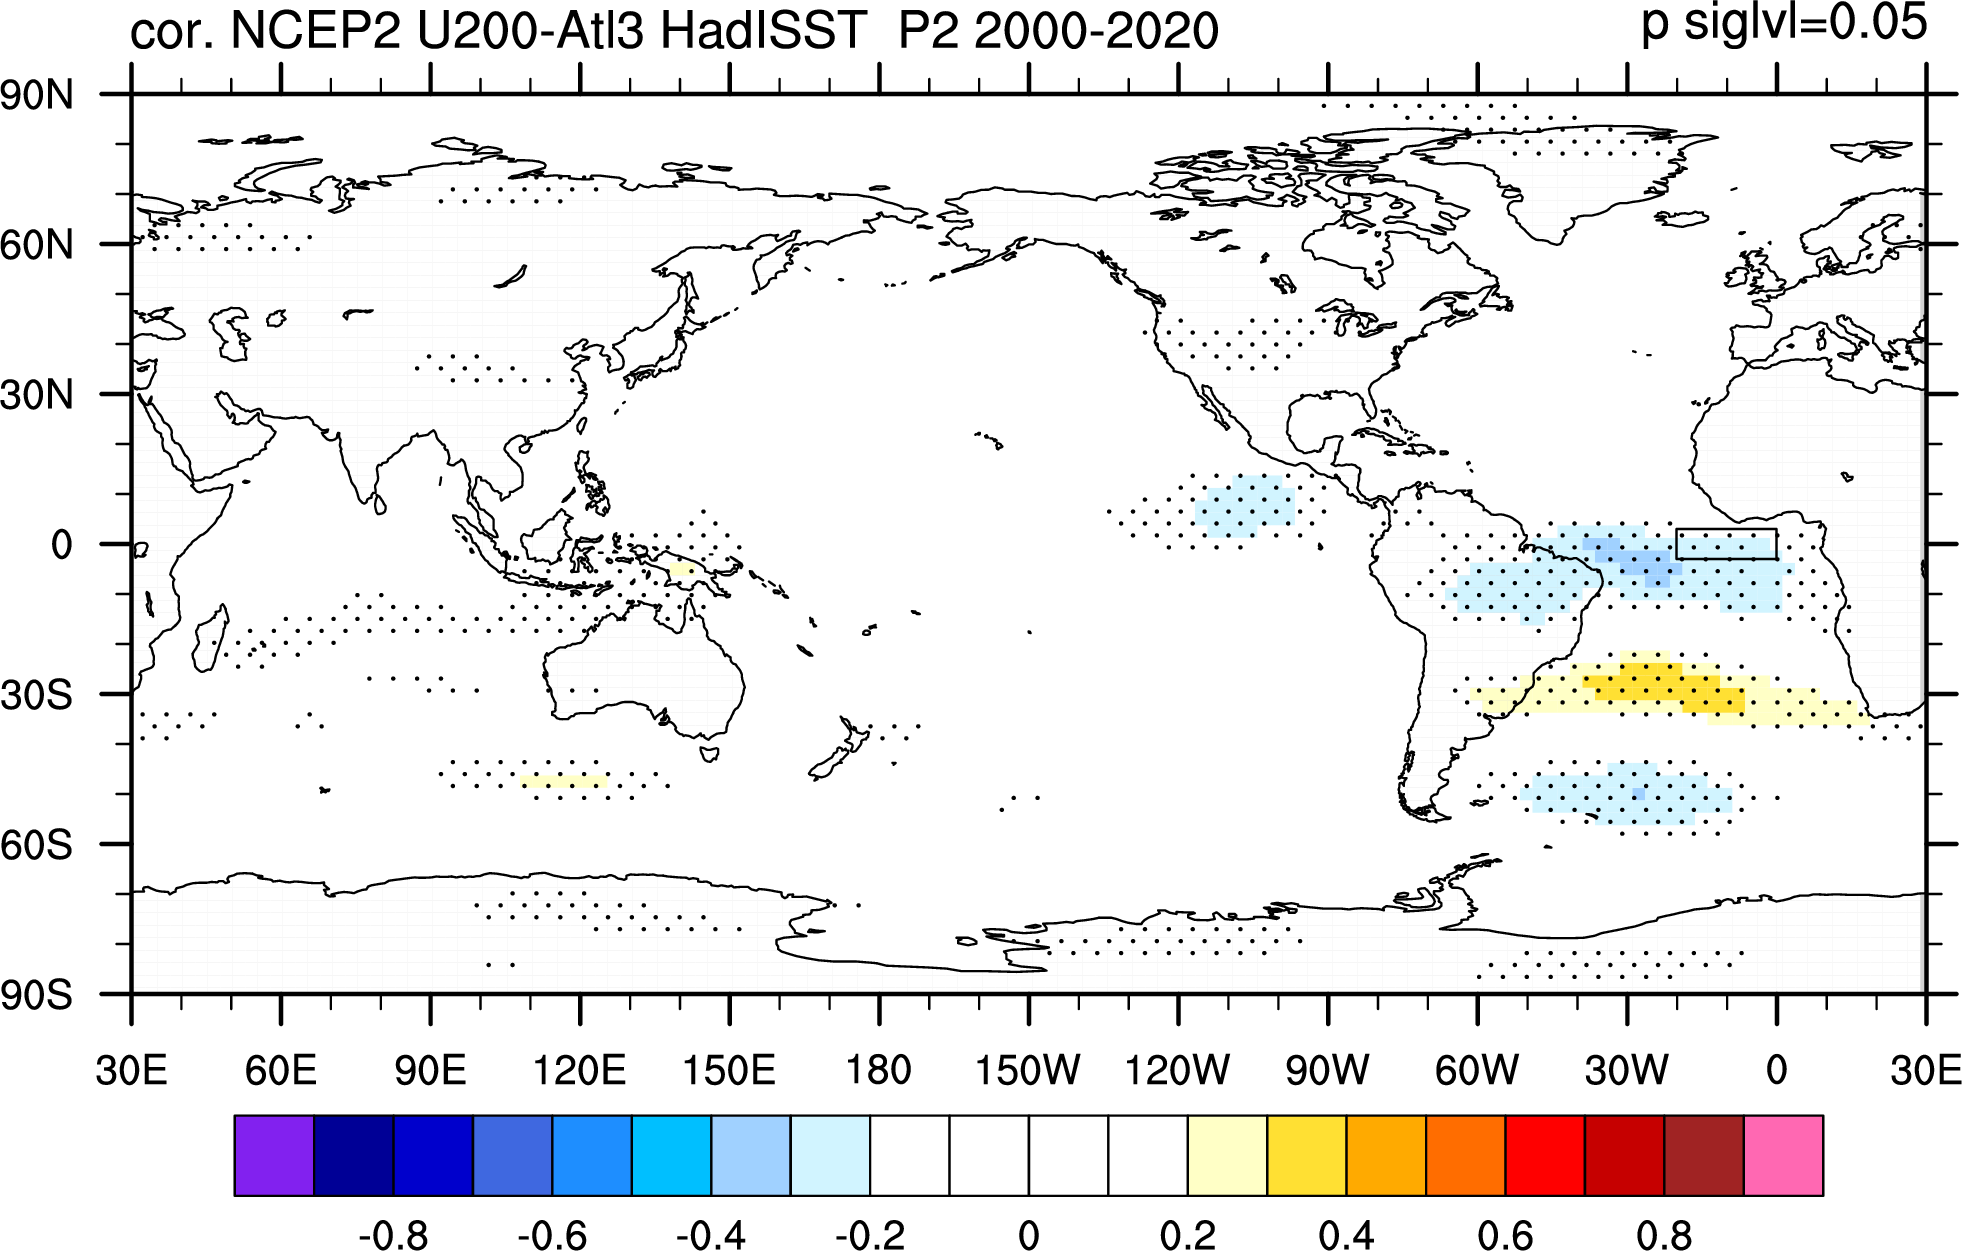
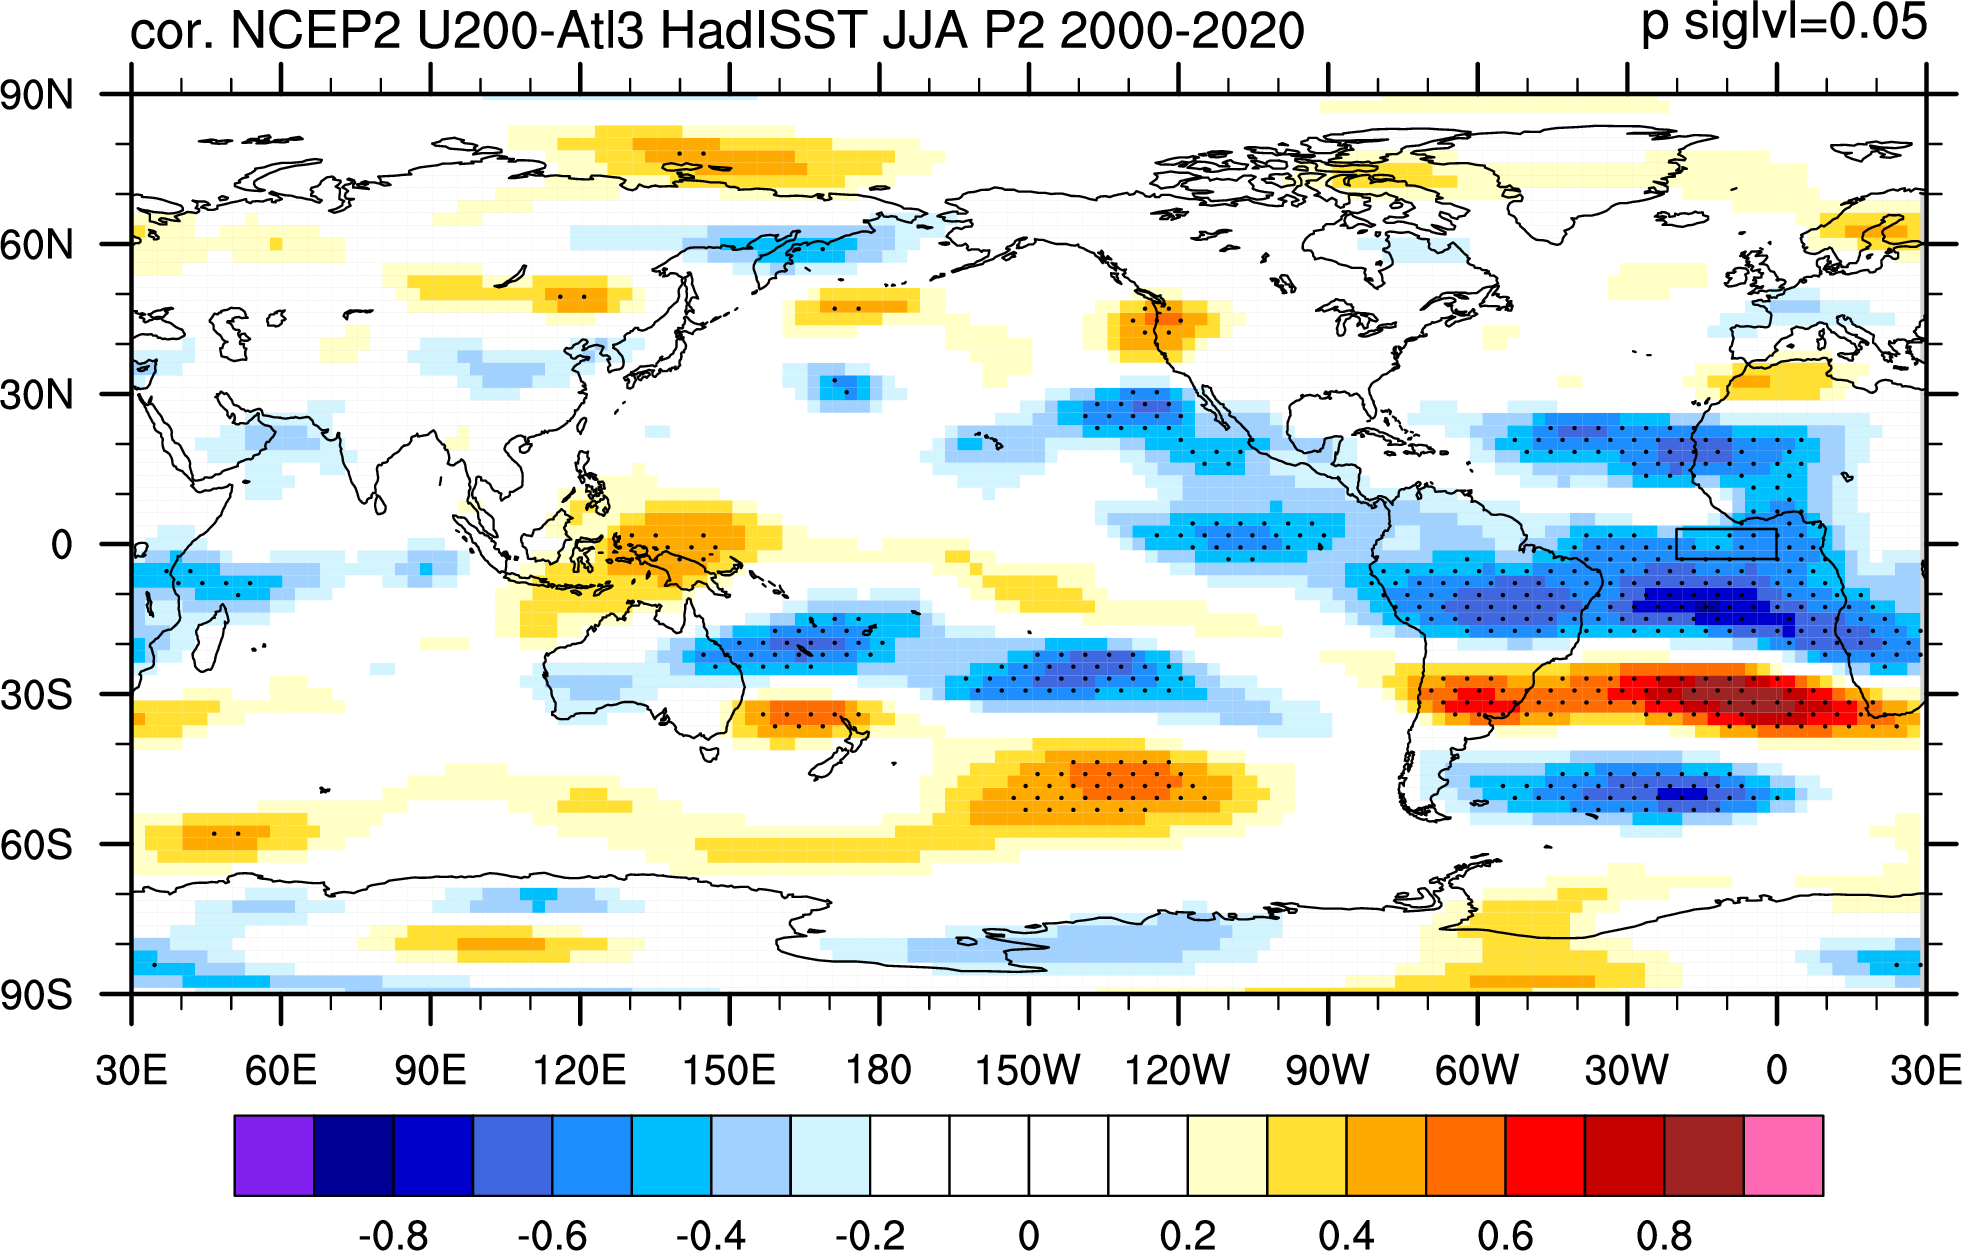
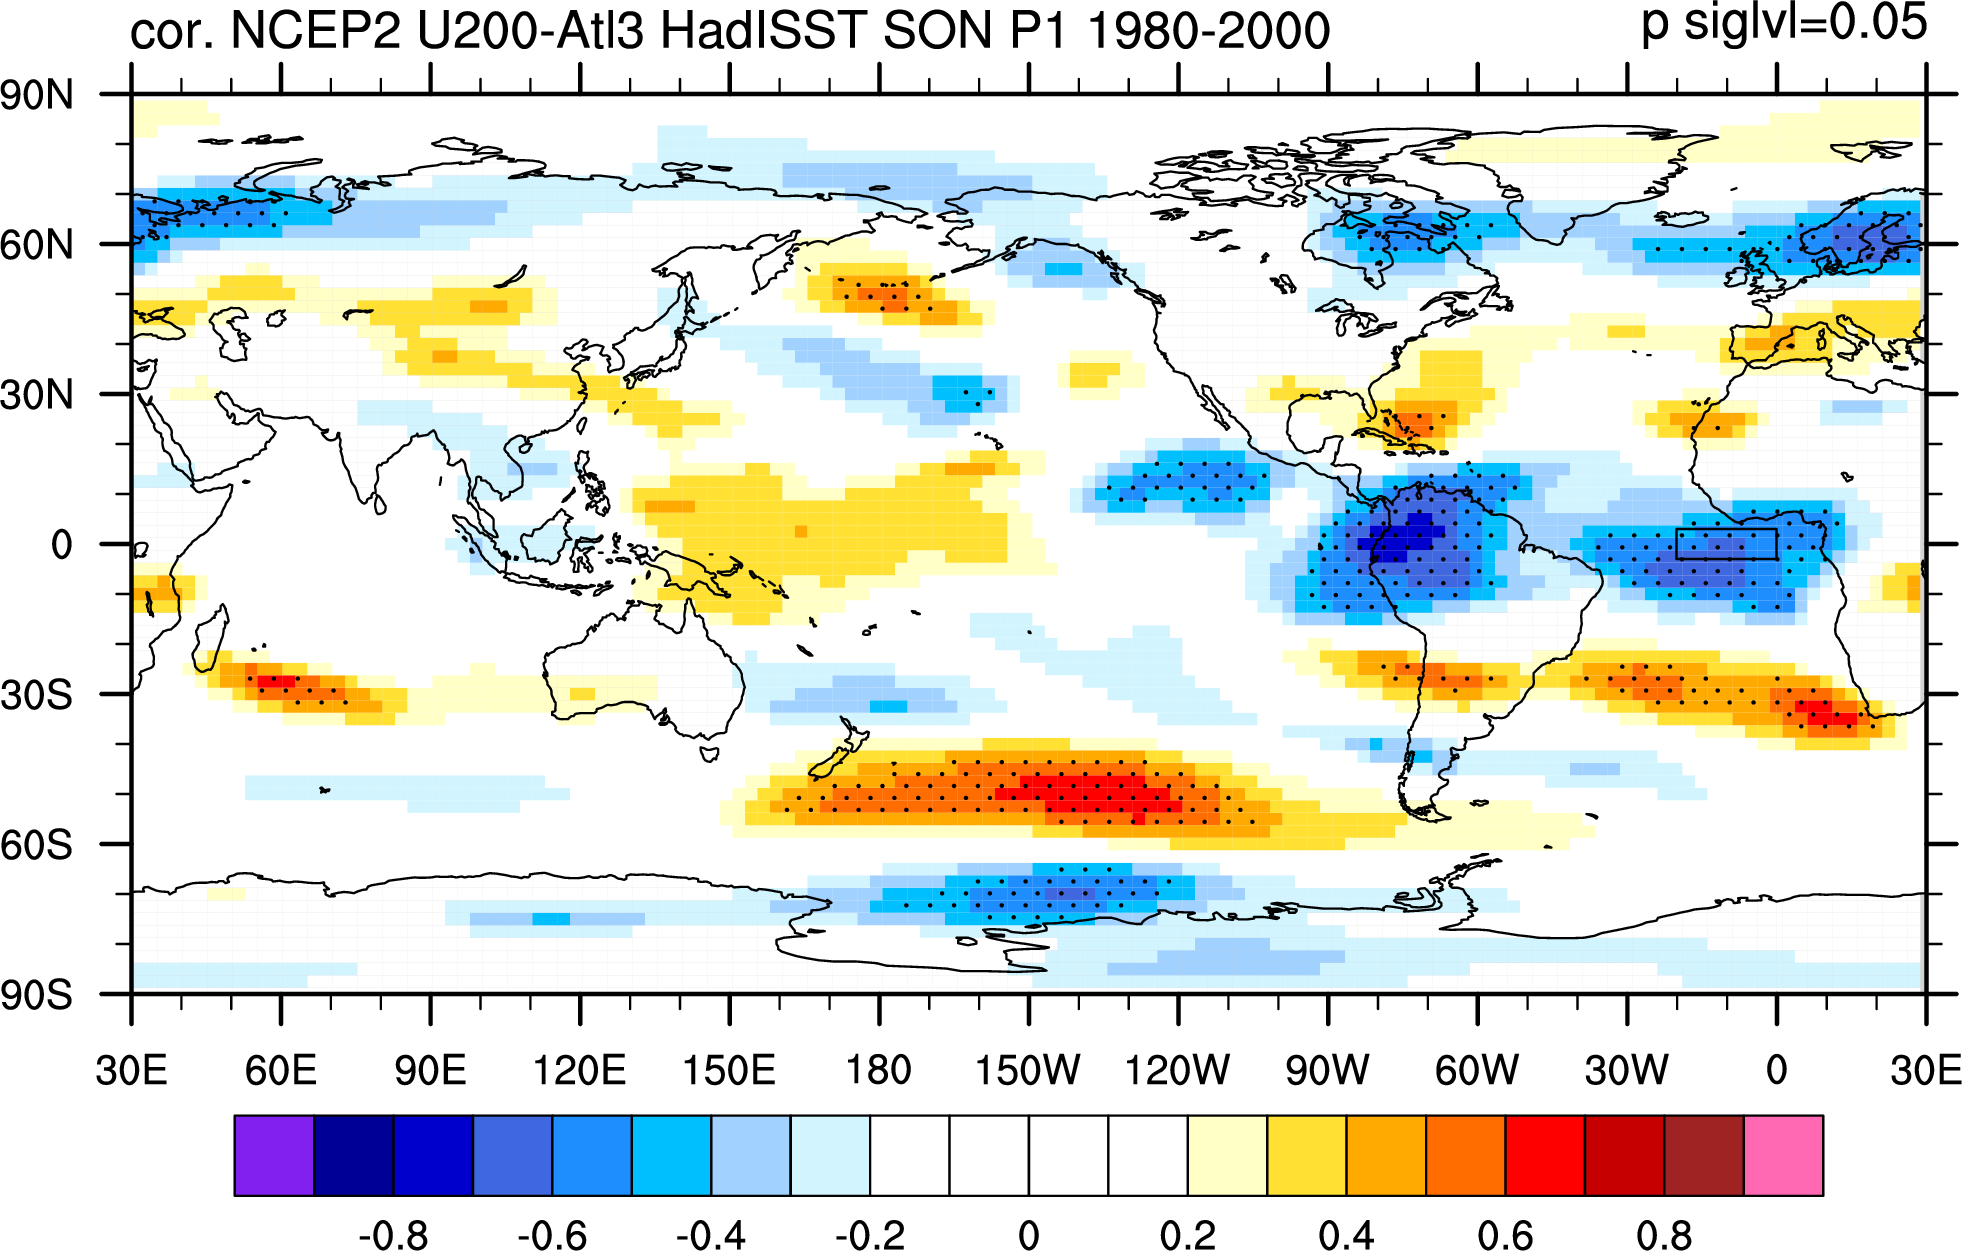
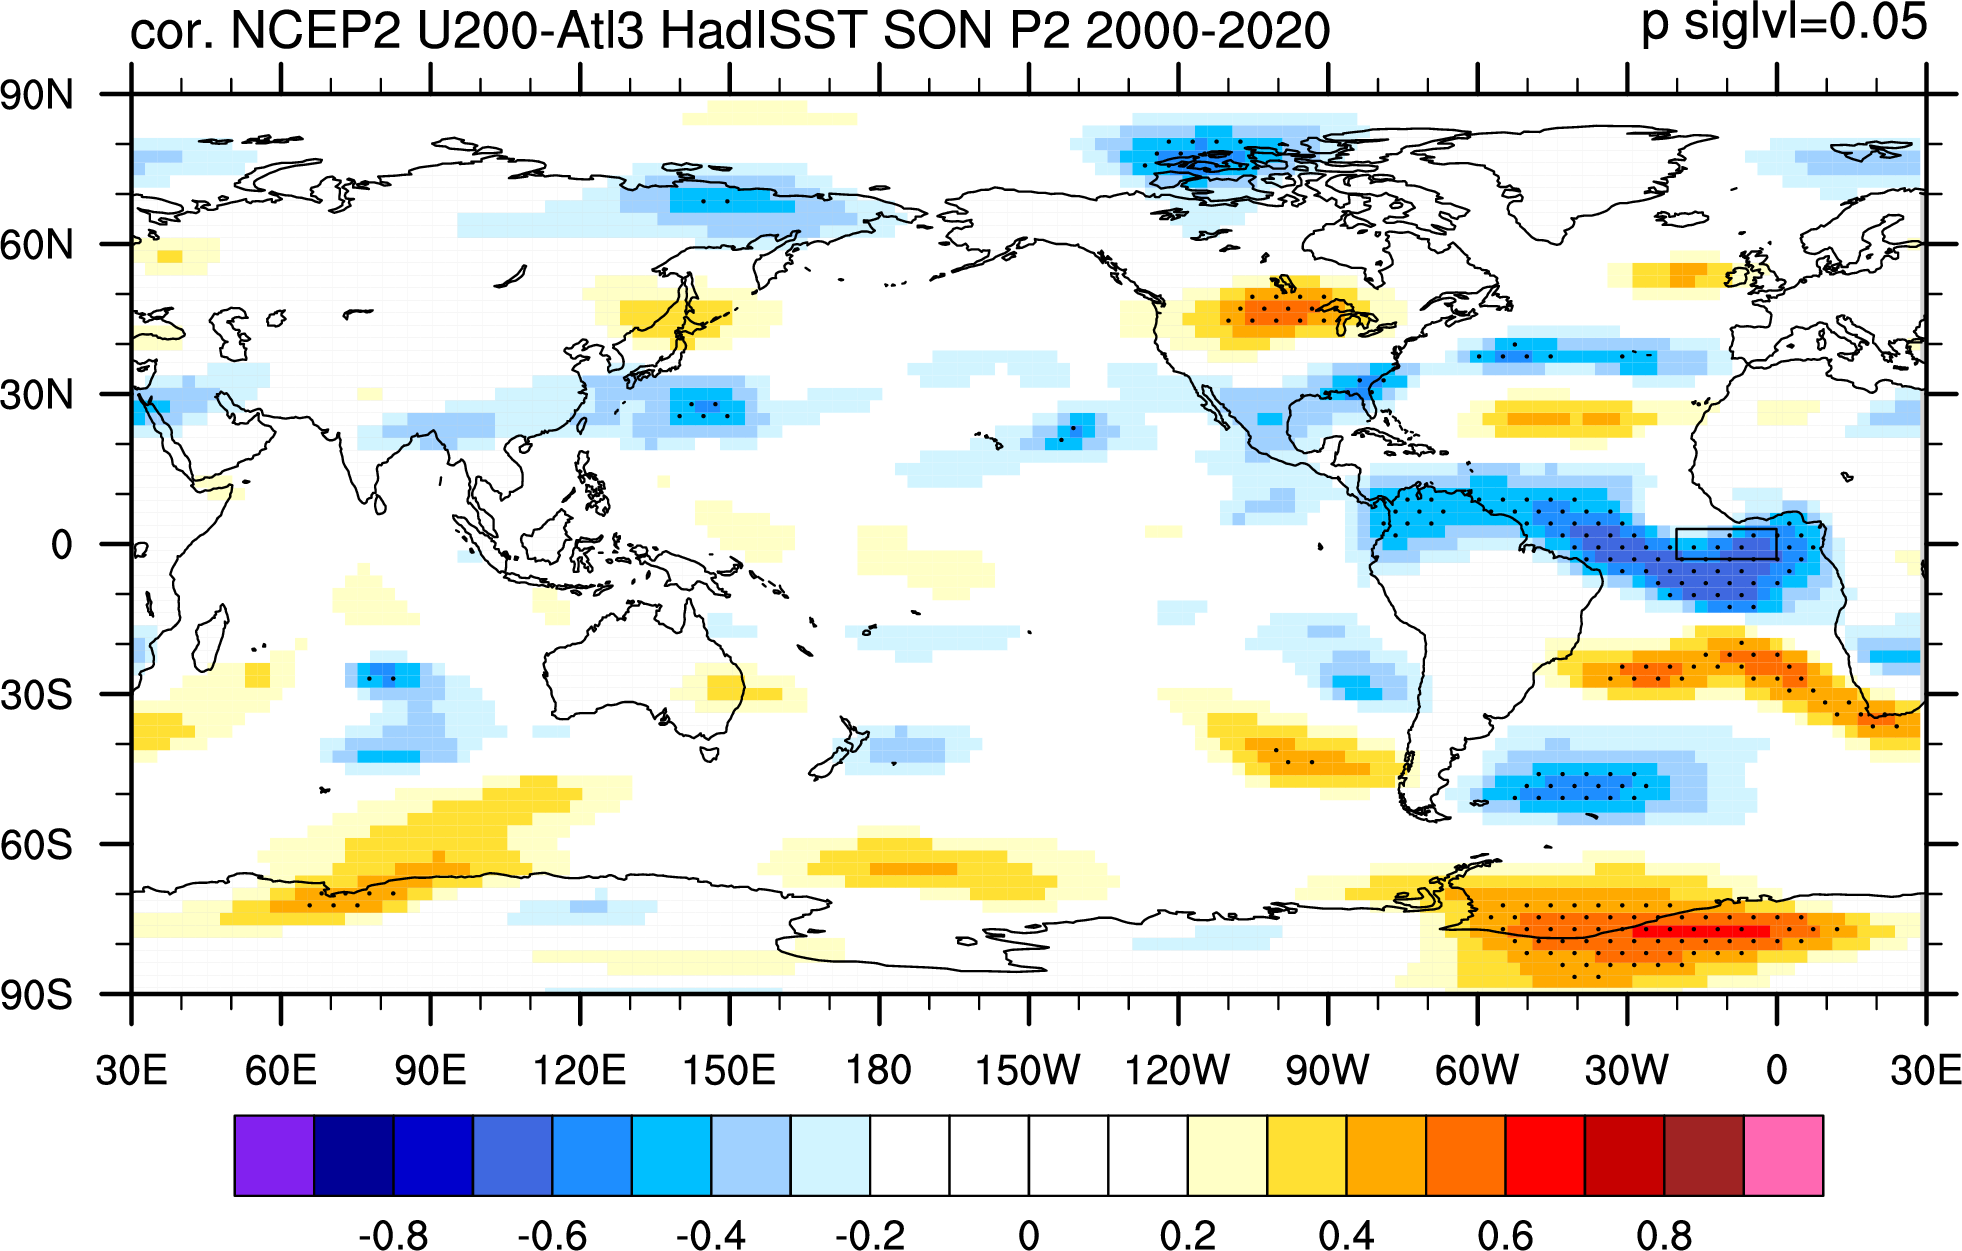
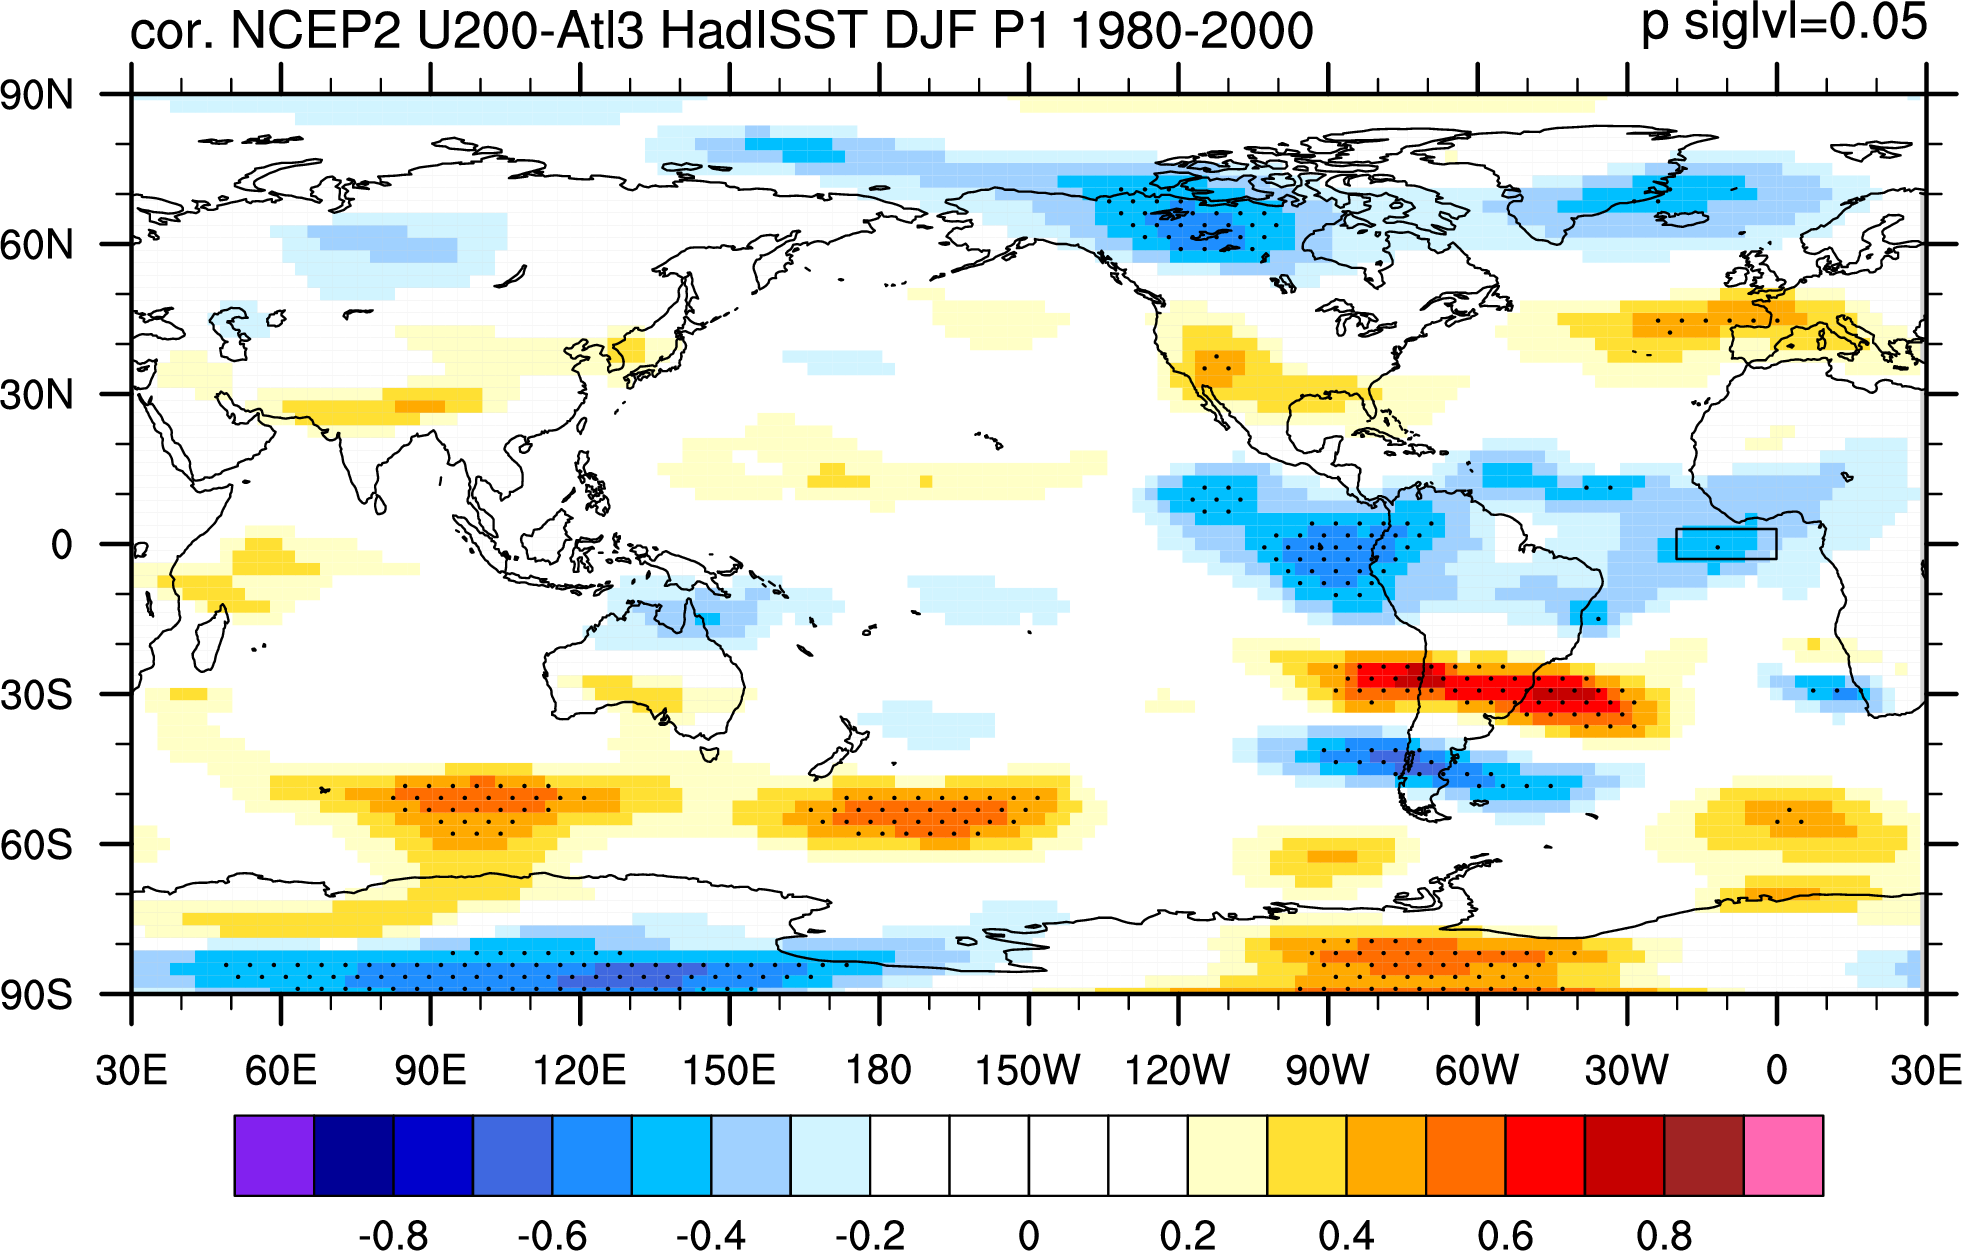
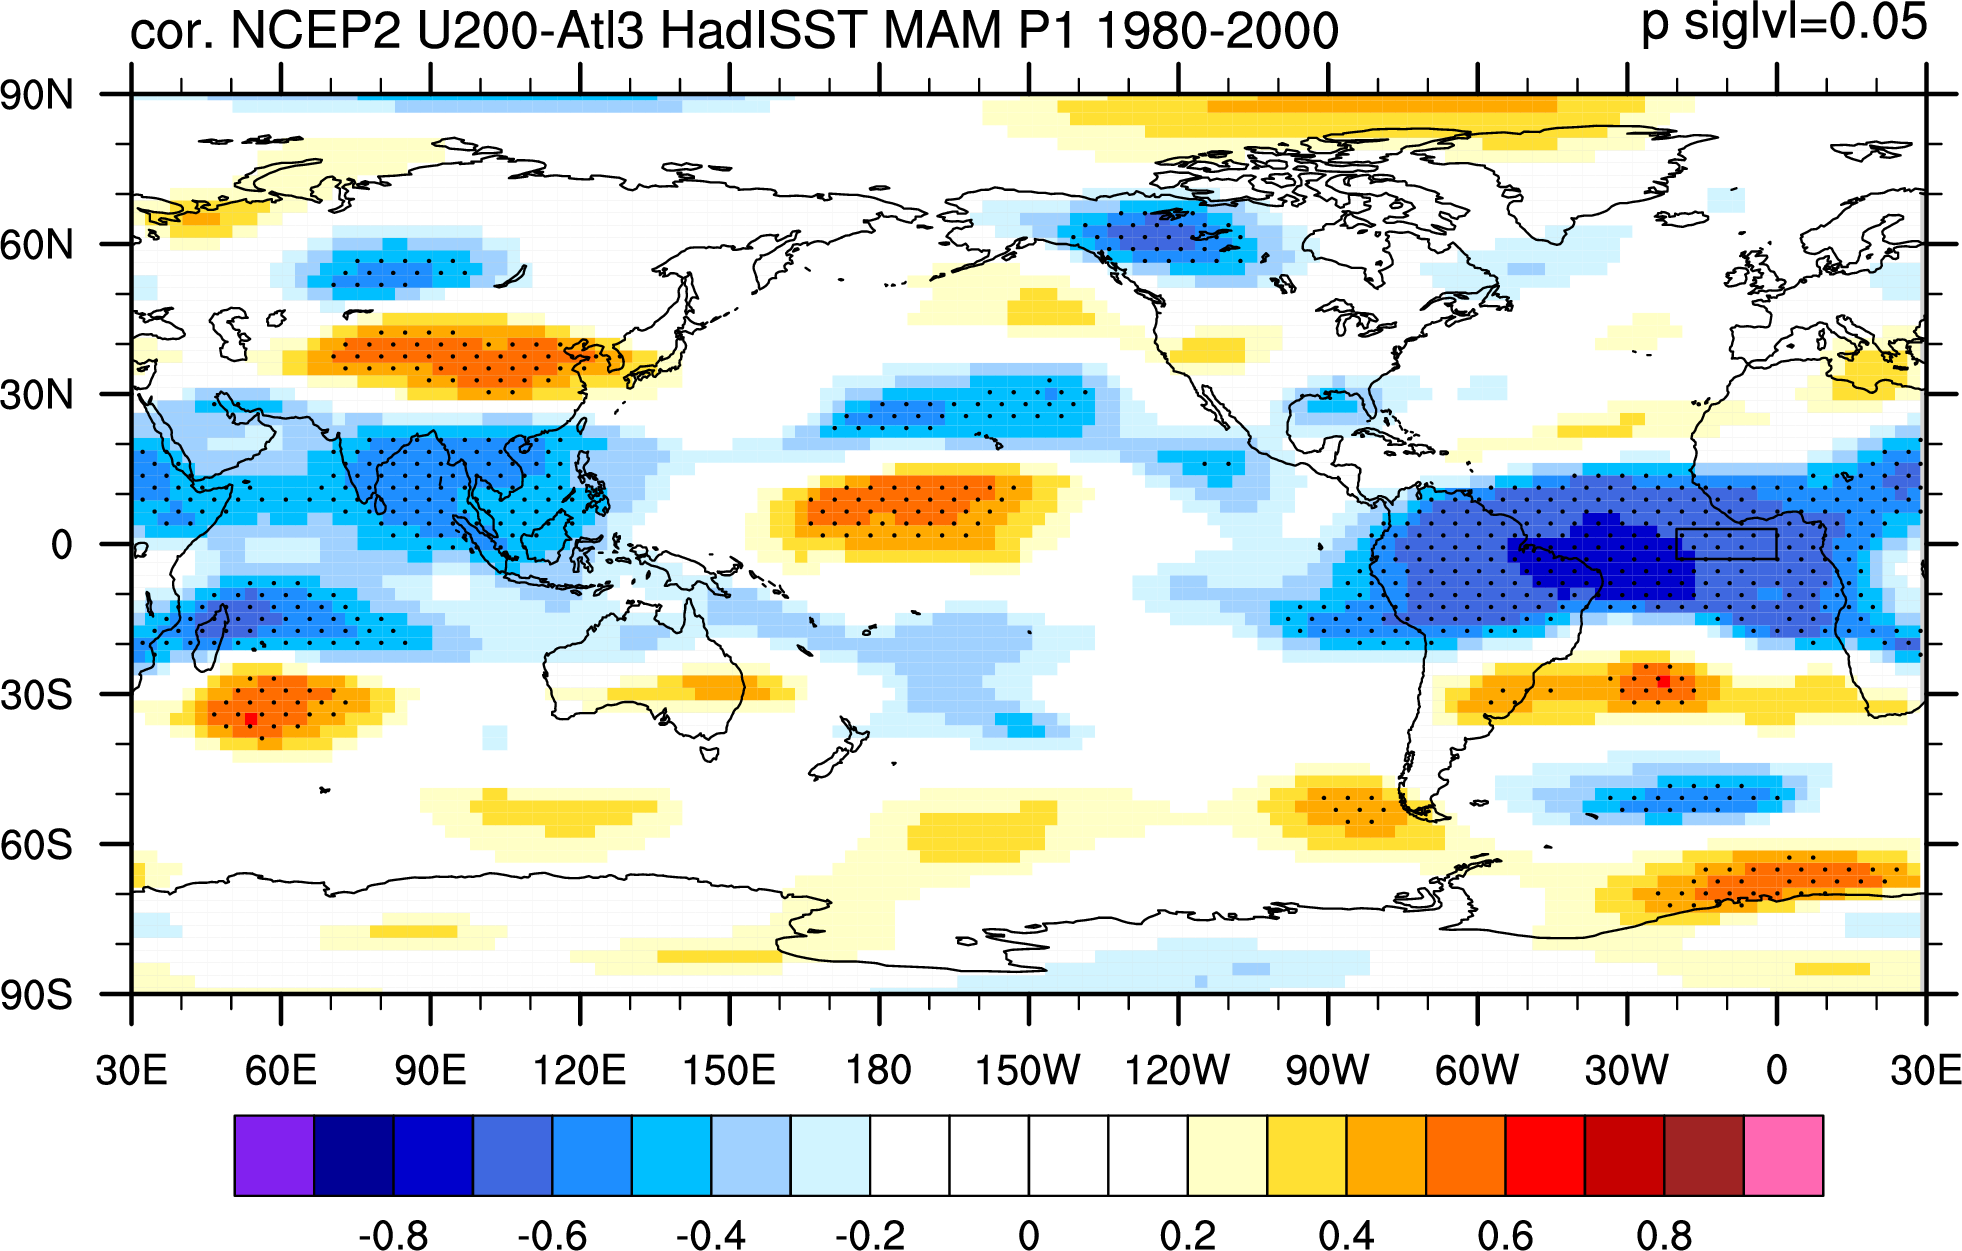
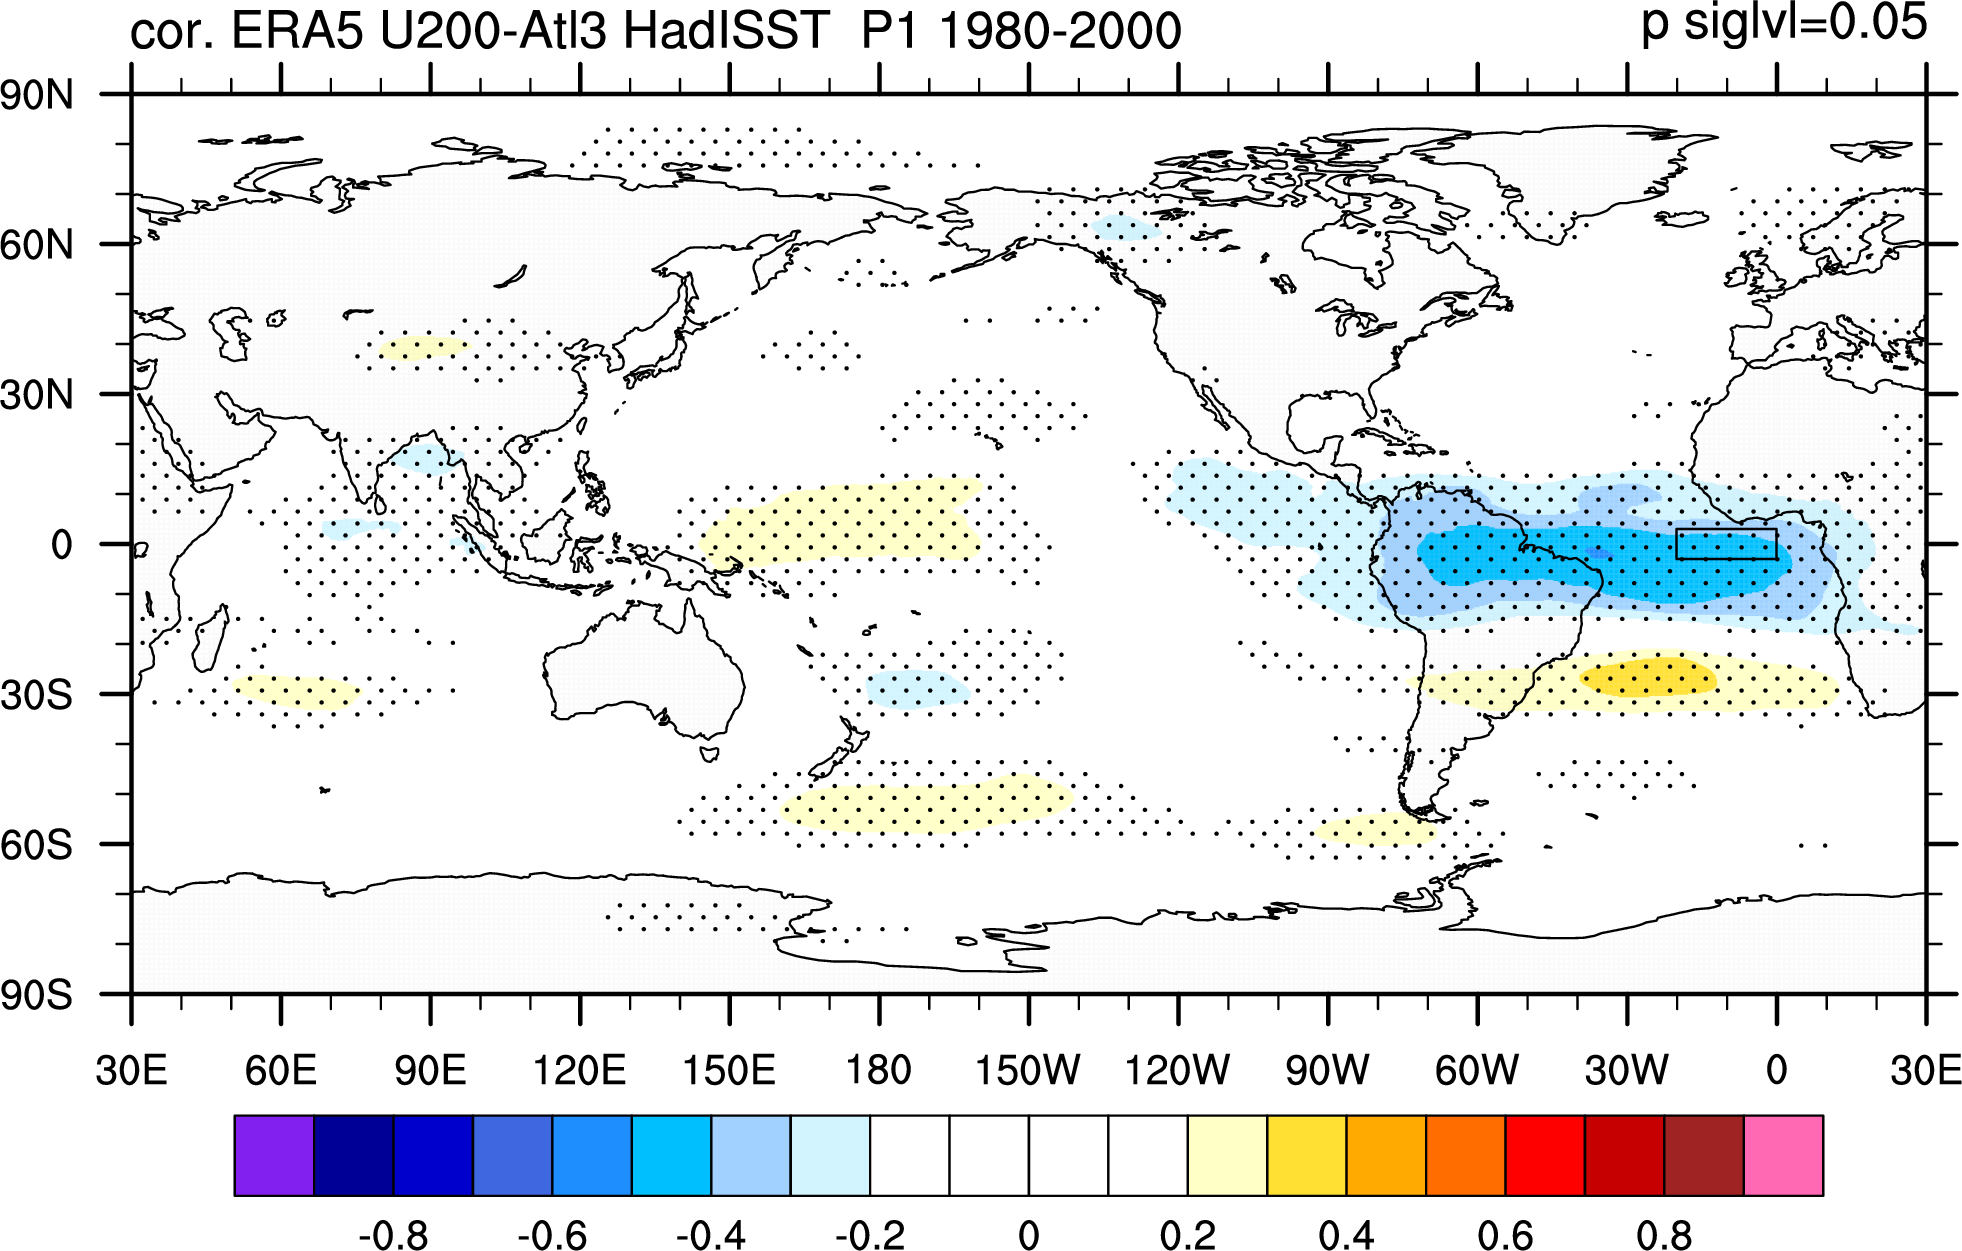
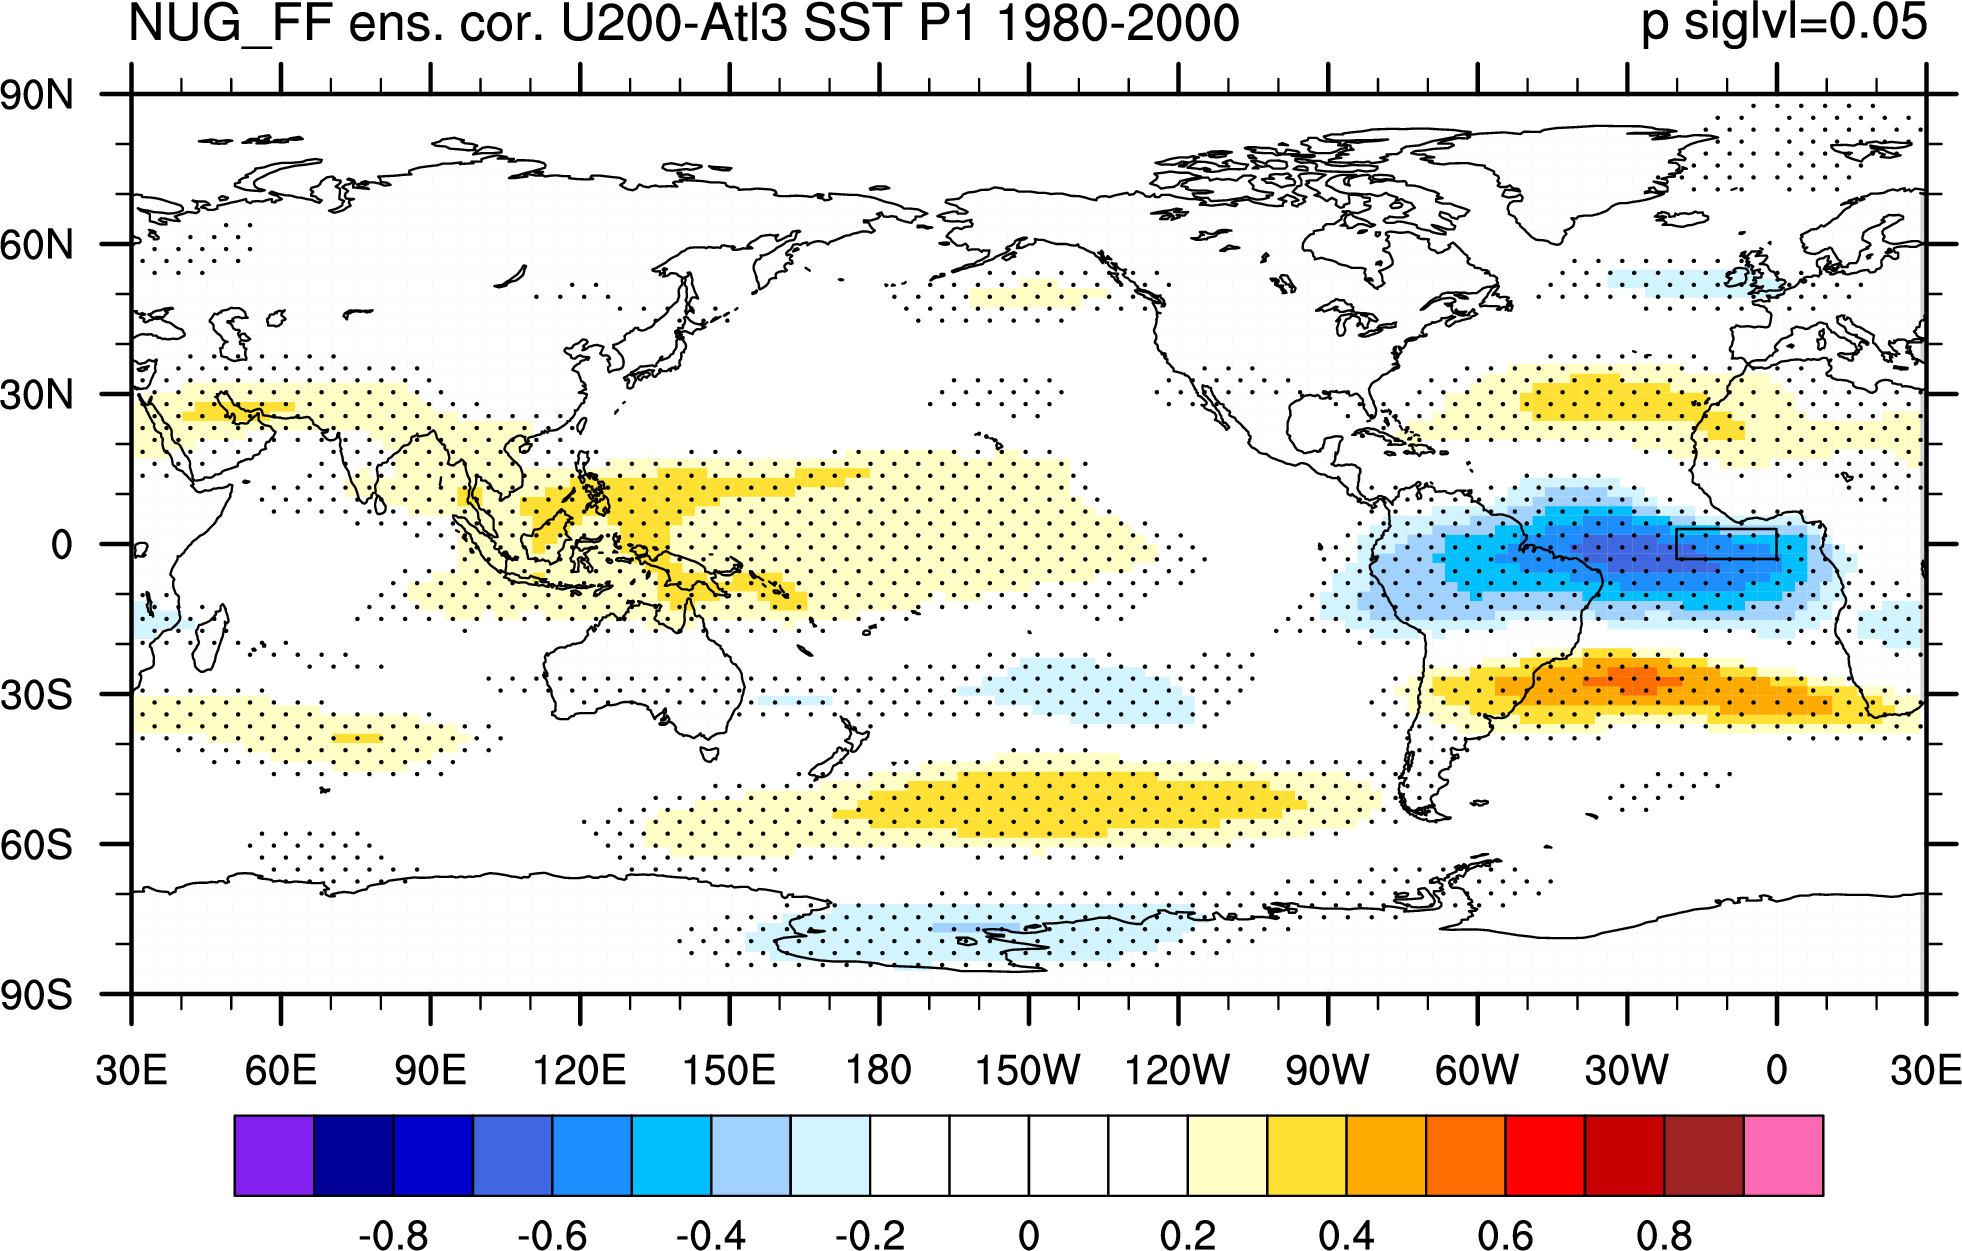
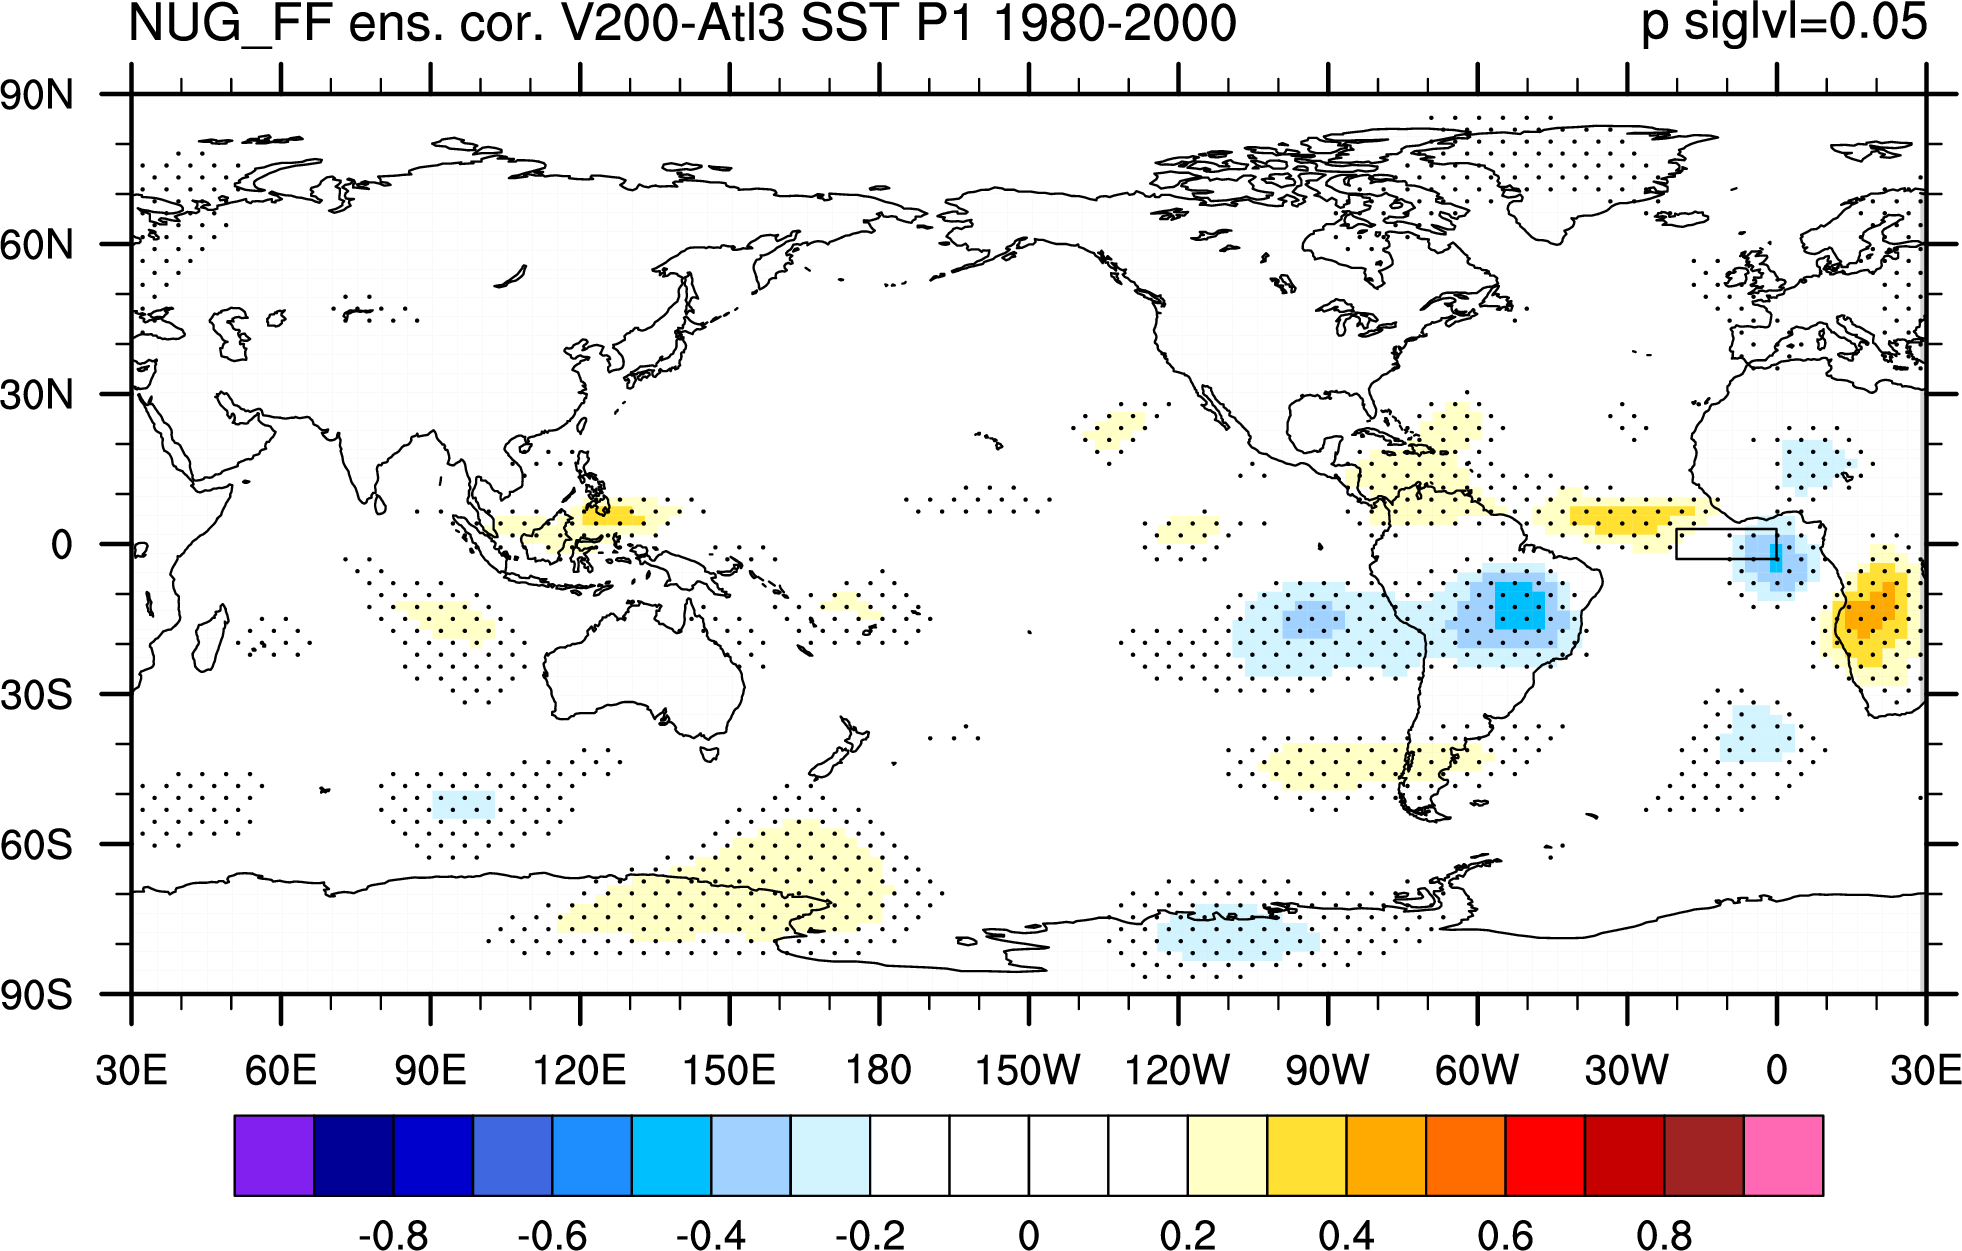
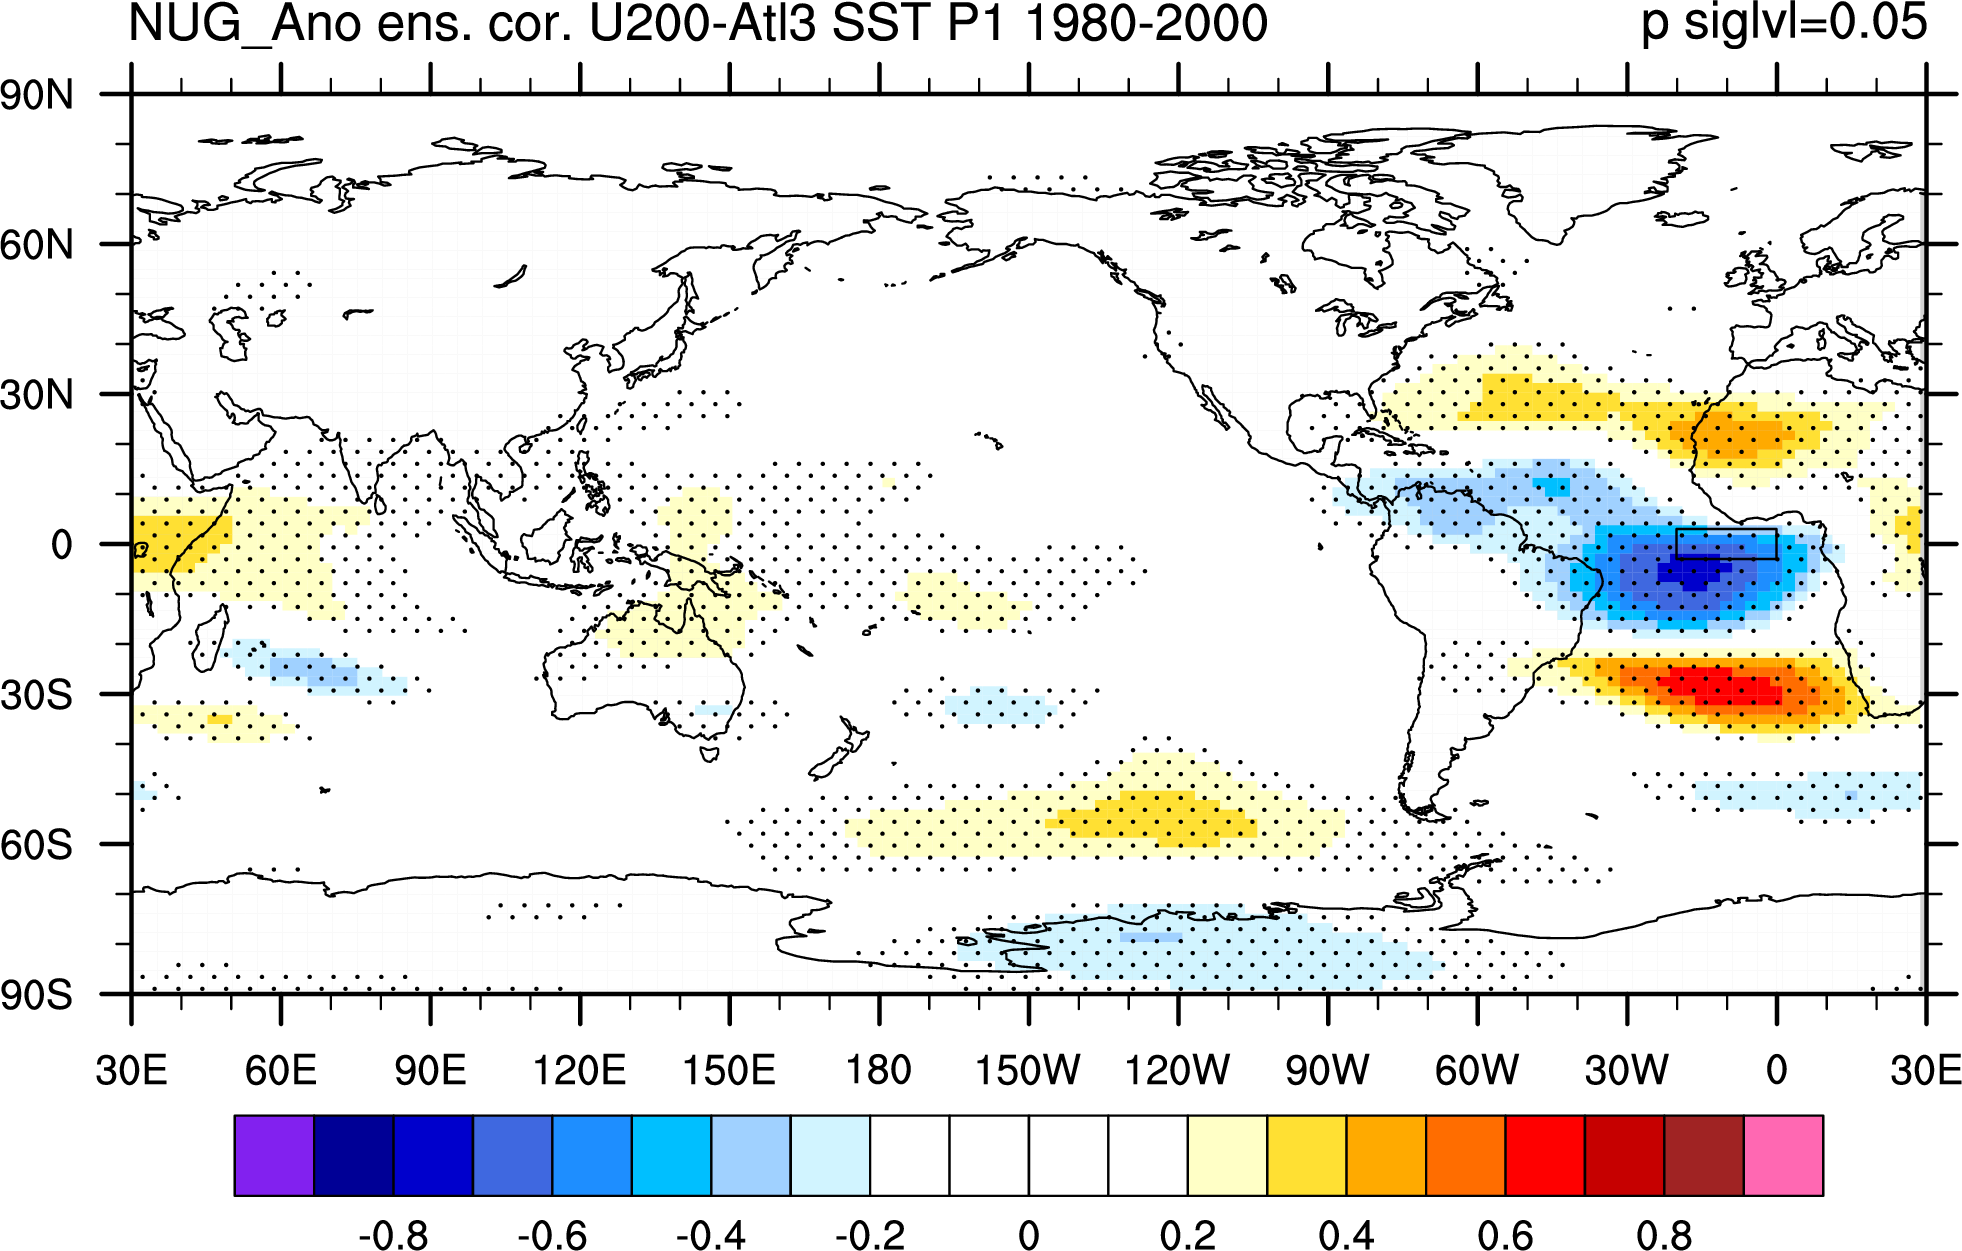
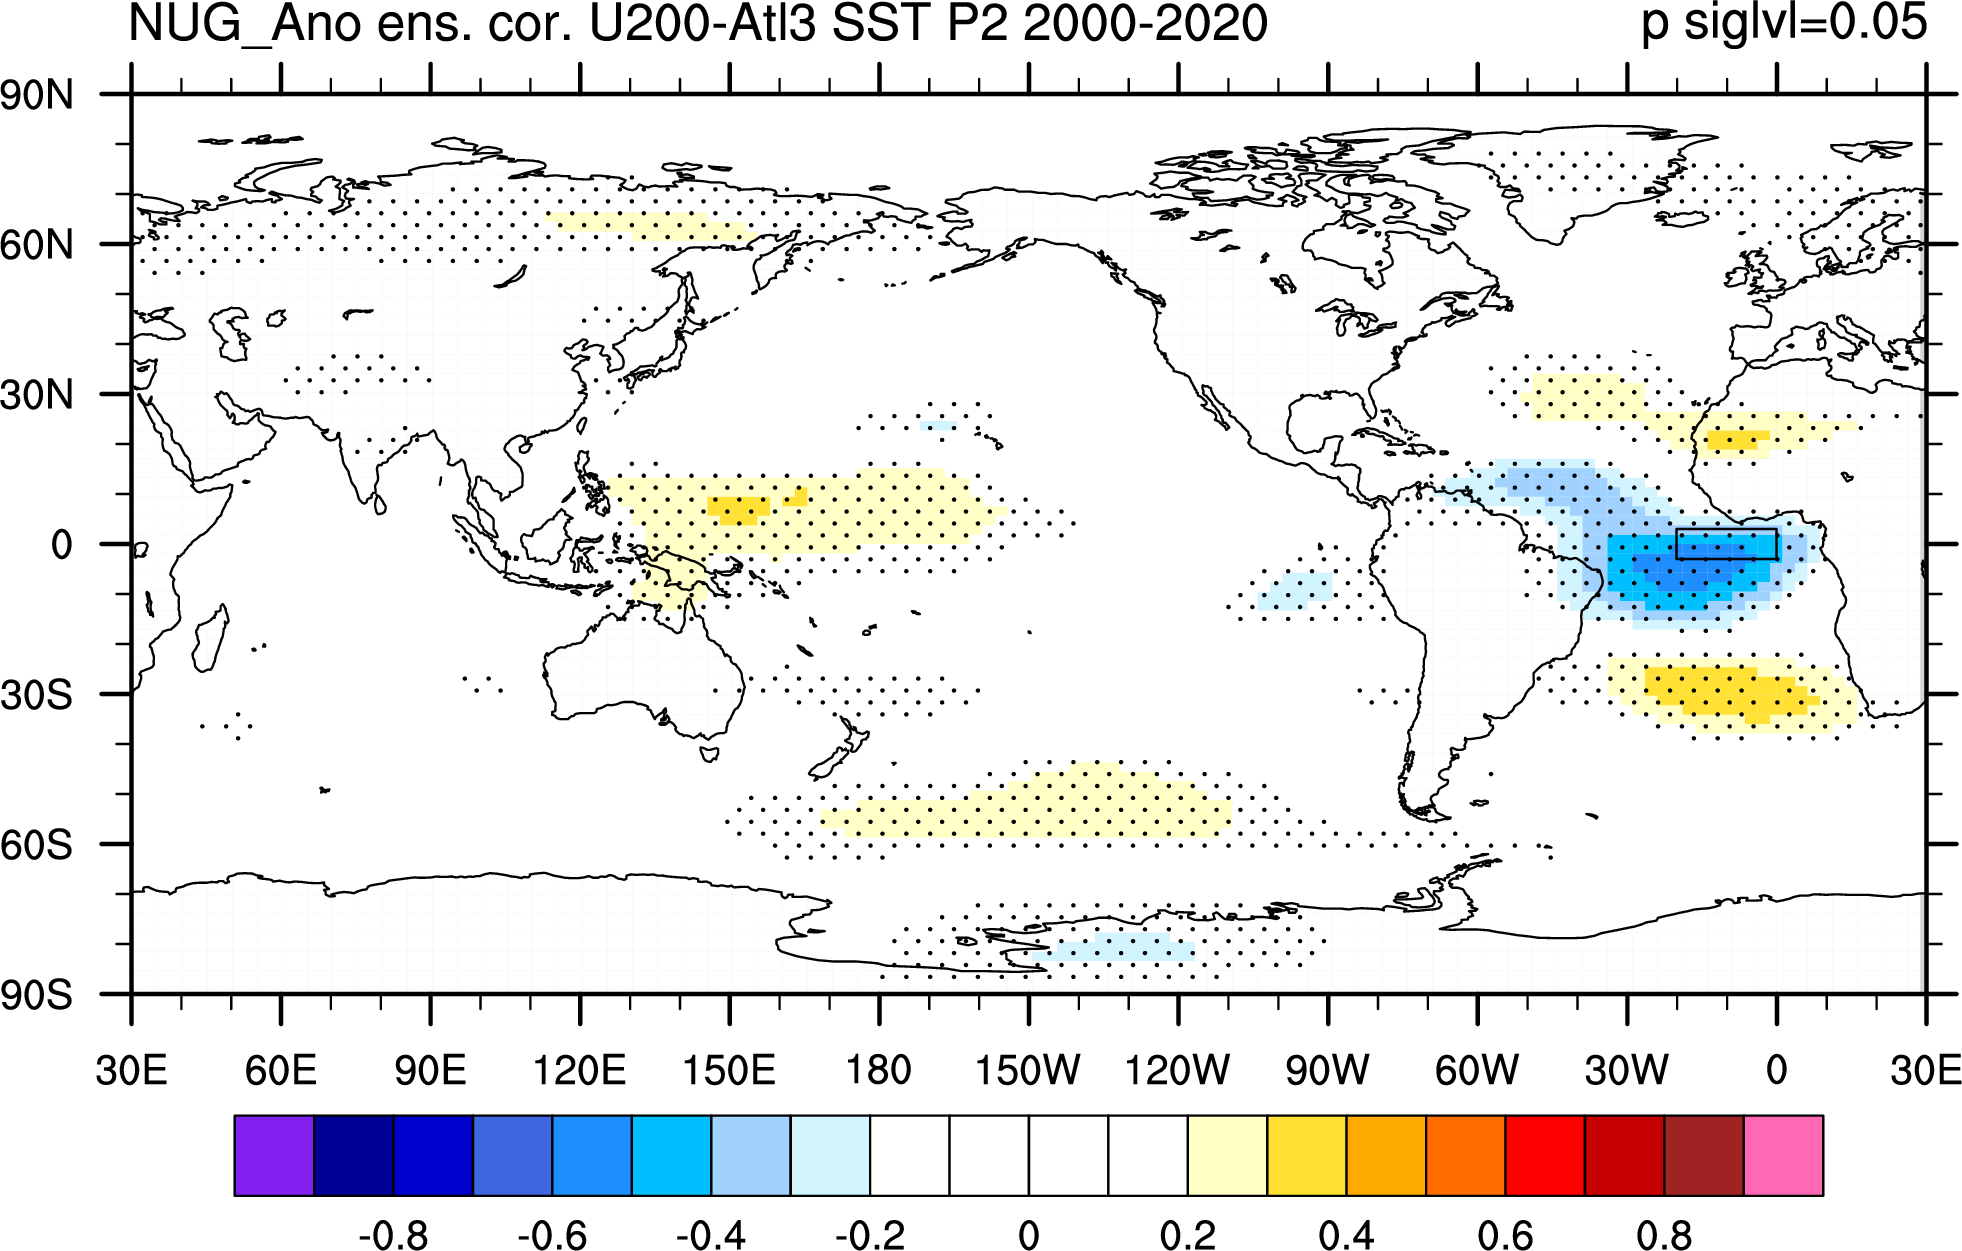
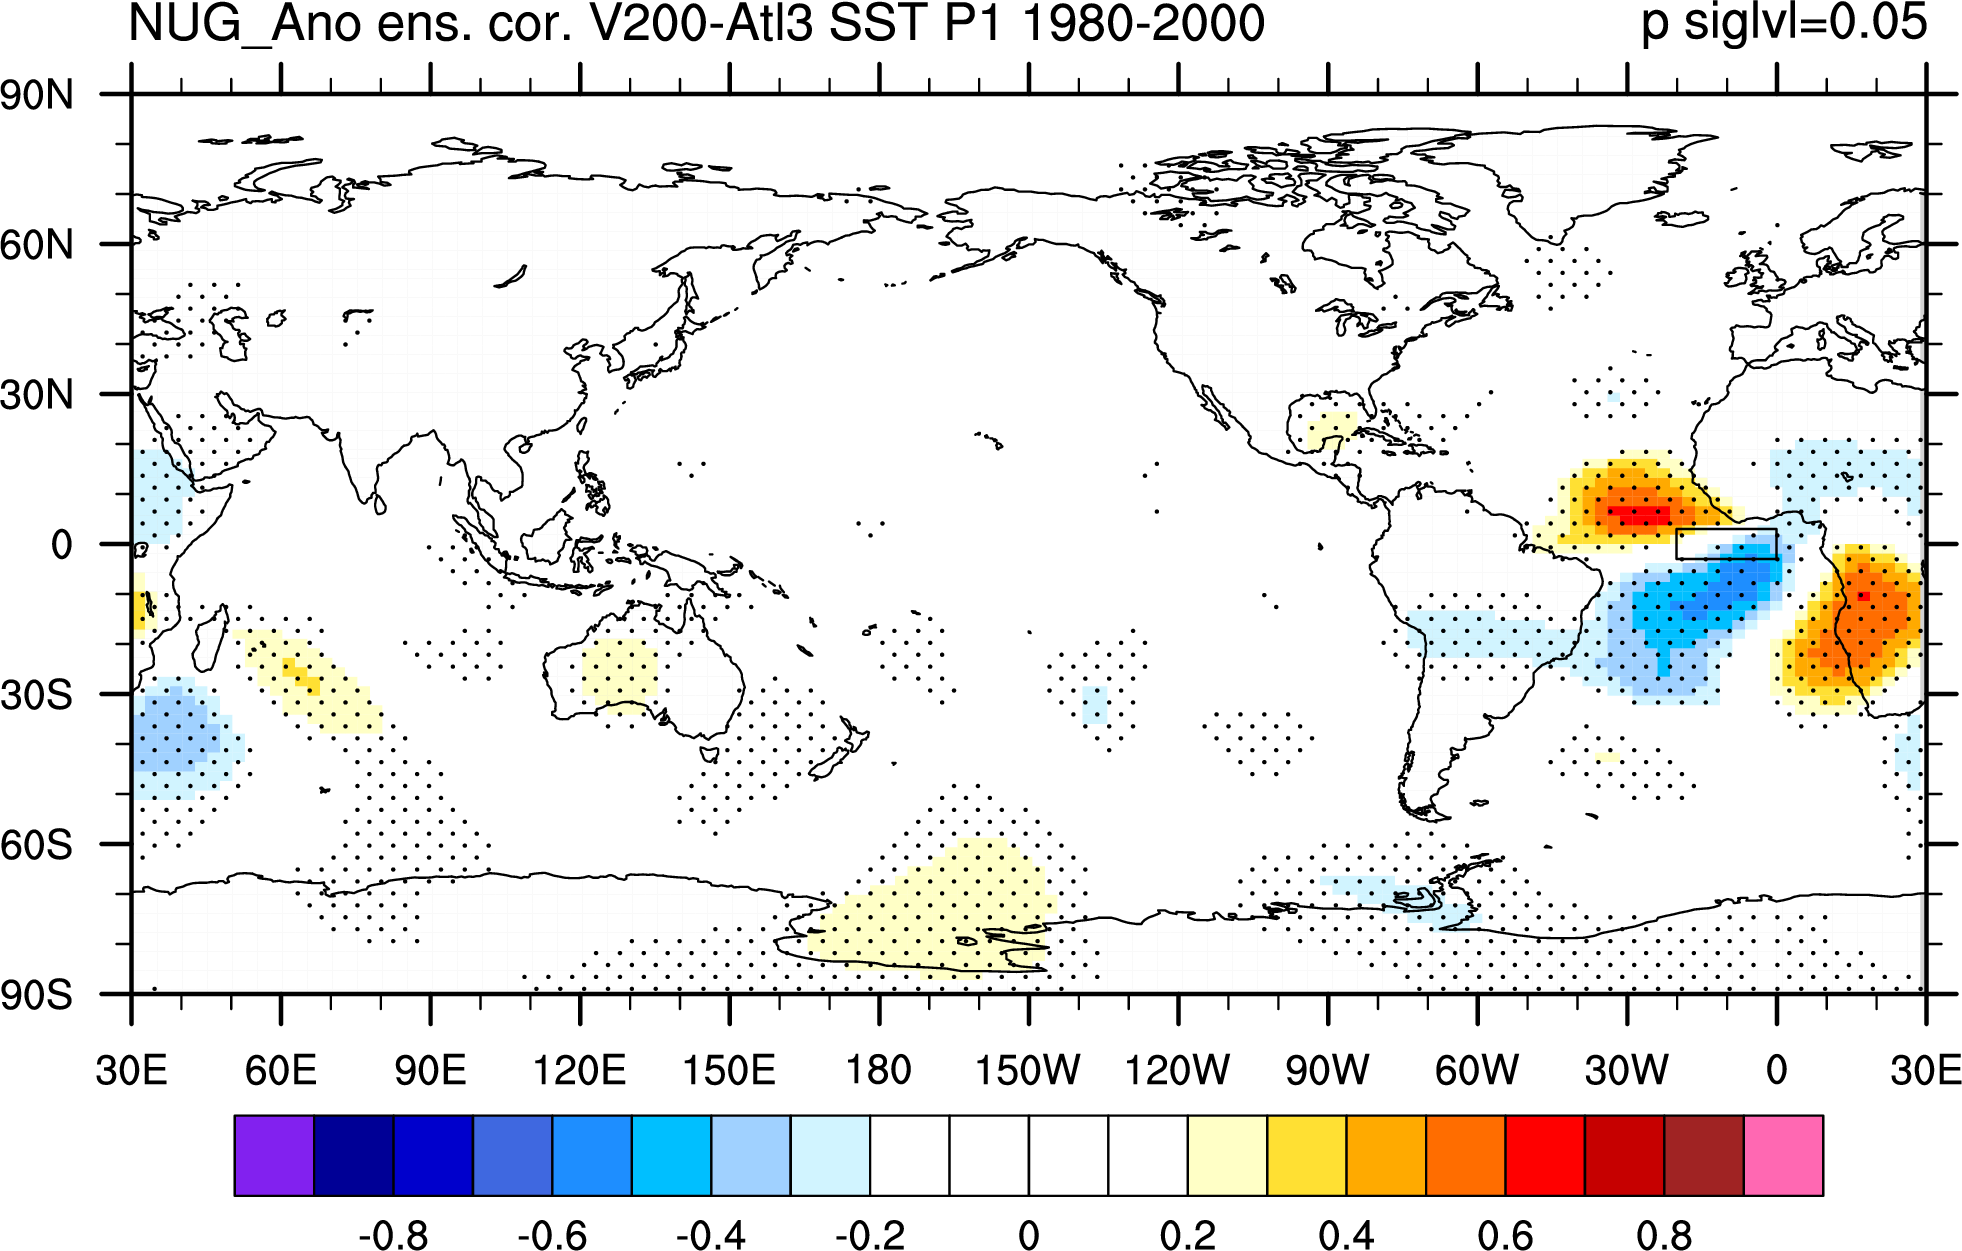
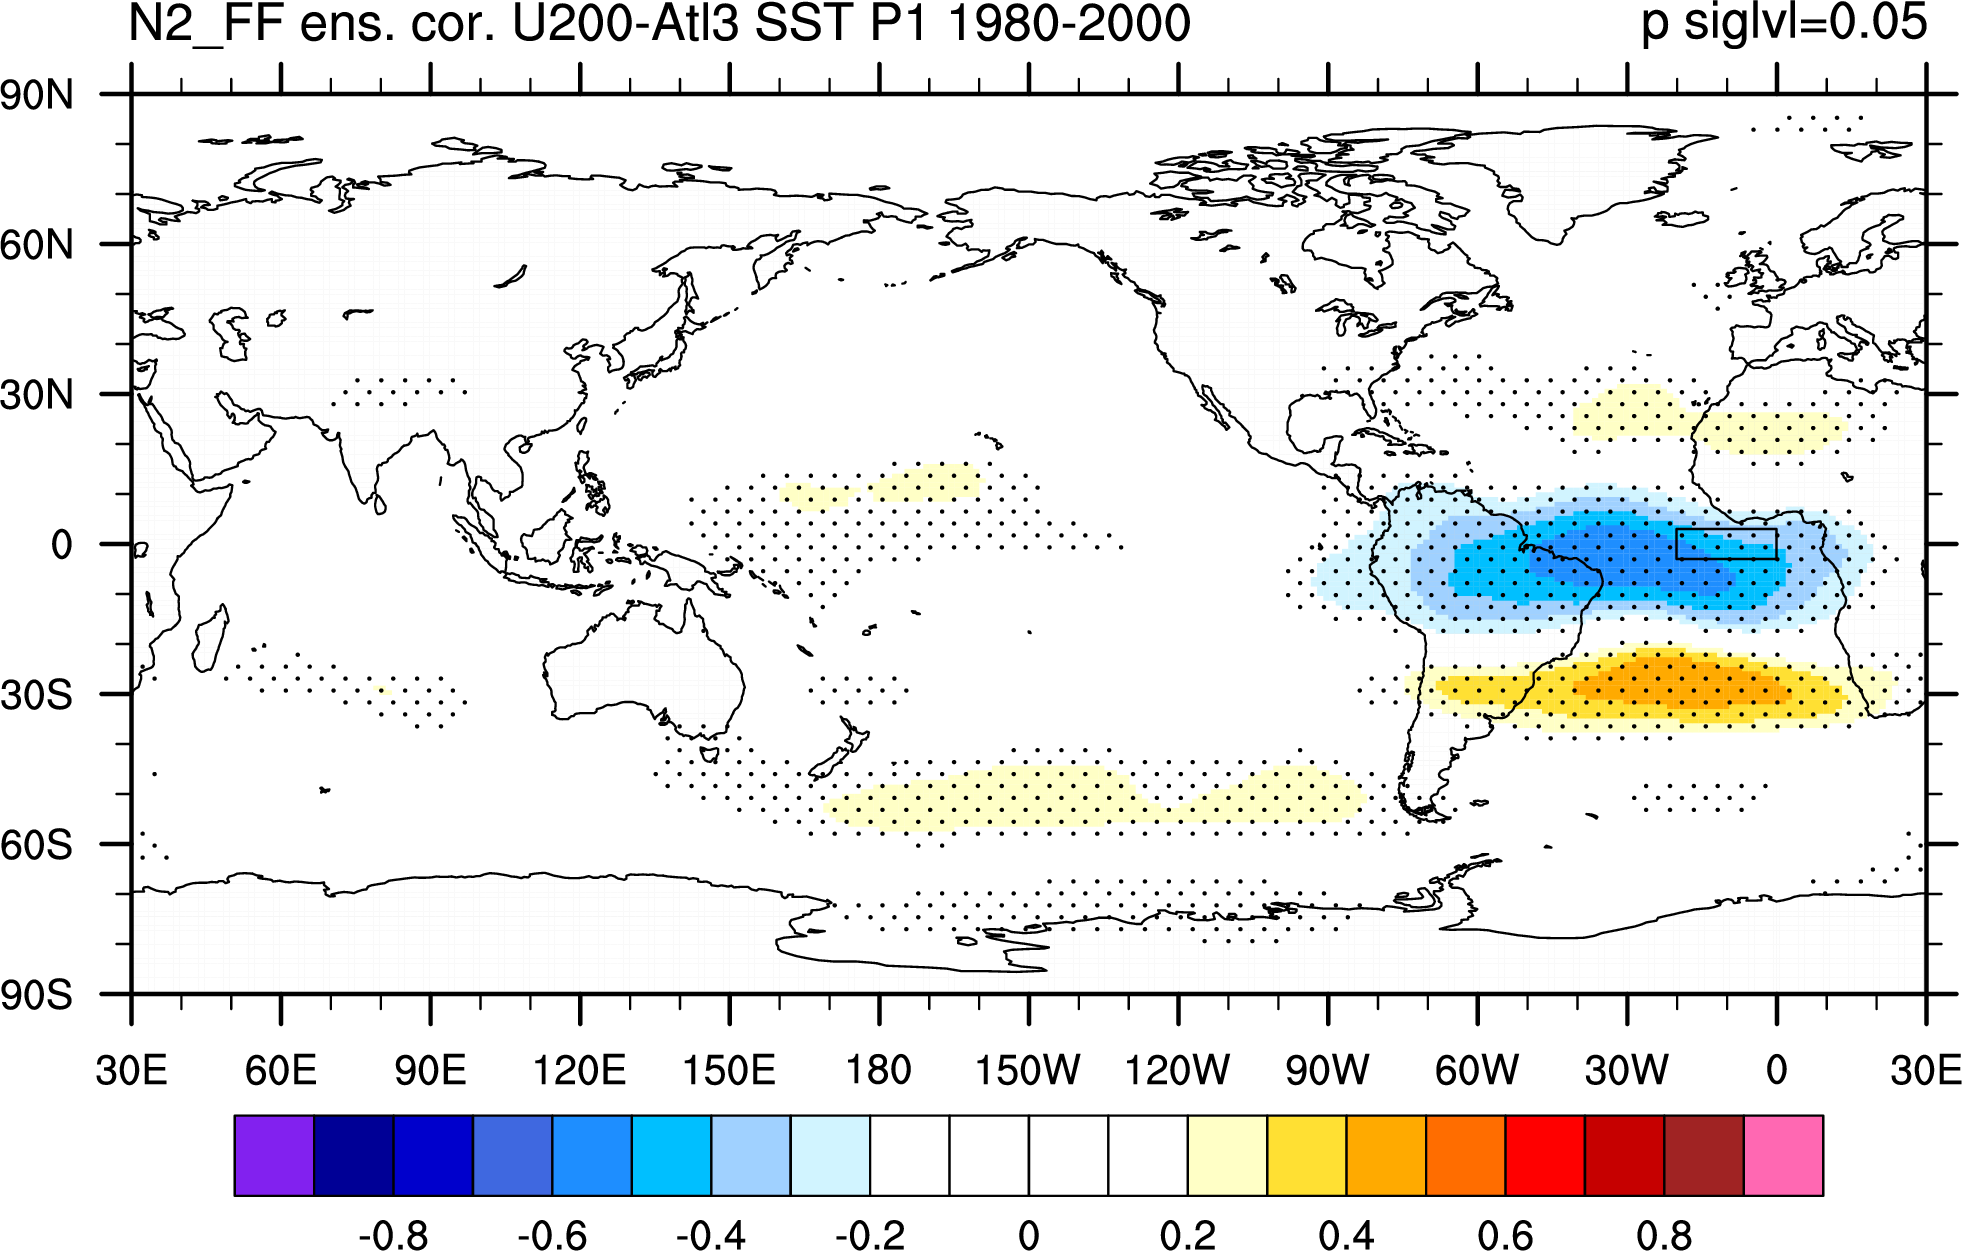
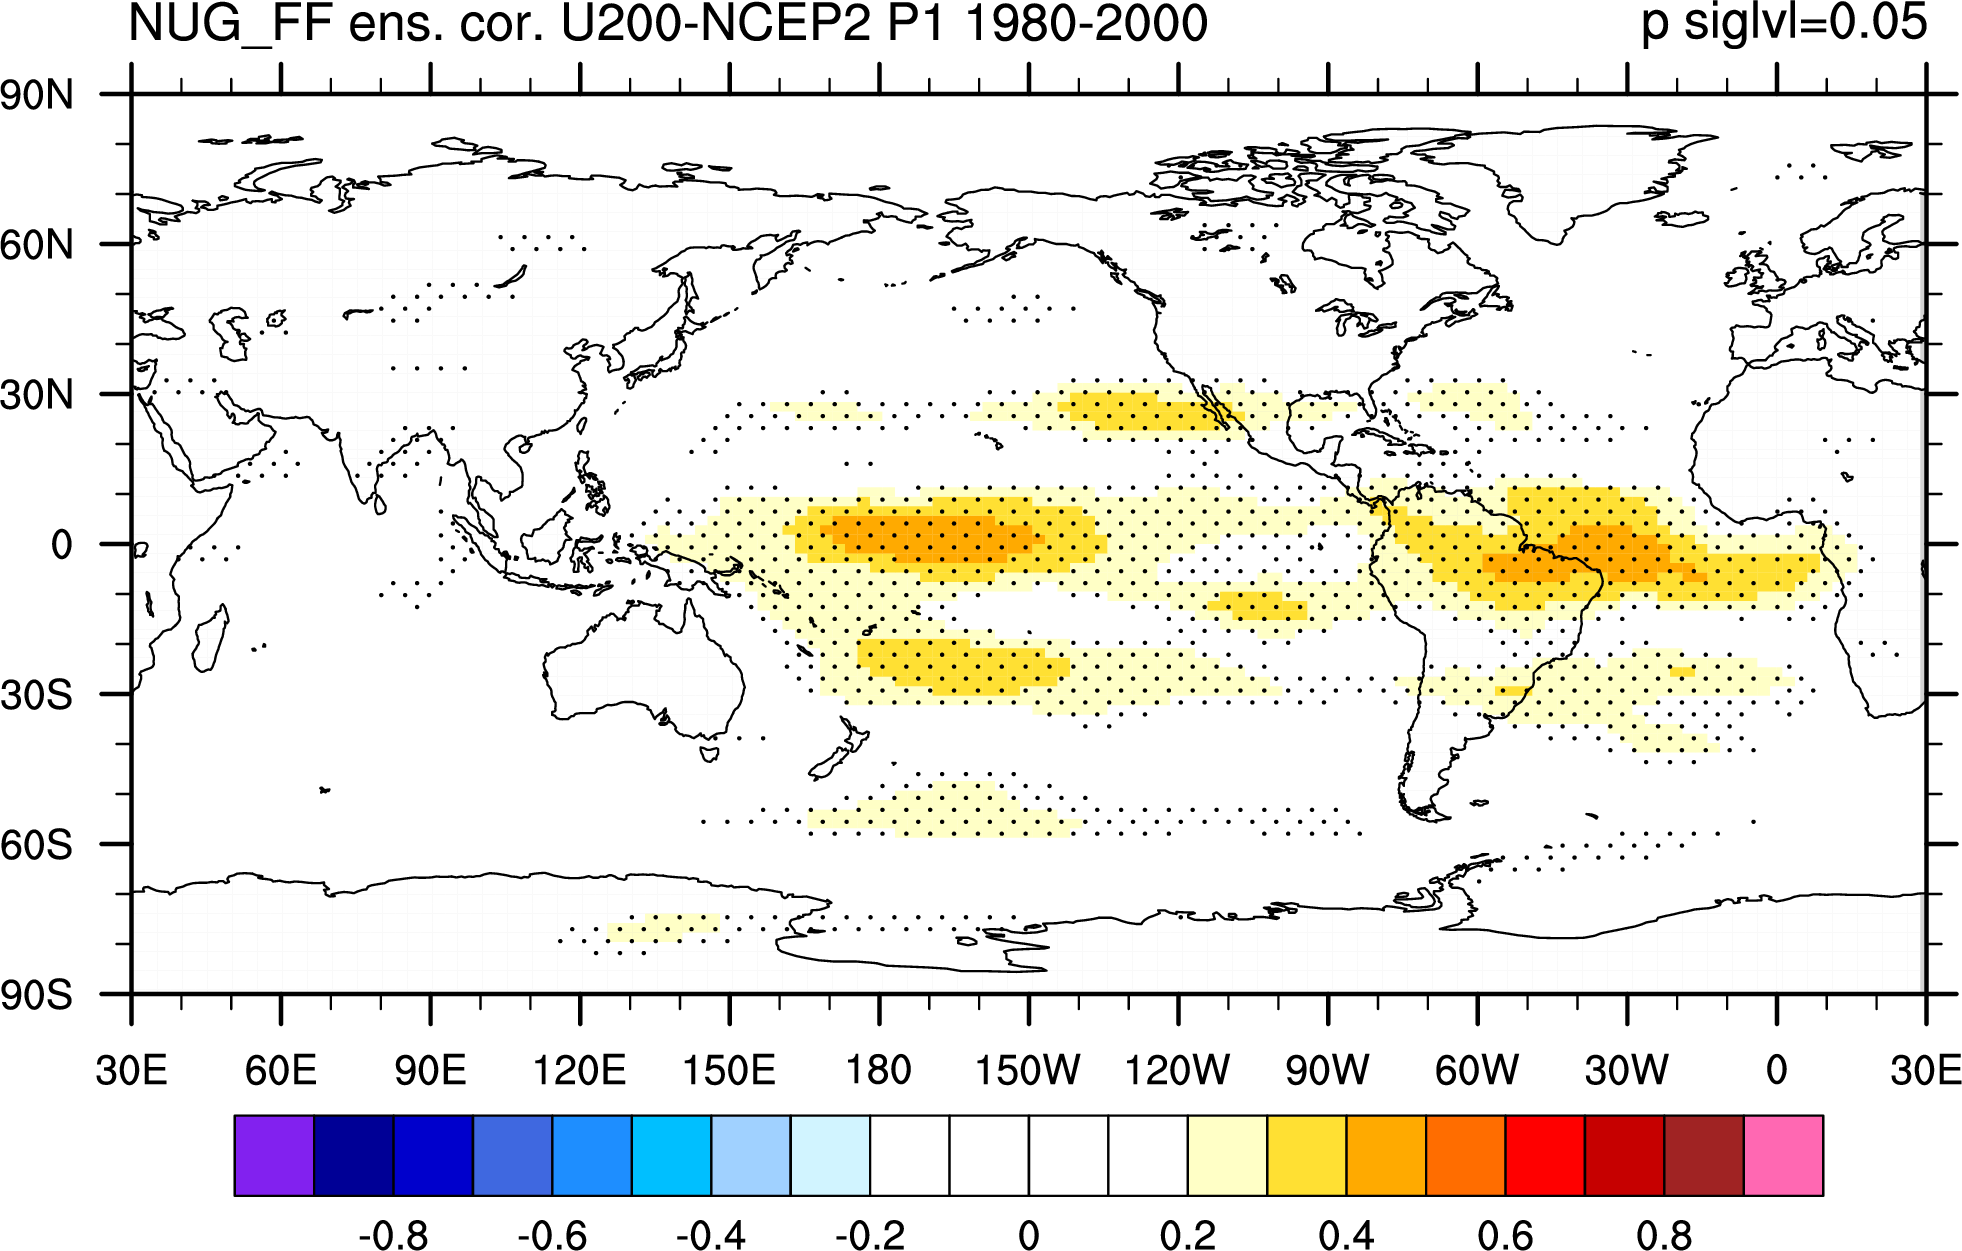
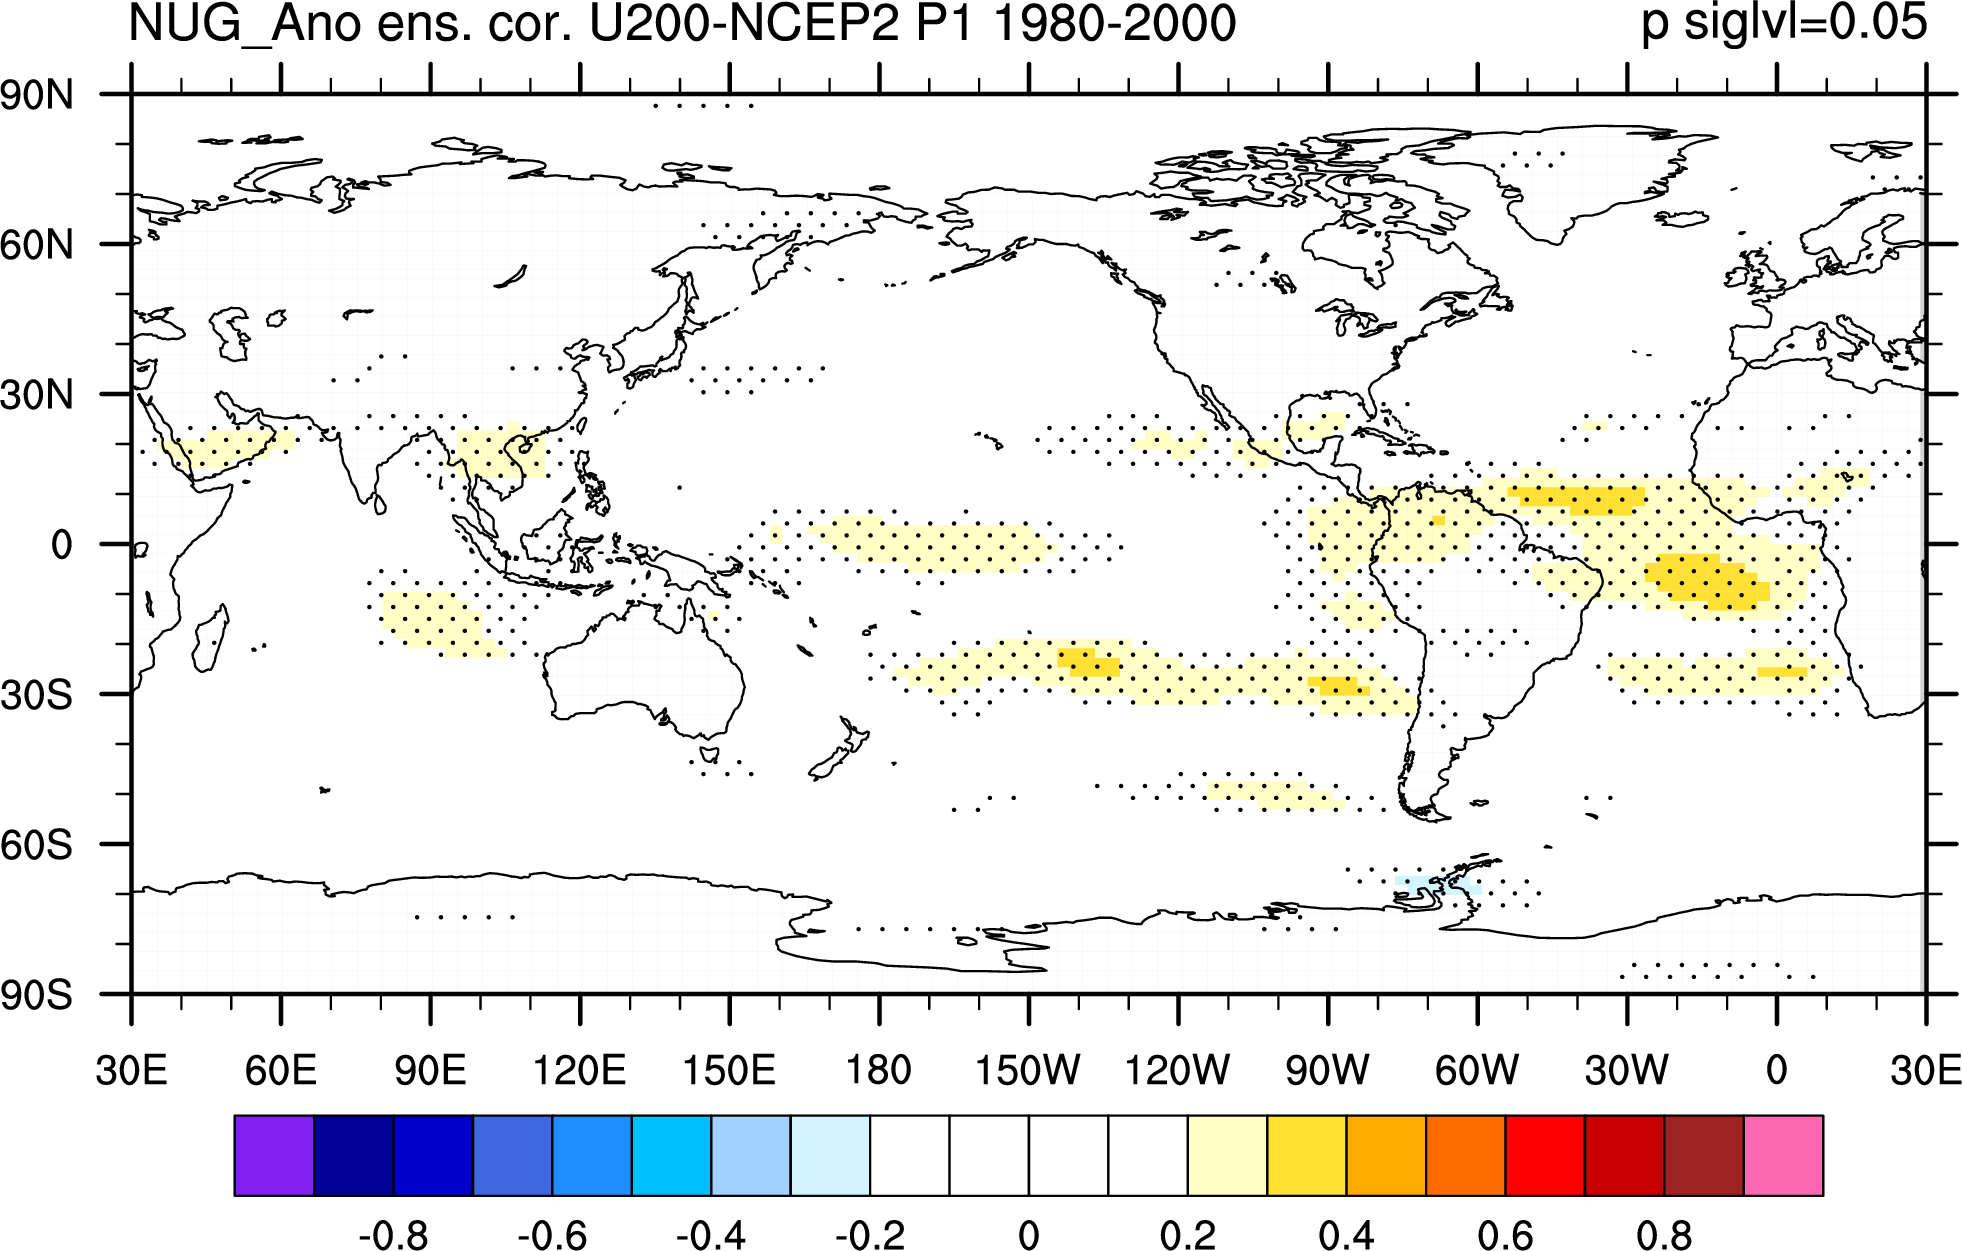
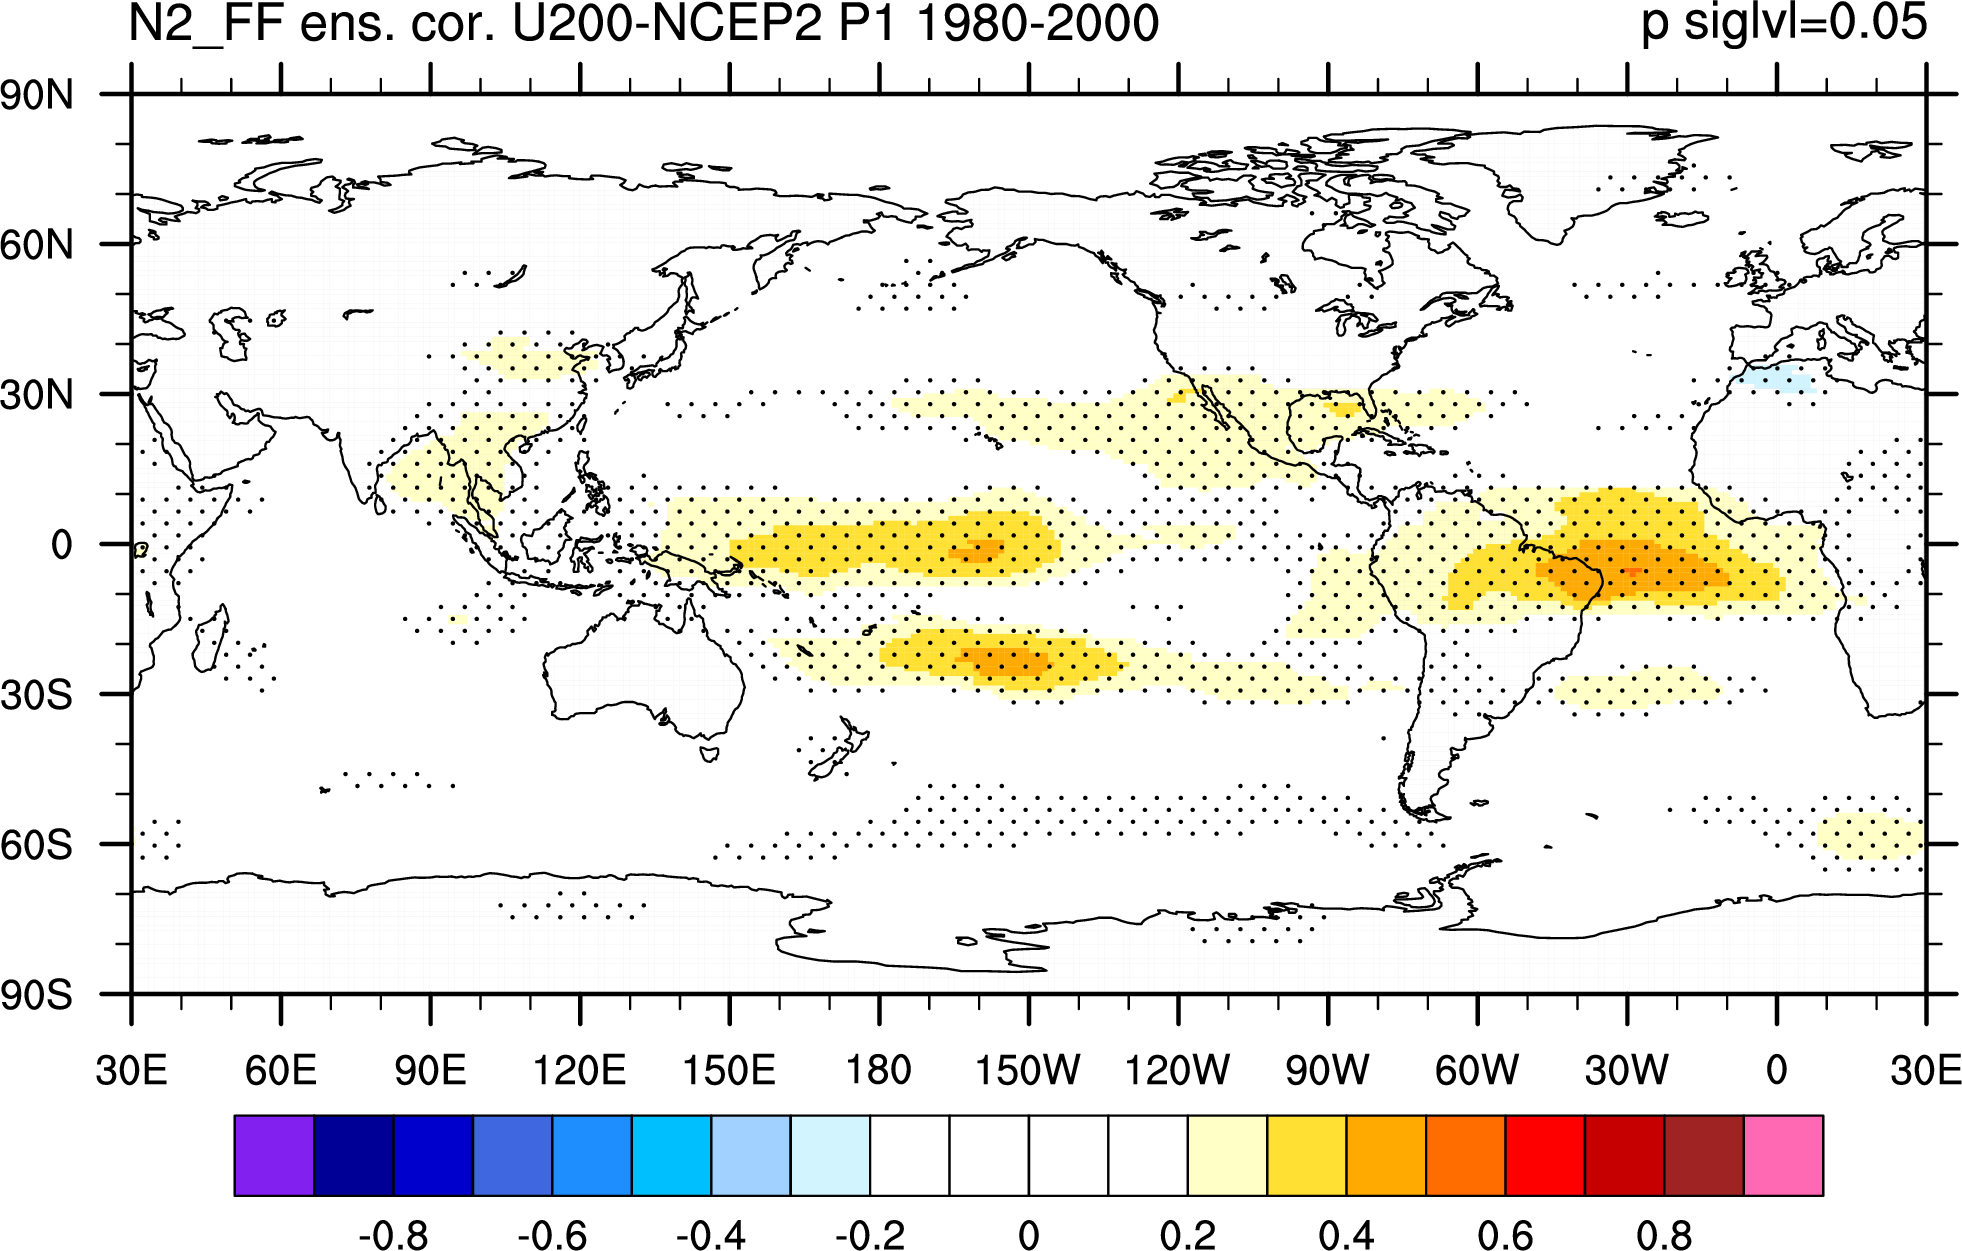
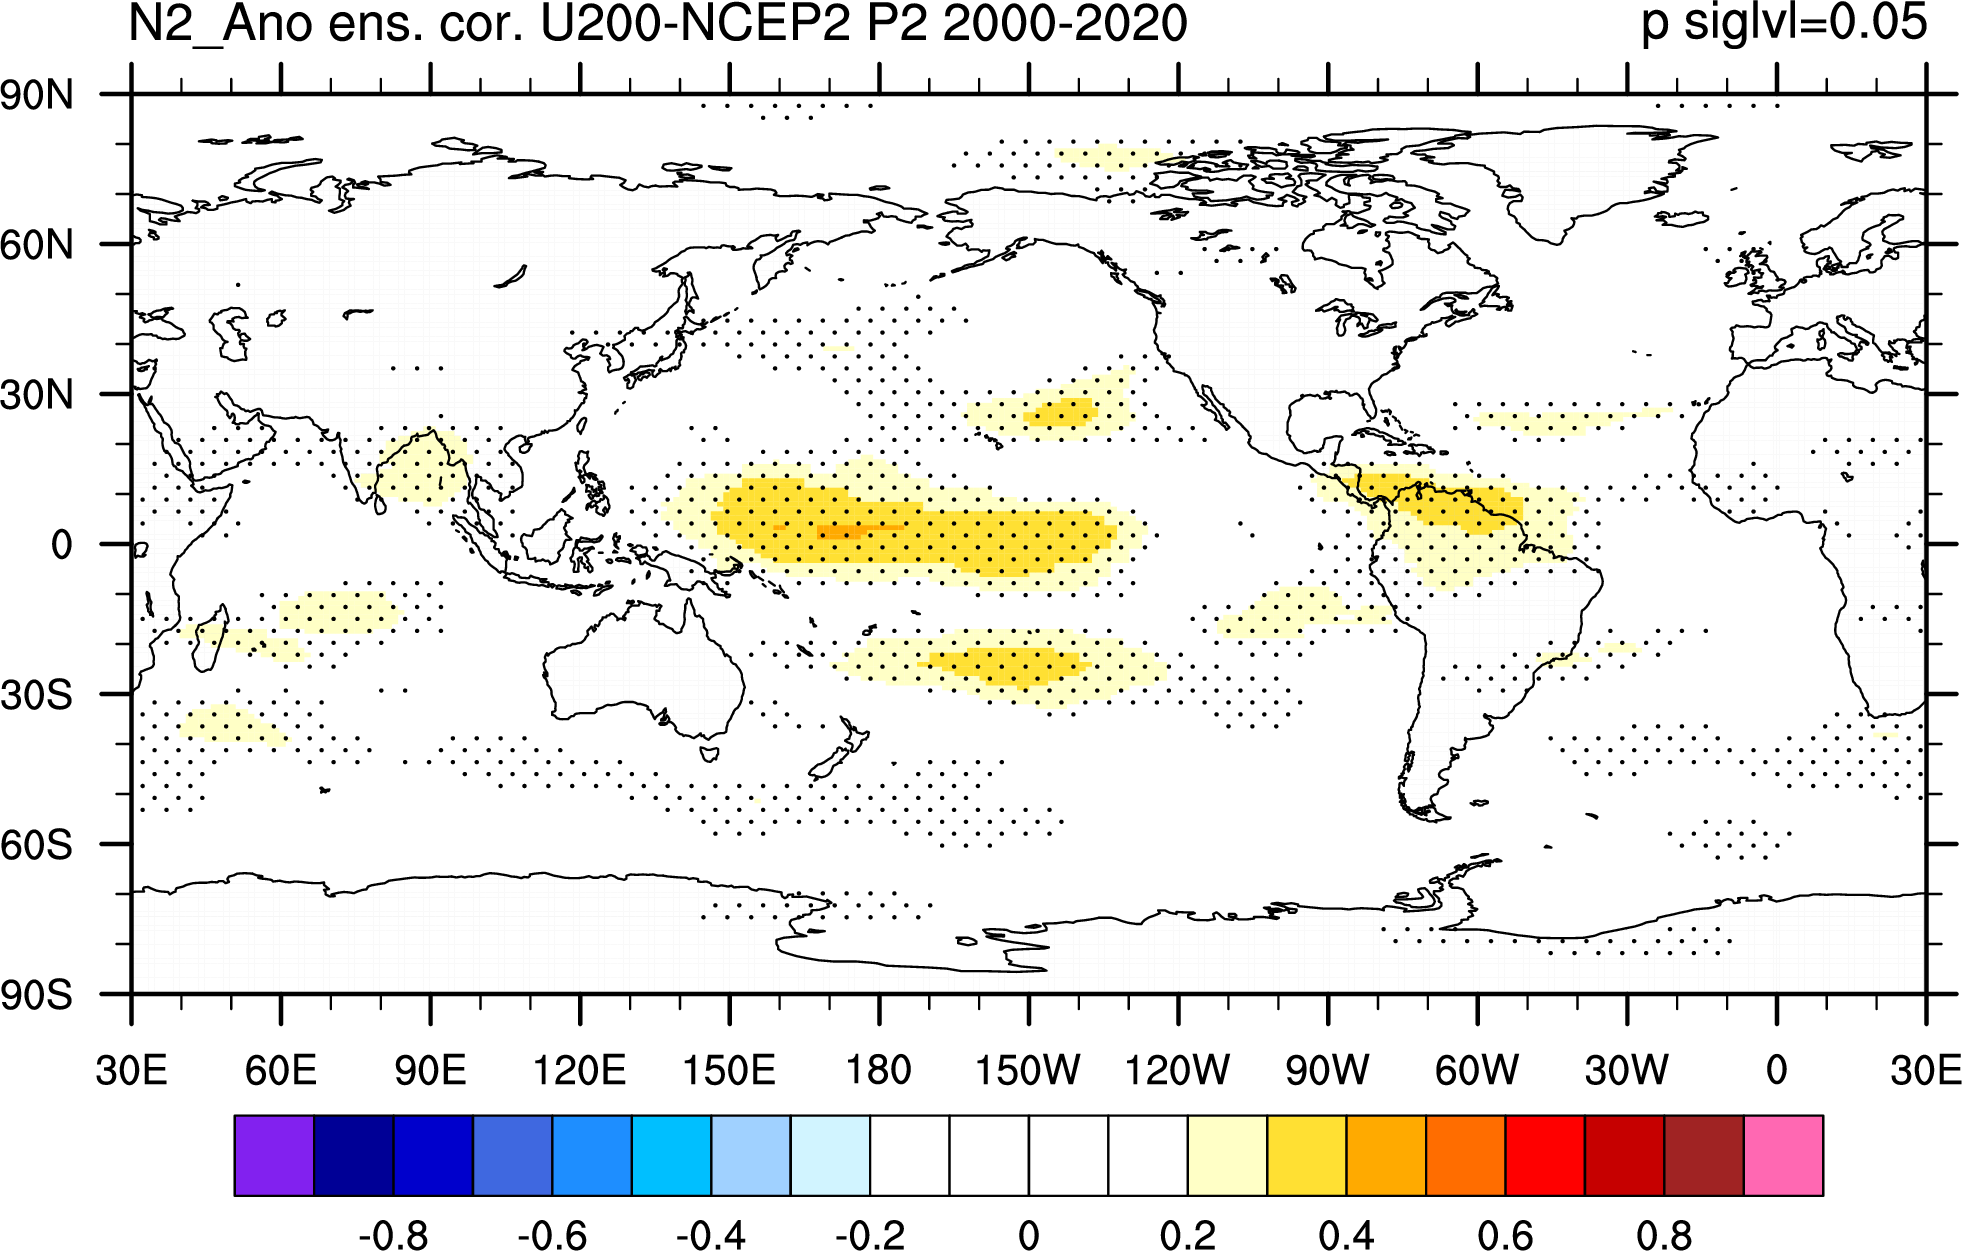
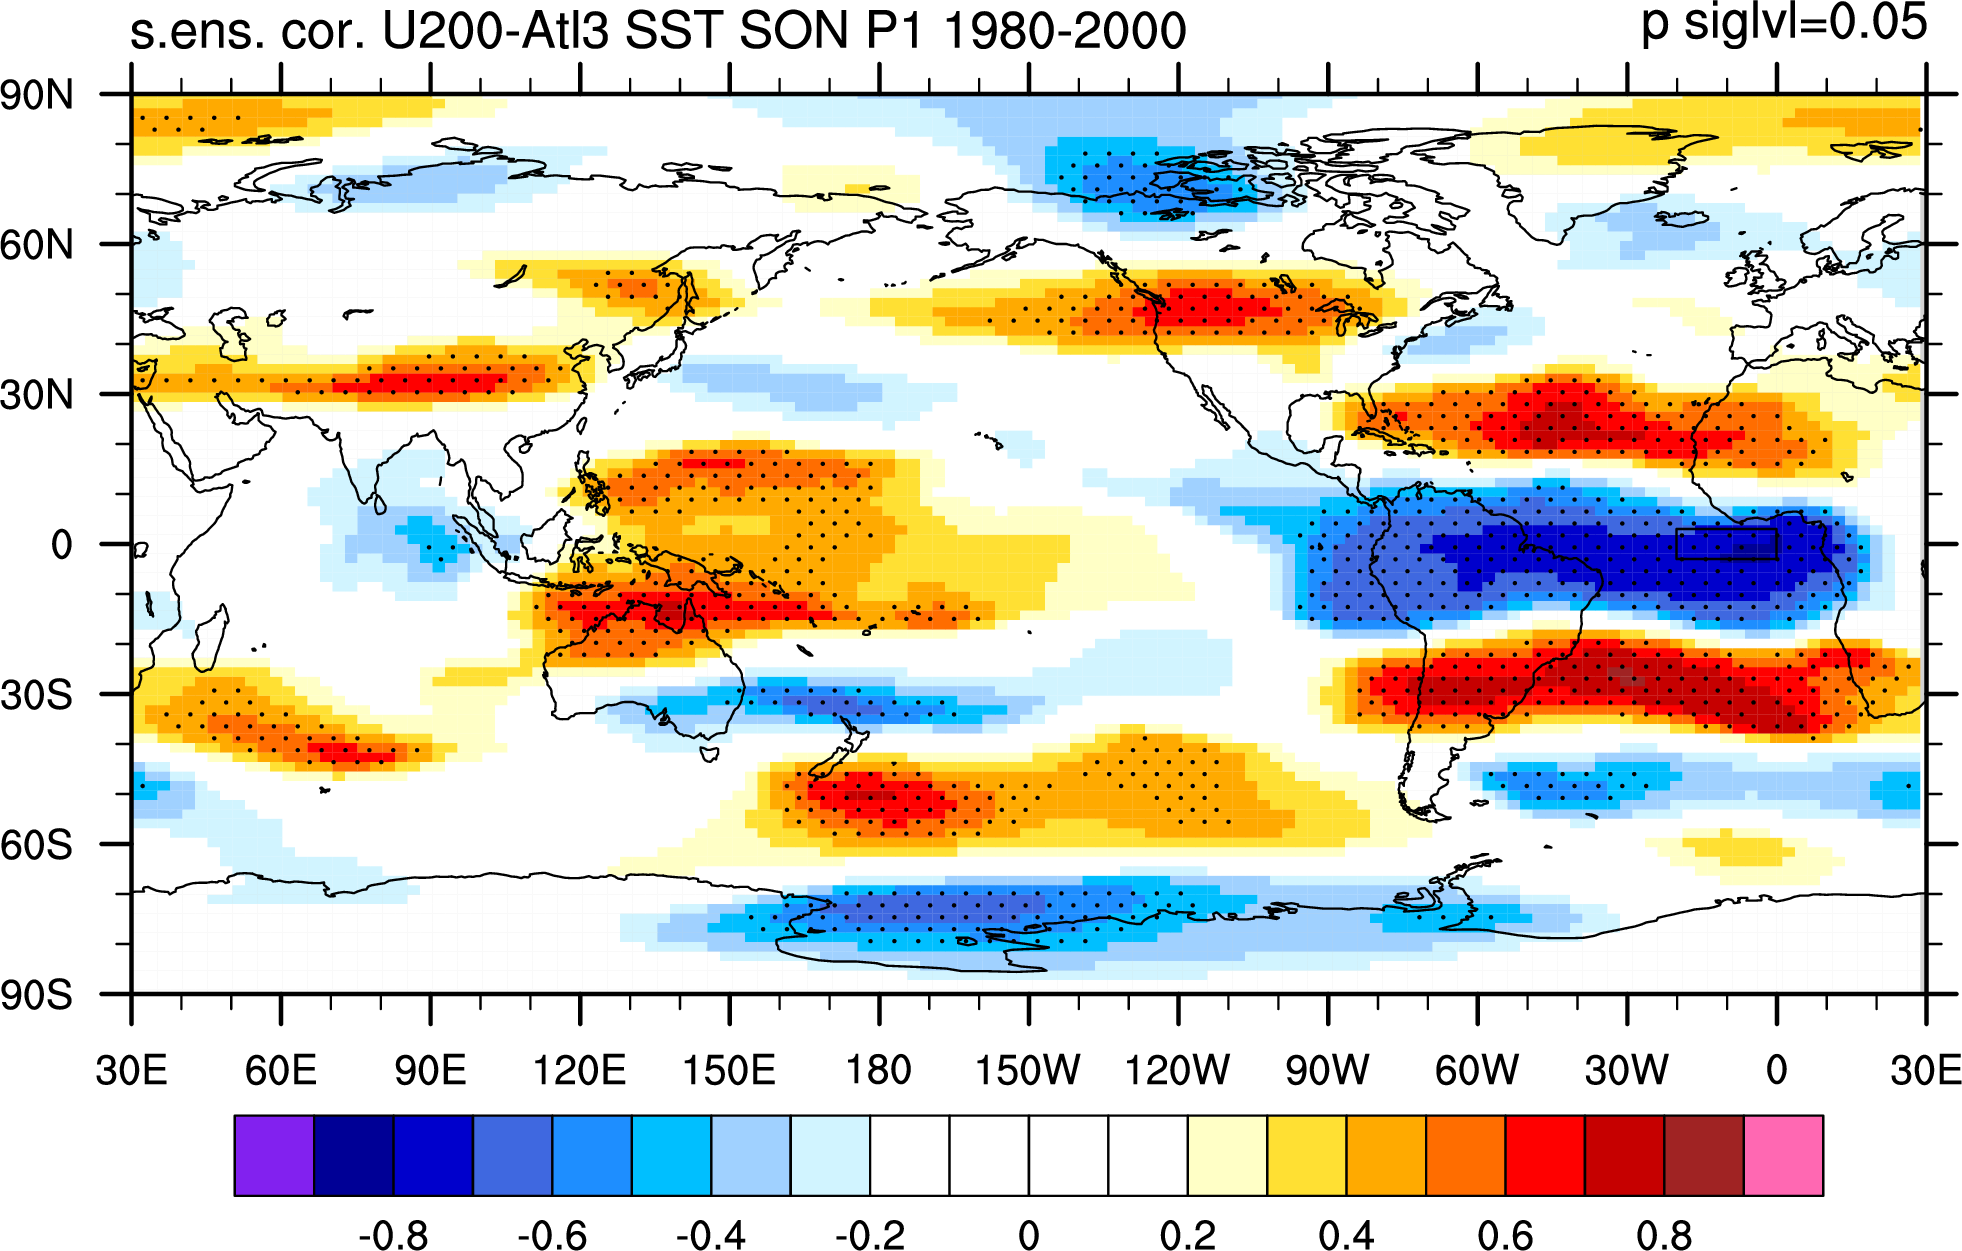
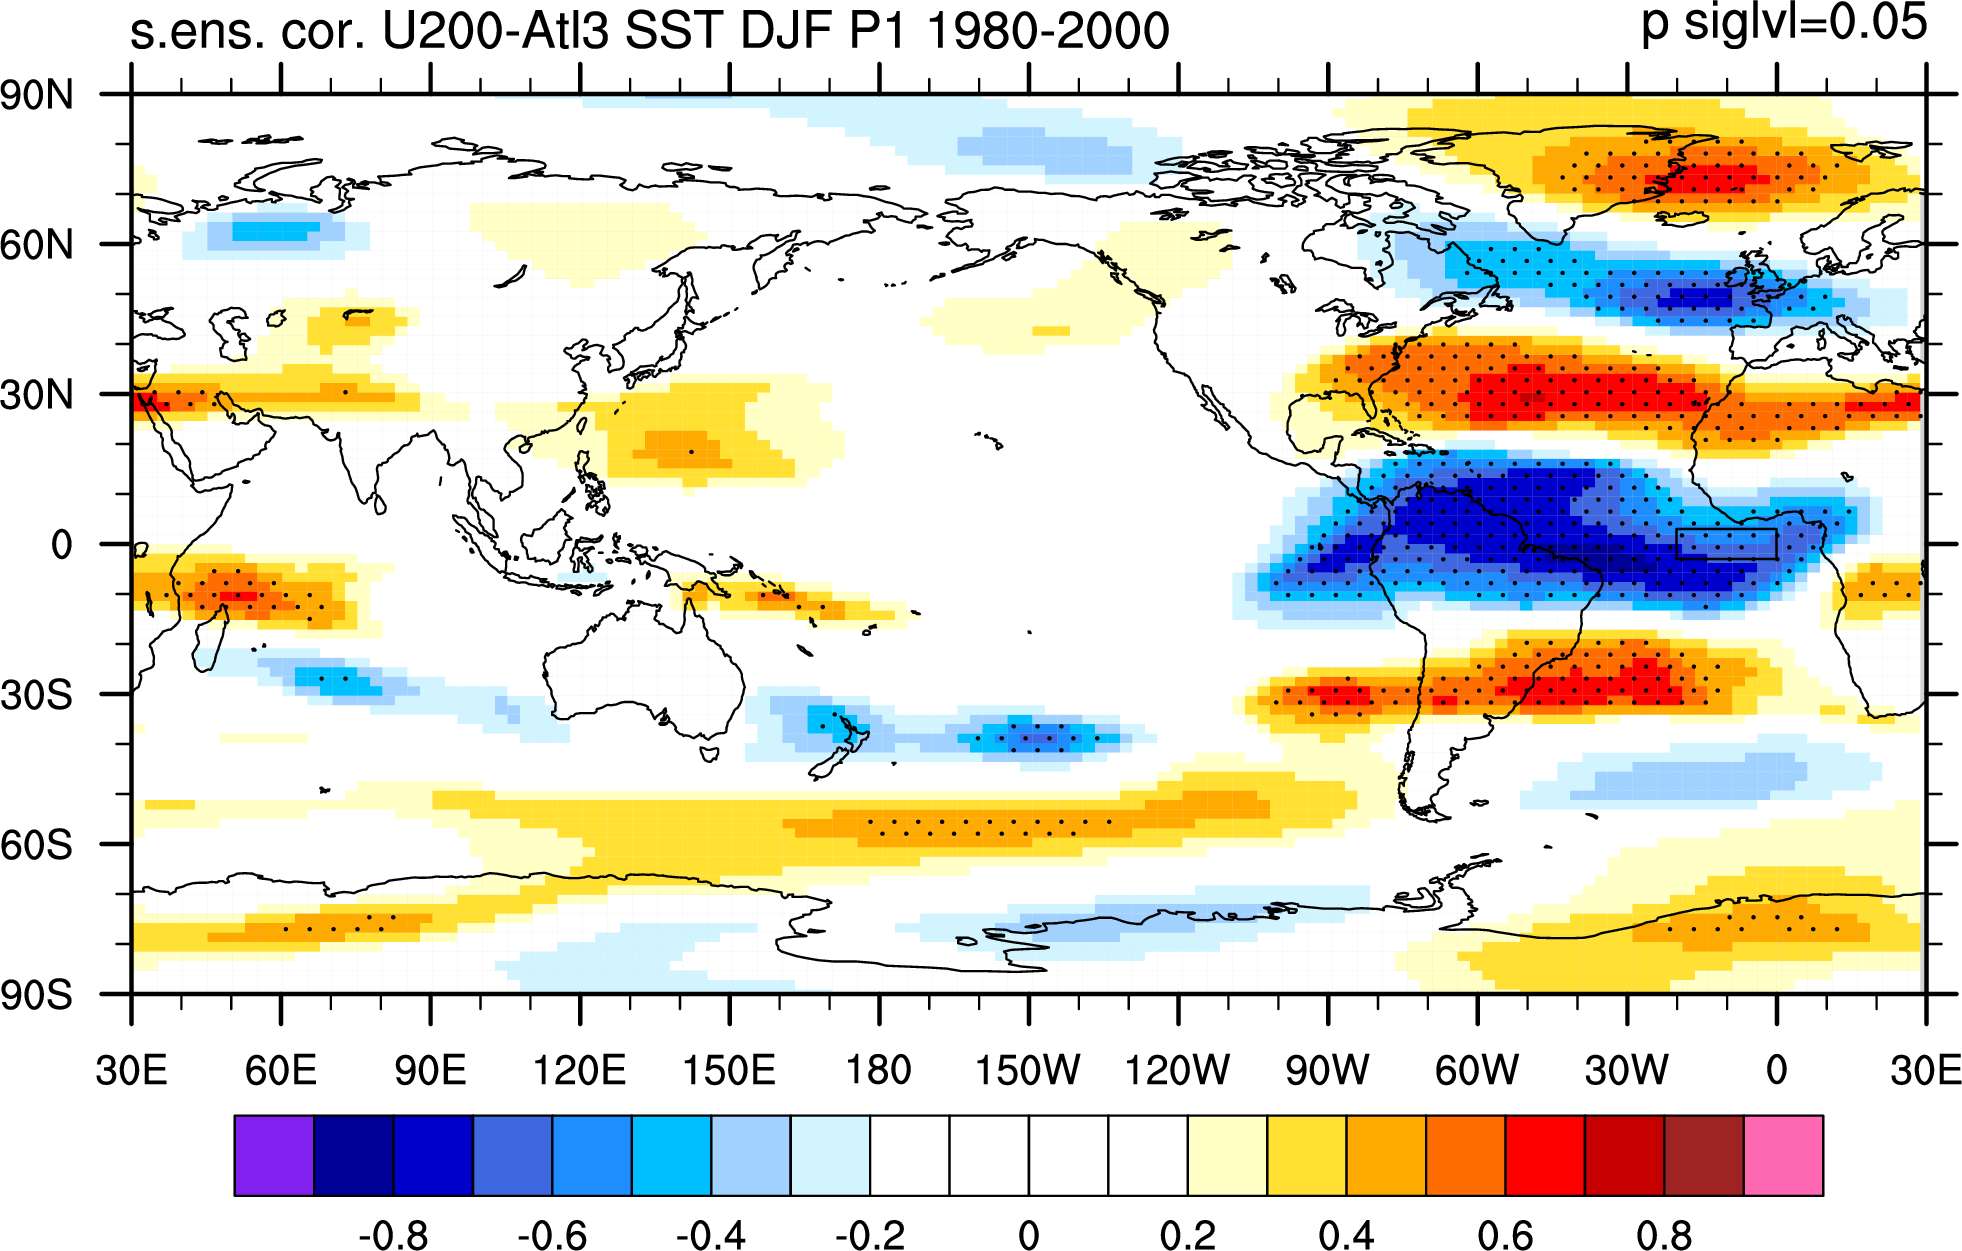
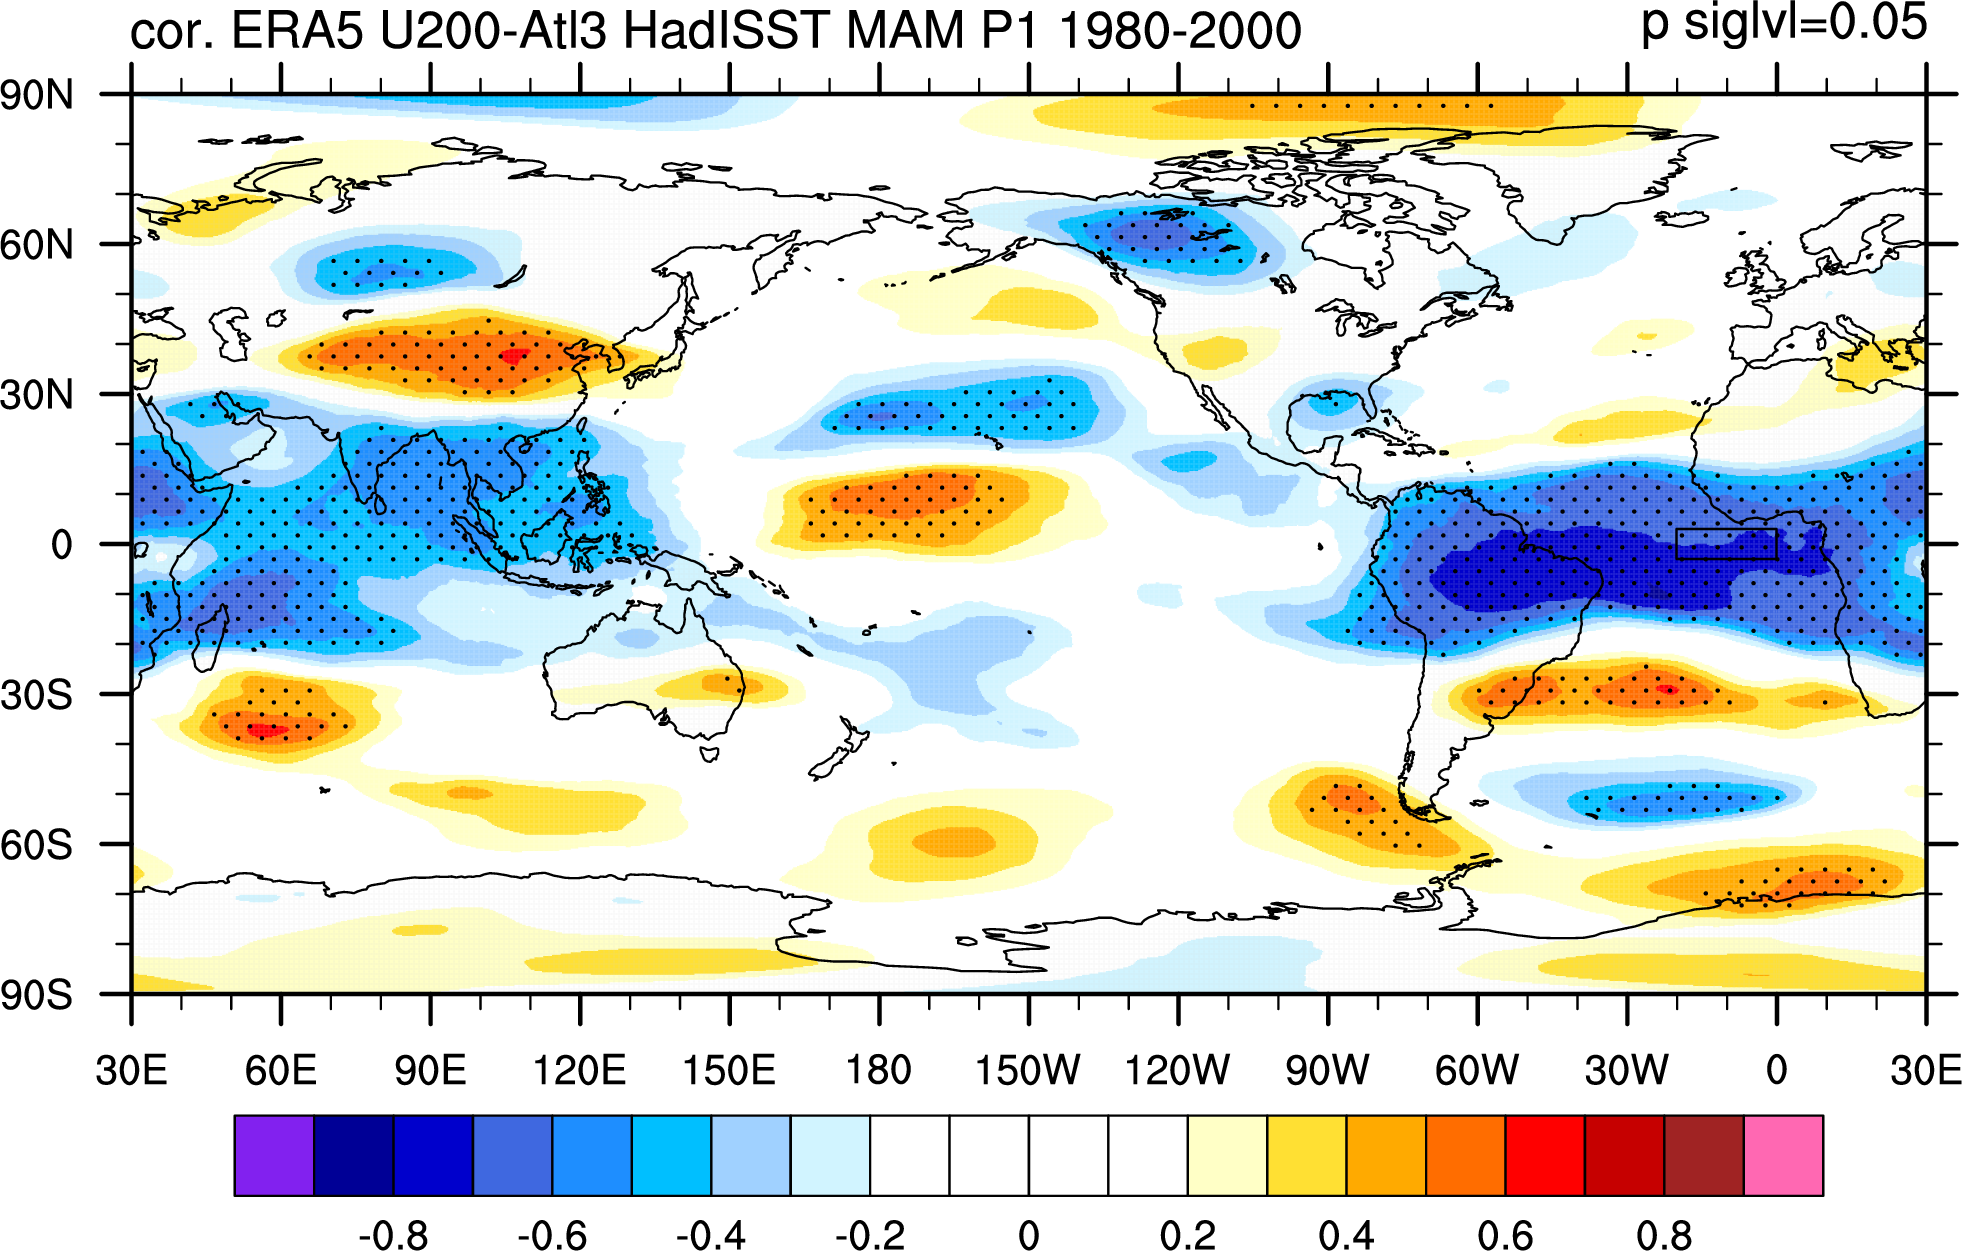
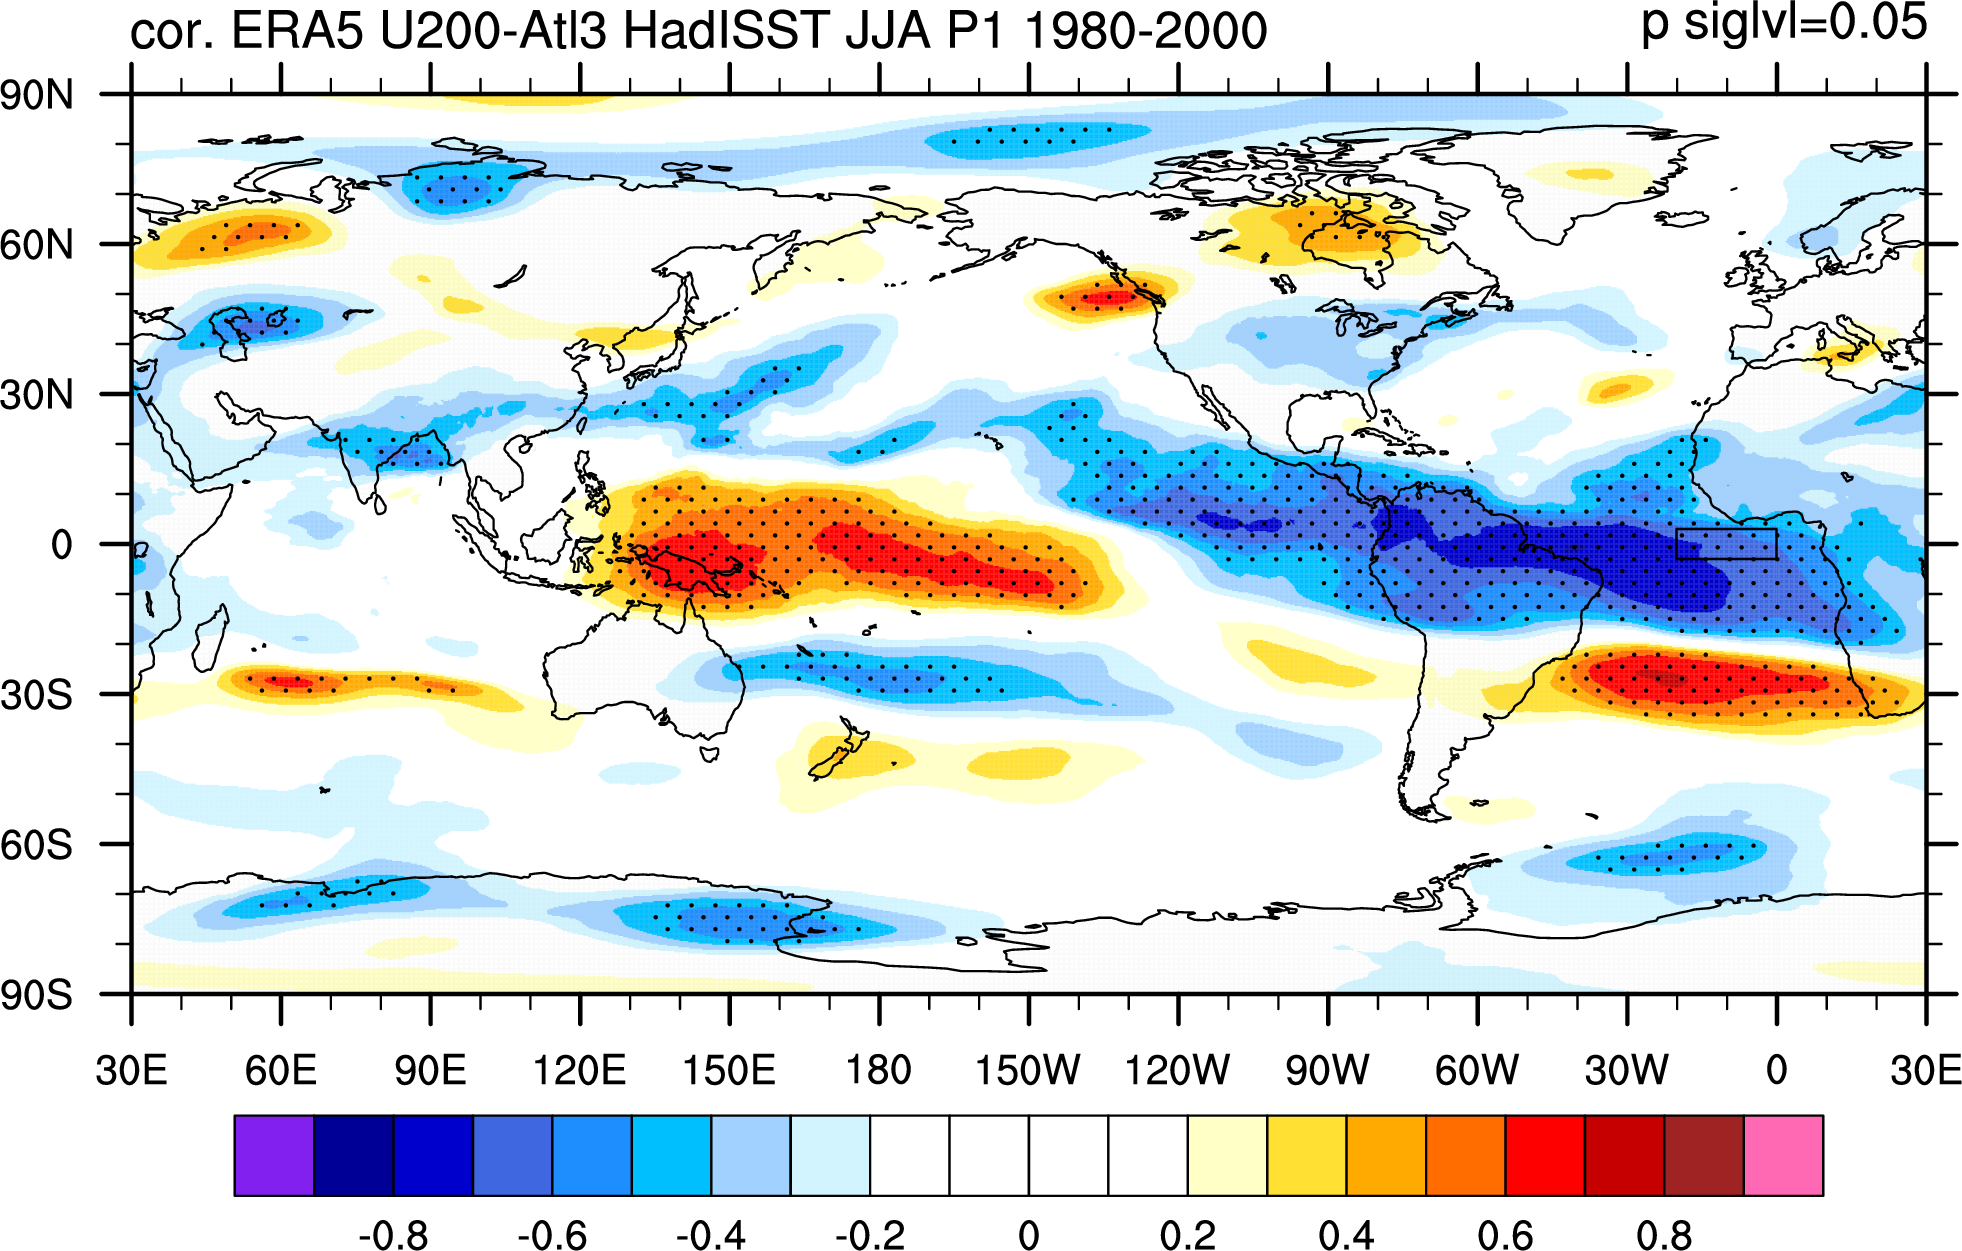
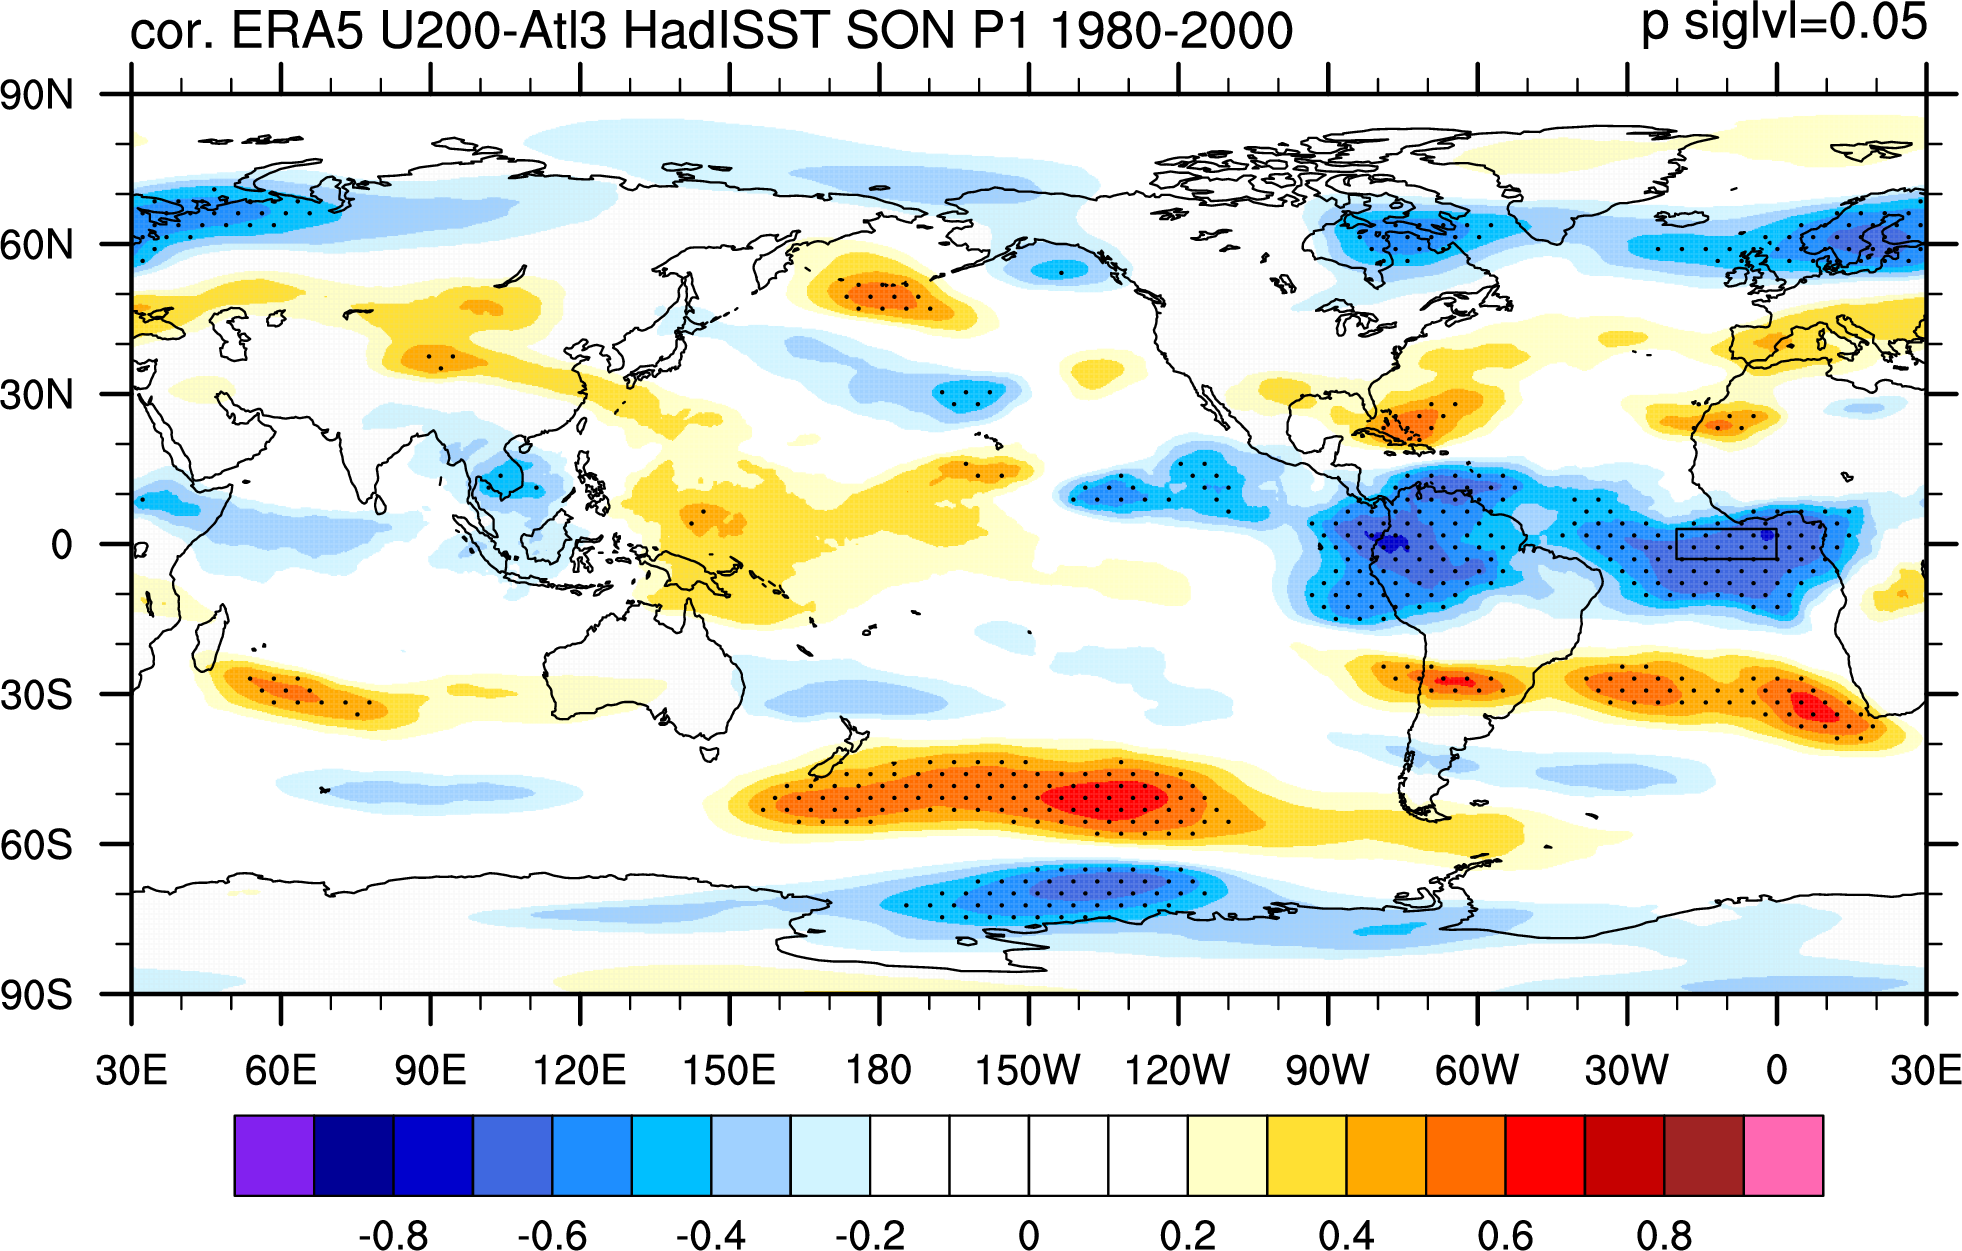
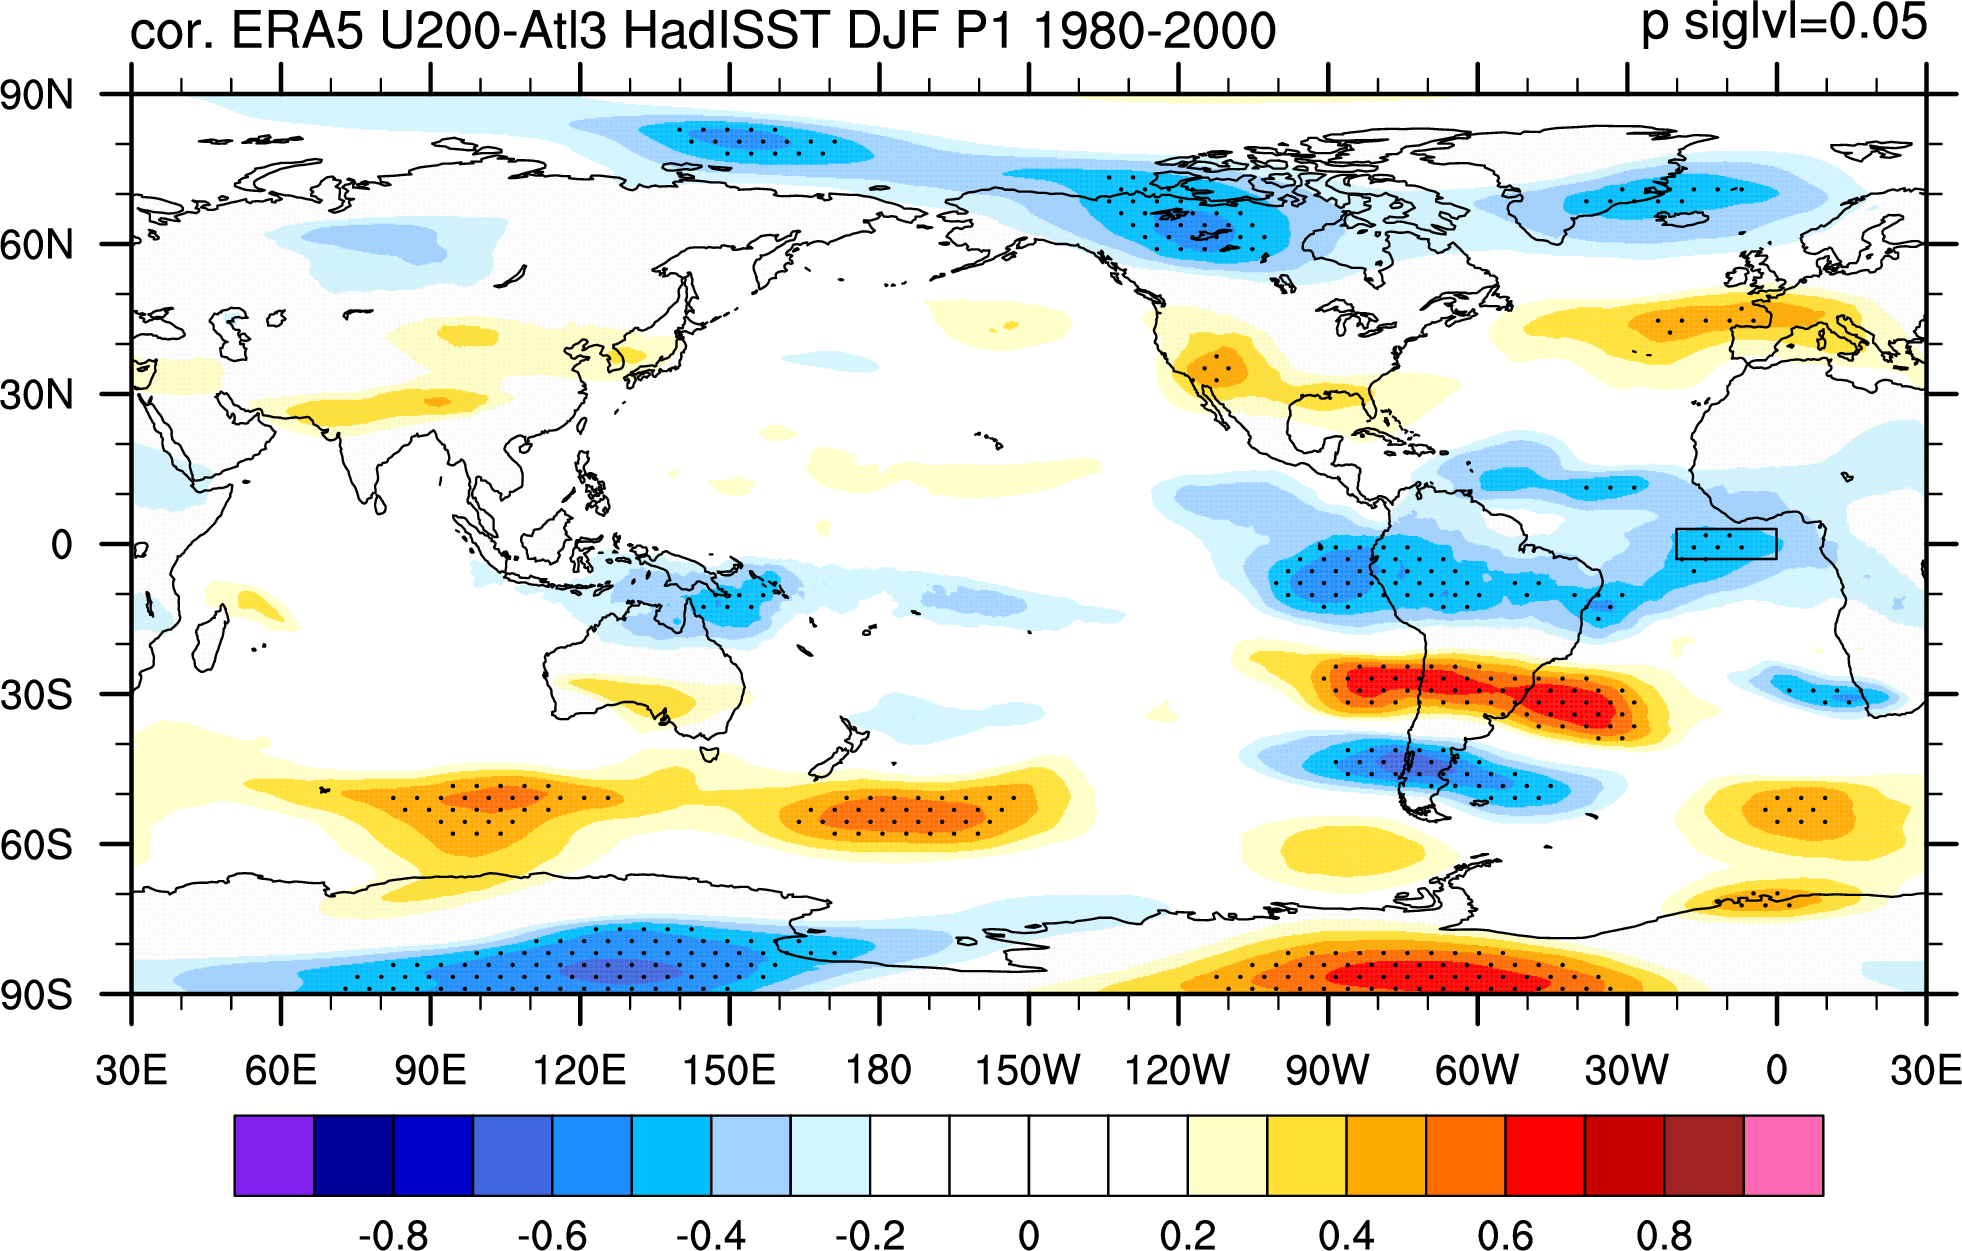
 The path from Atl3 to tropical west-mid Pacific maybe via higher level(200hPa):
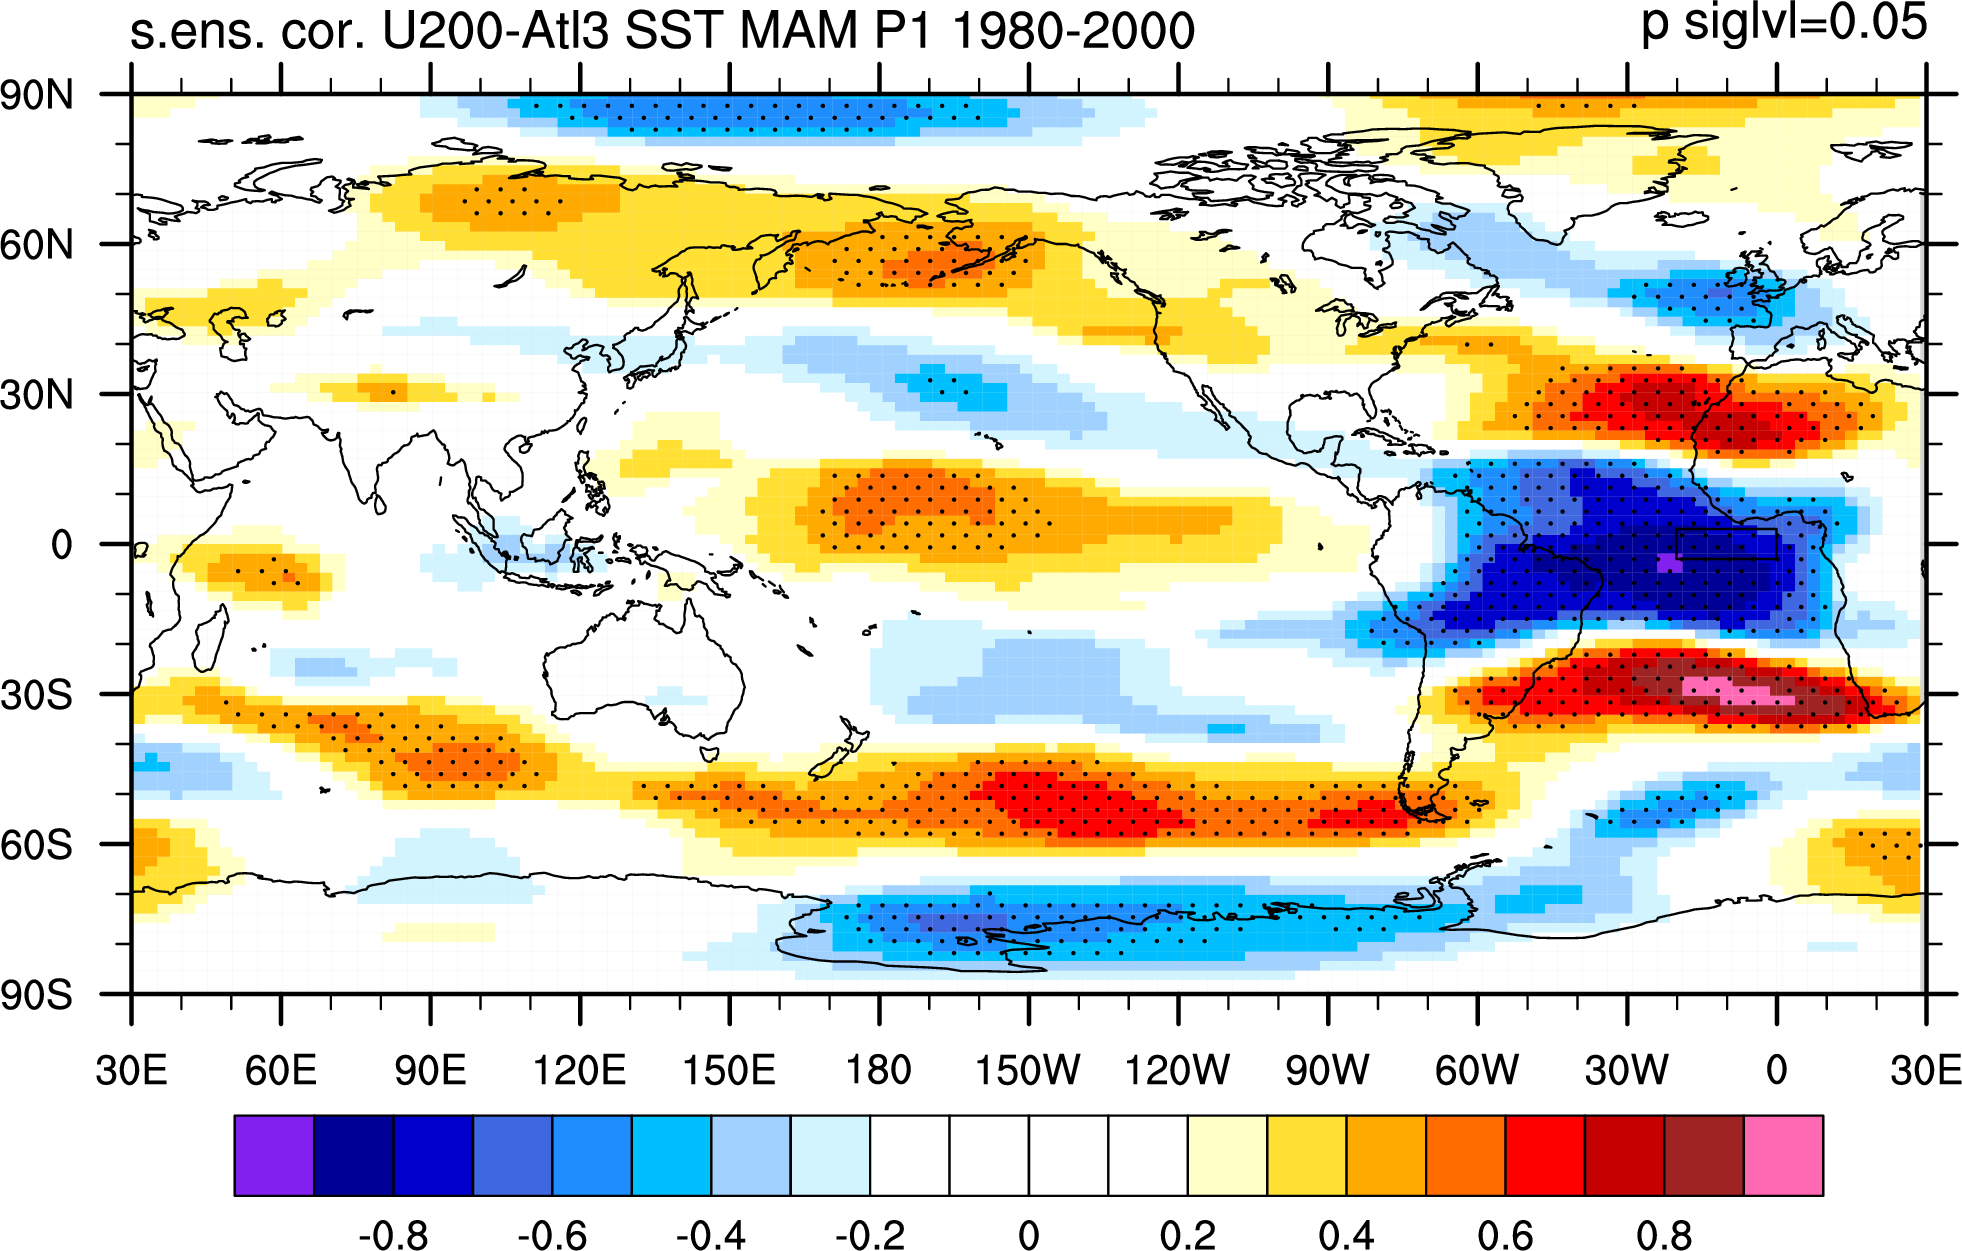
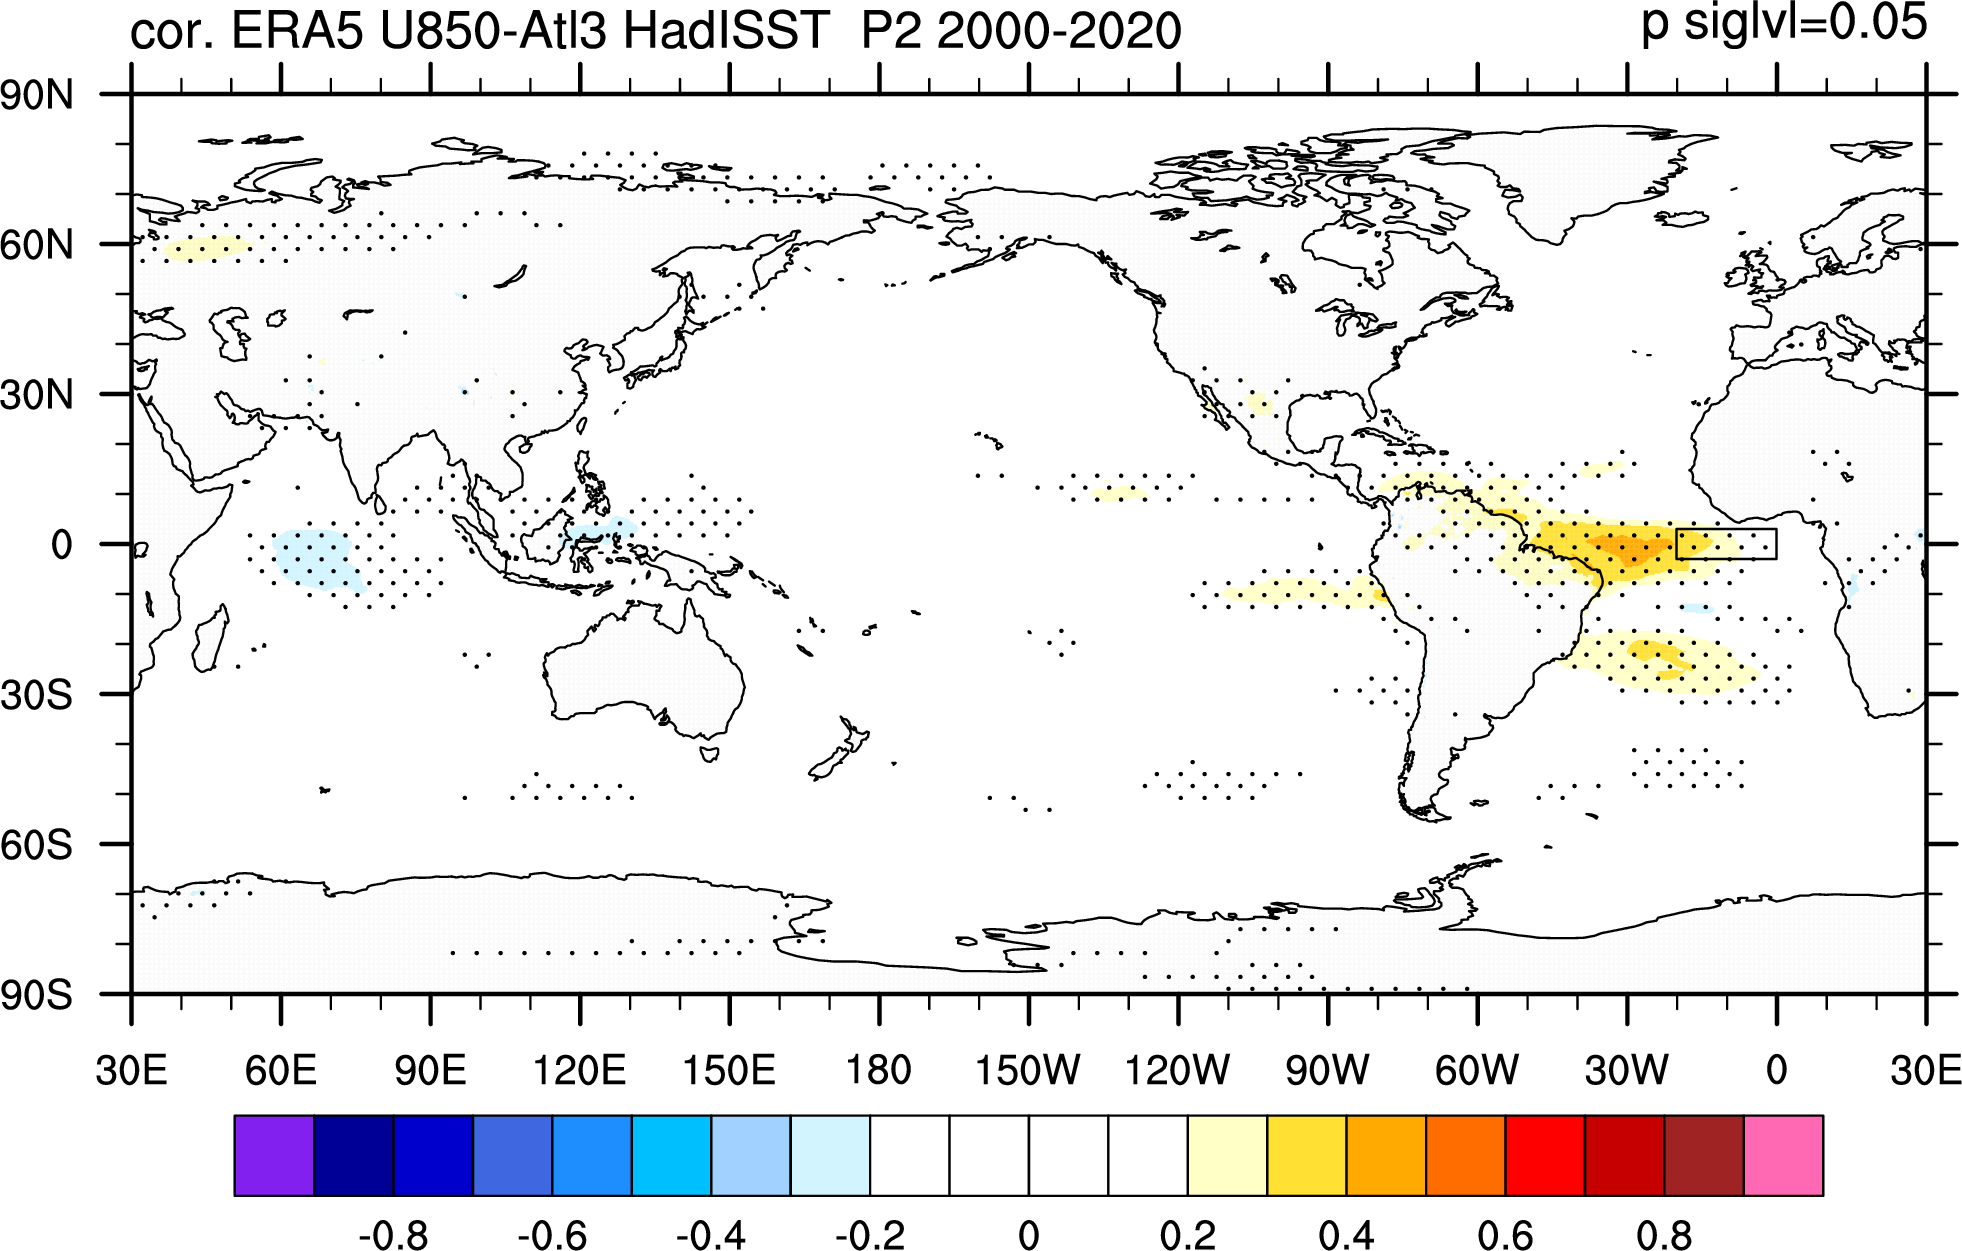
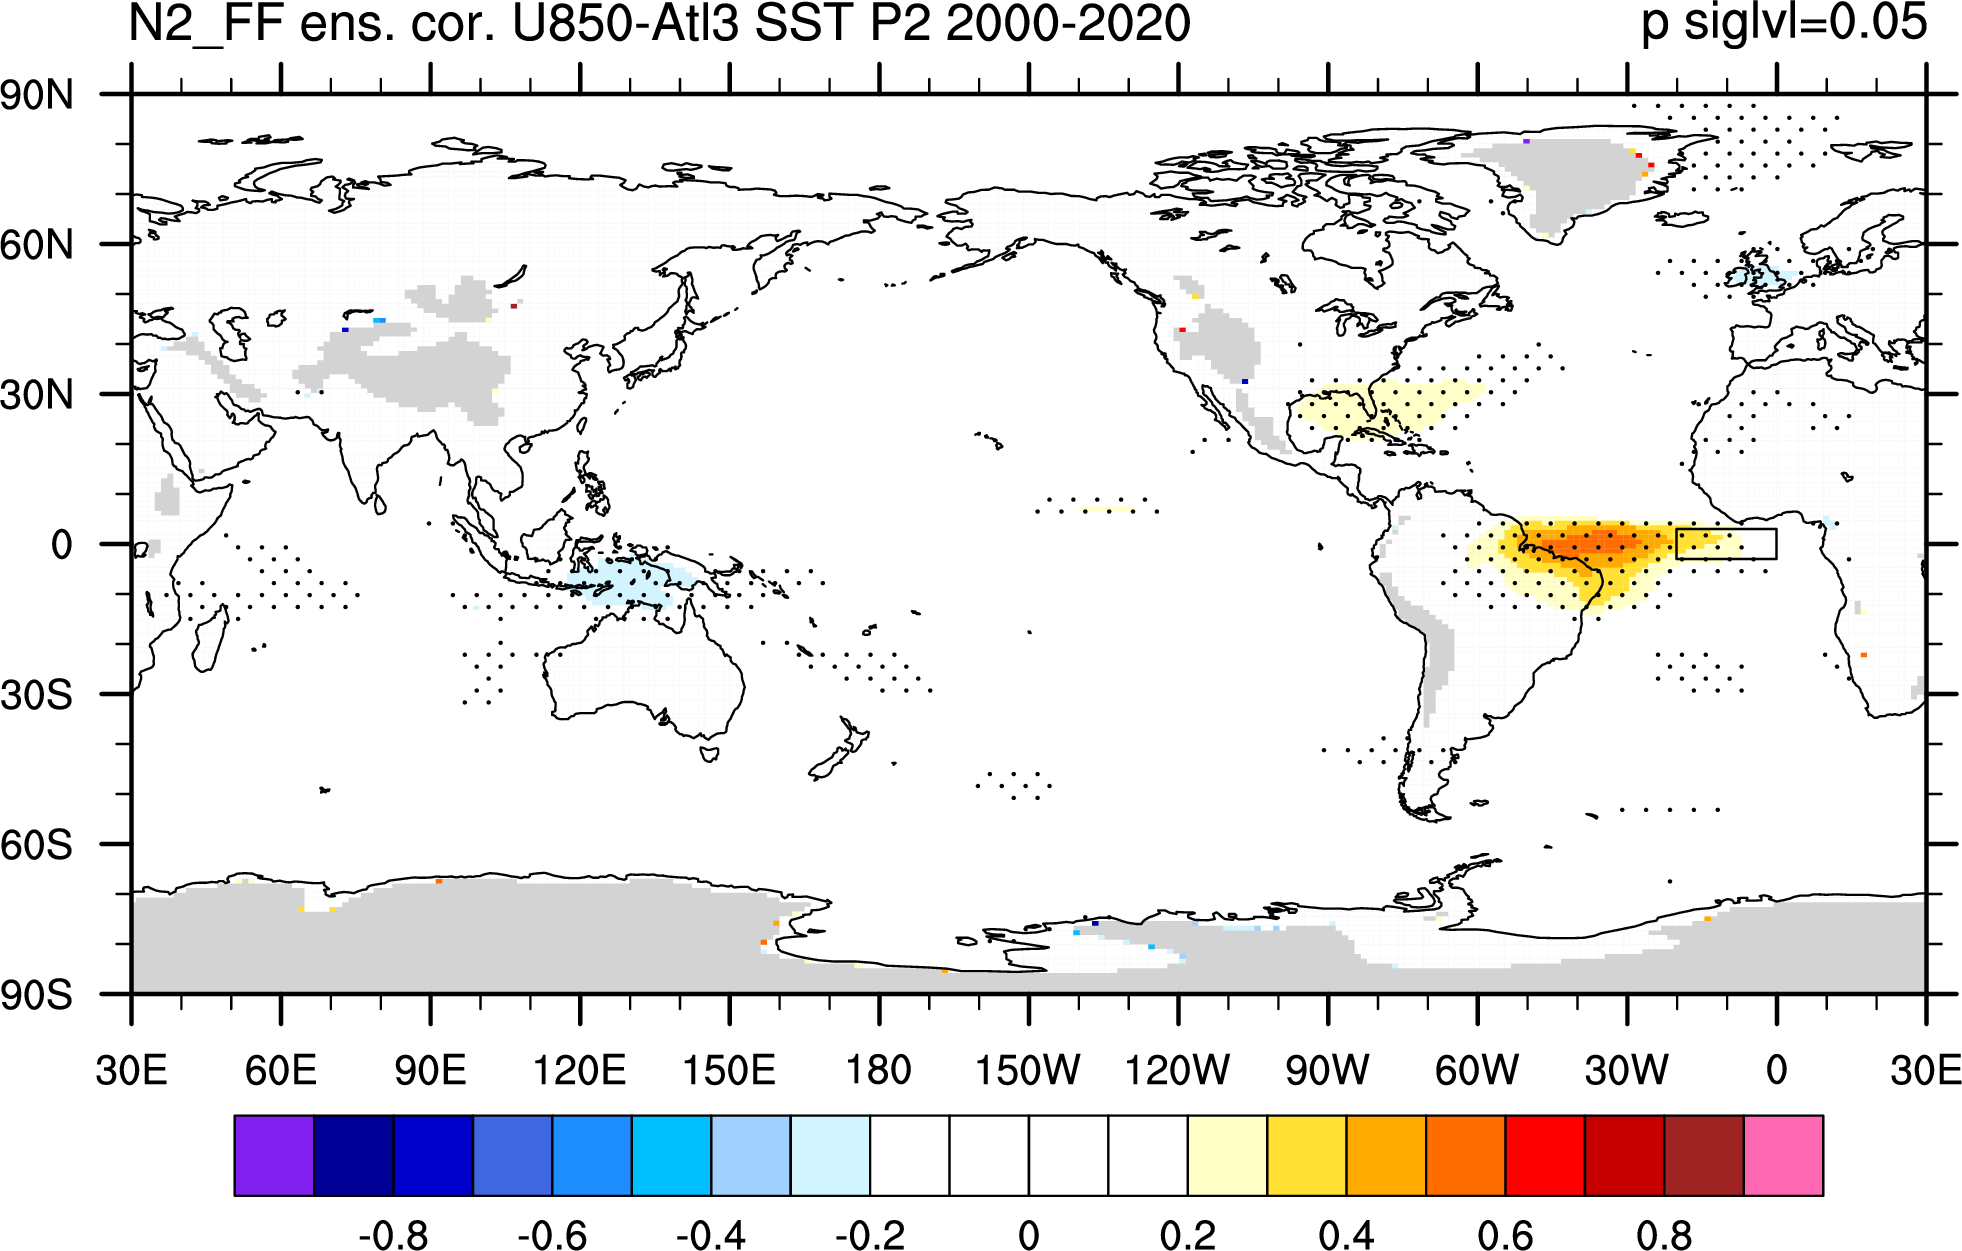
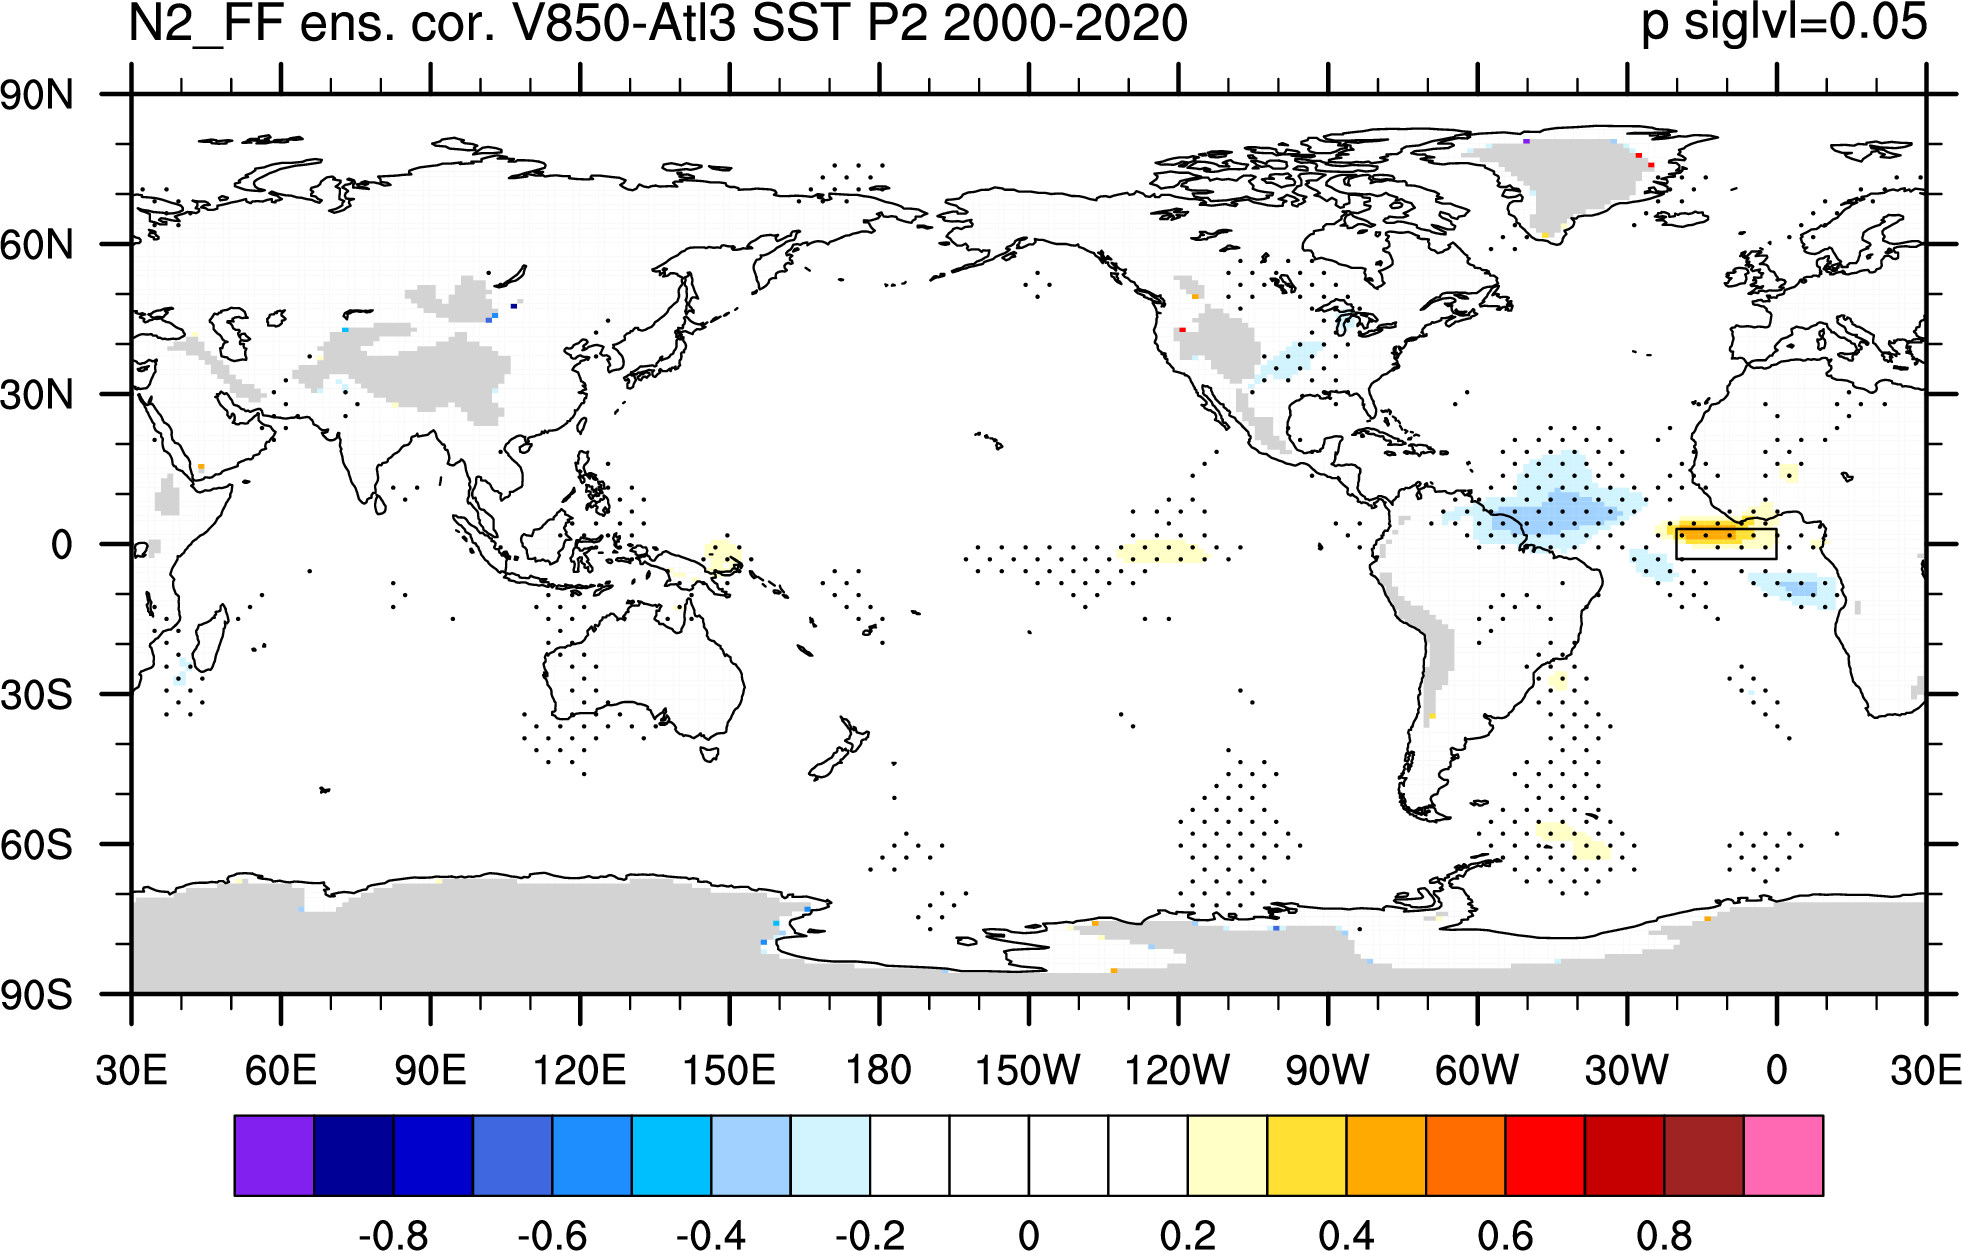
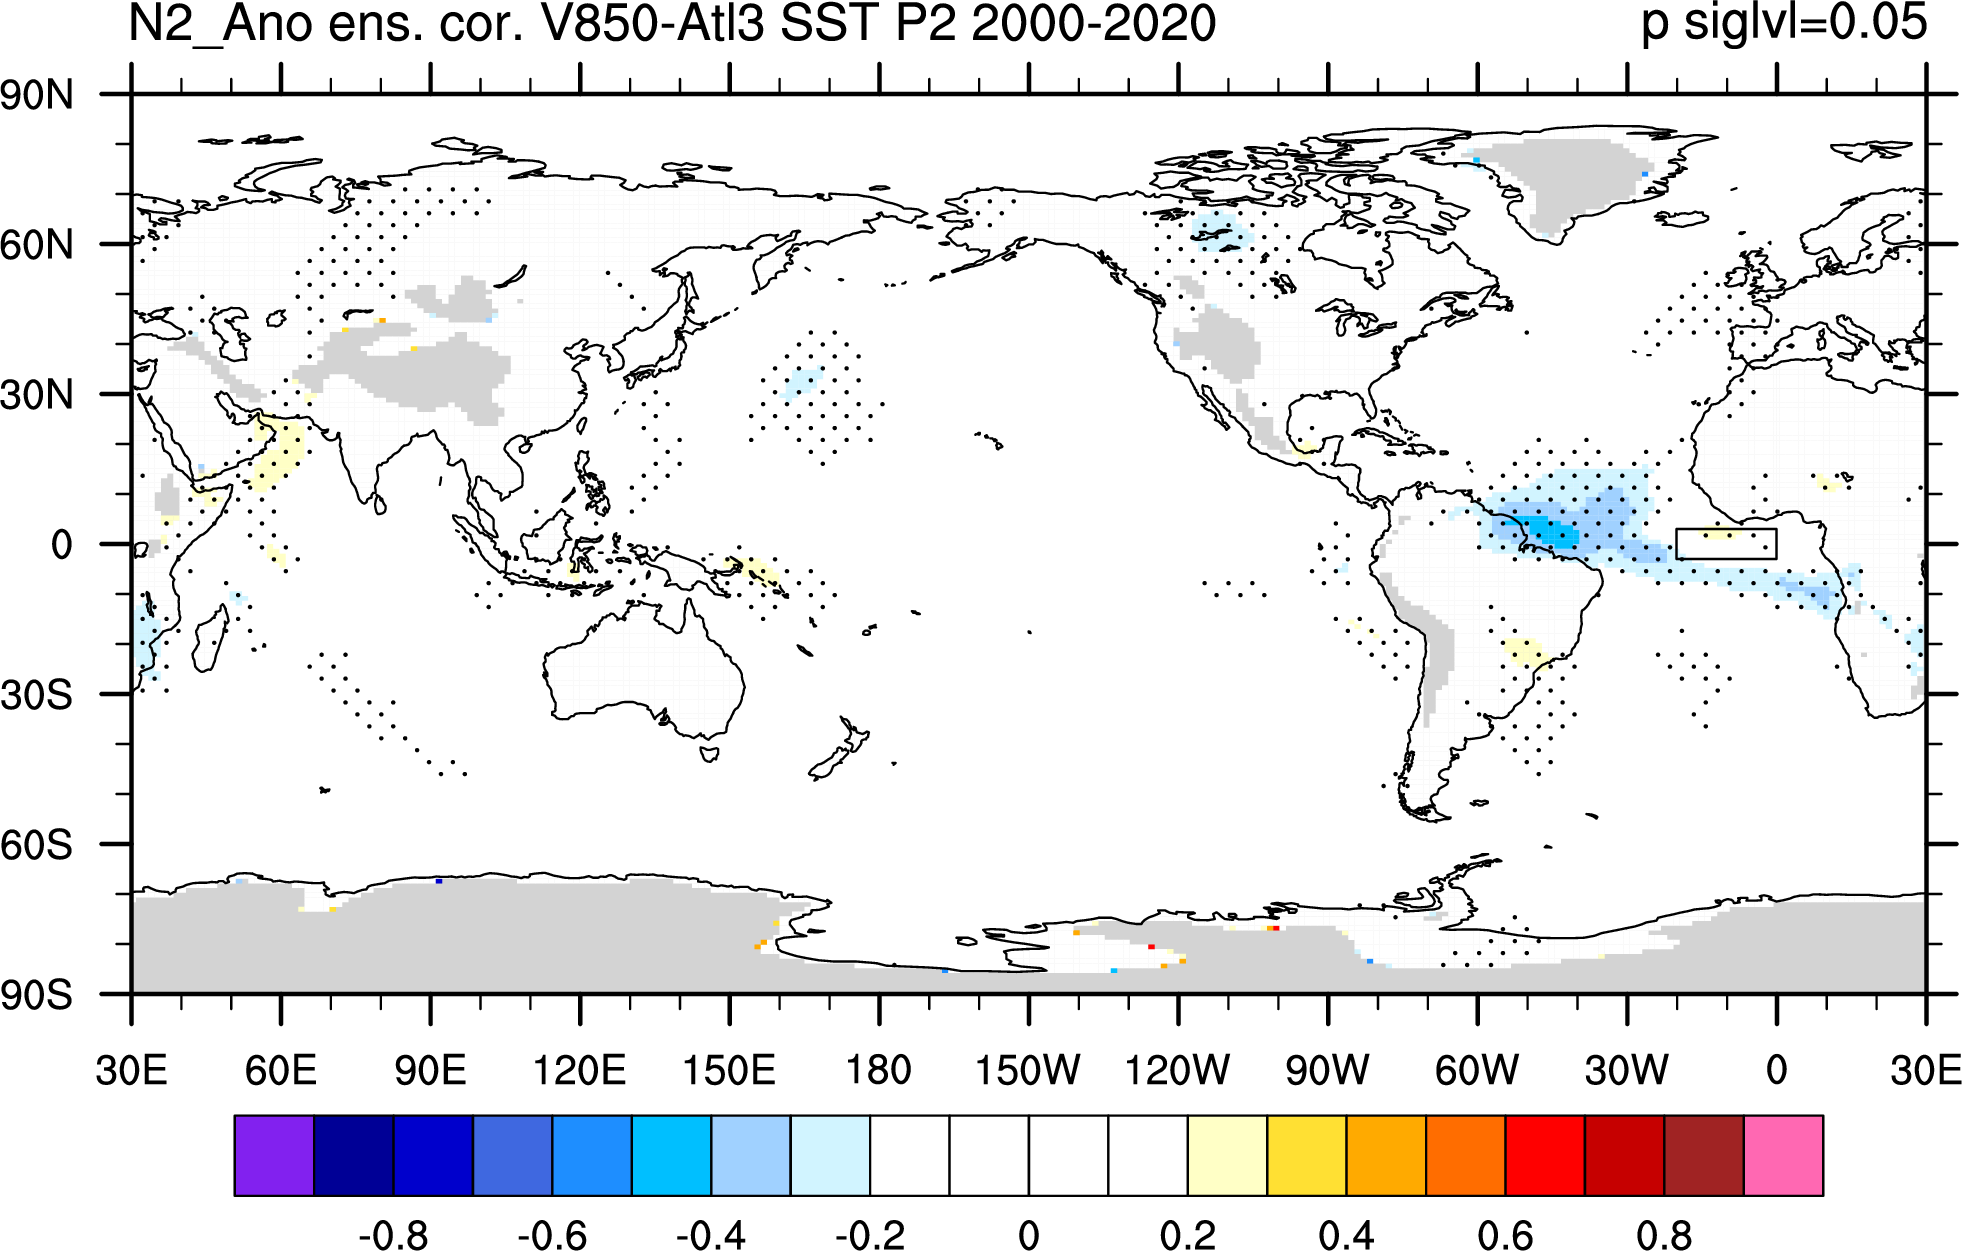
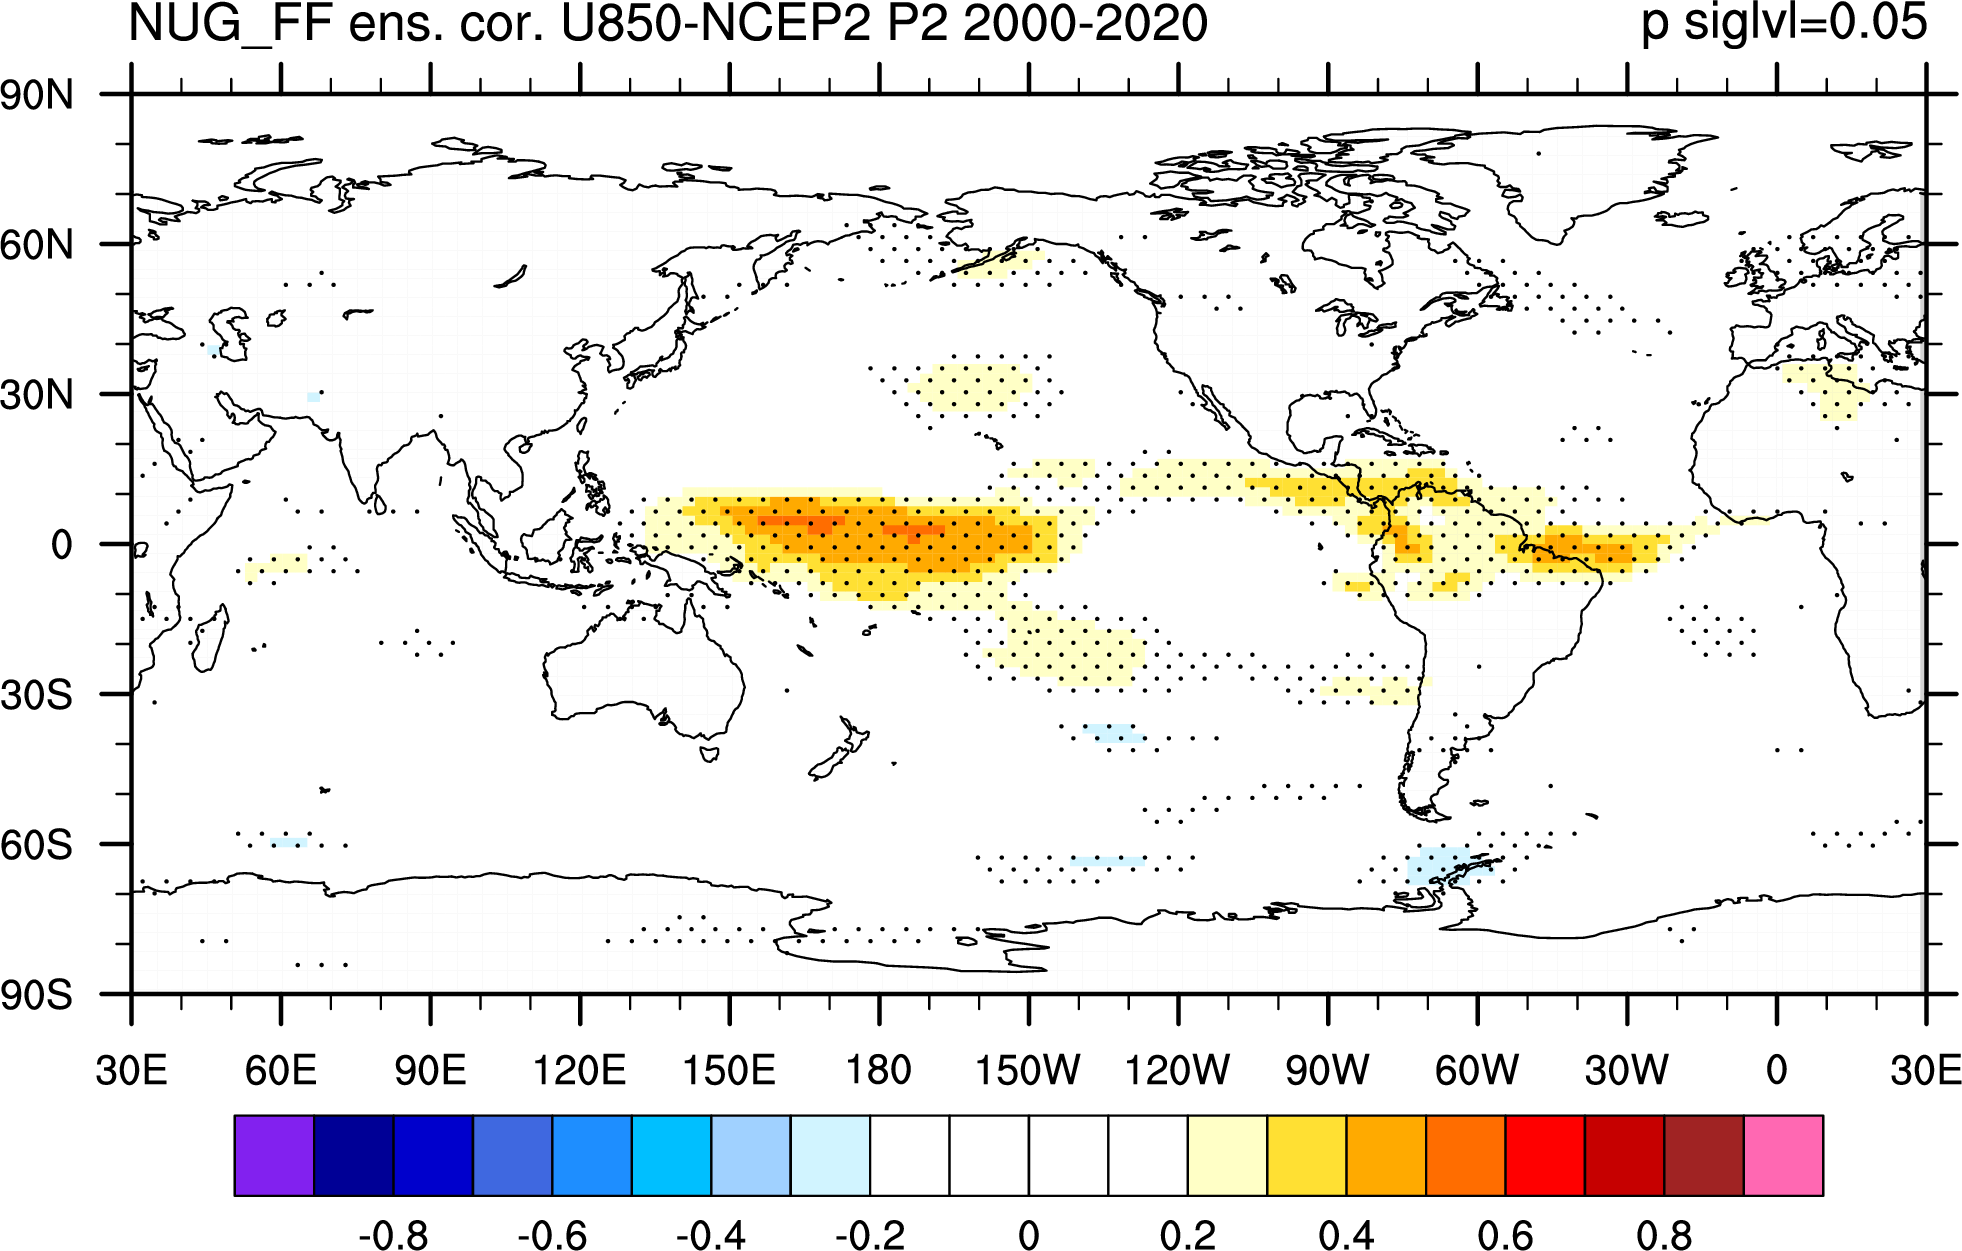
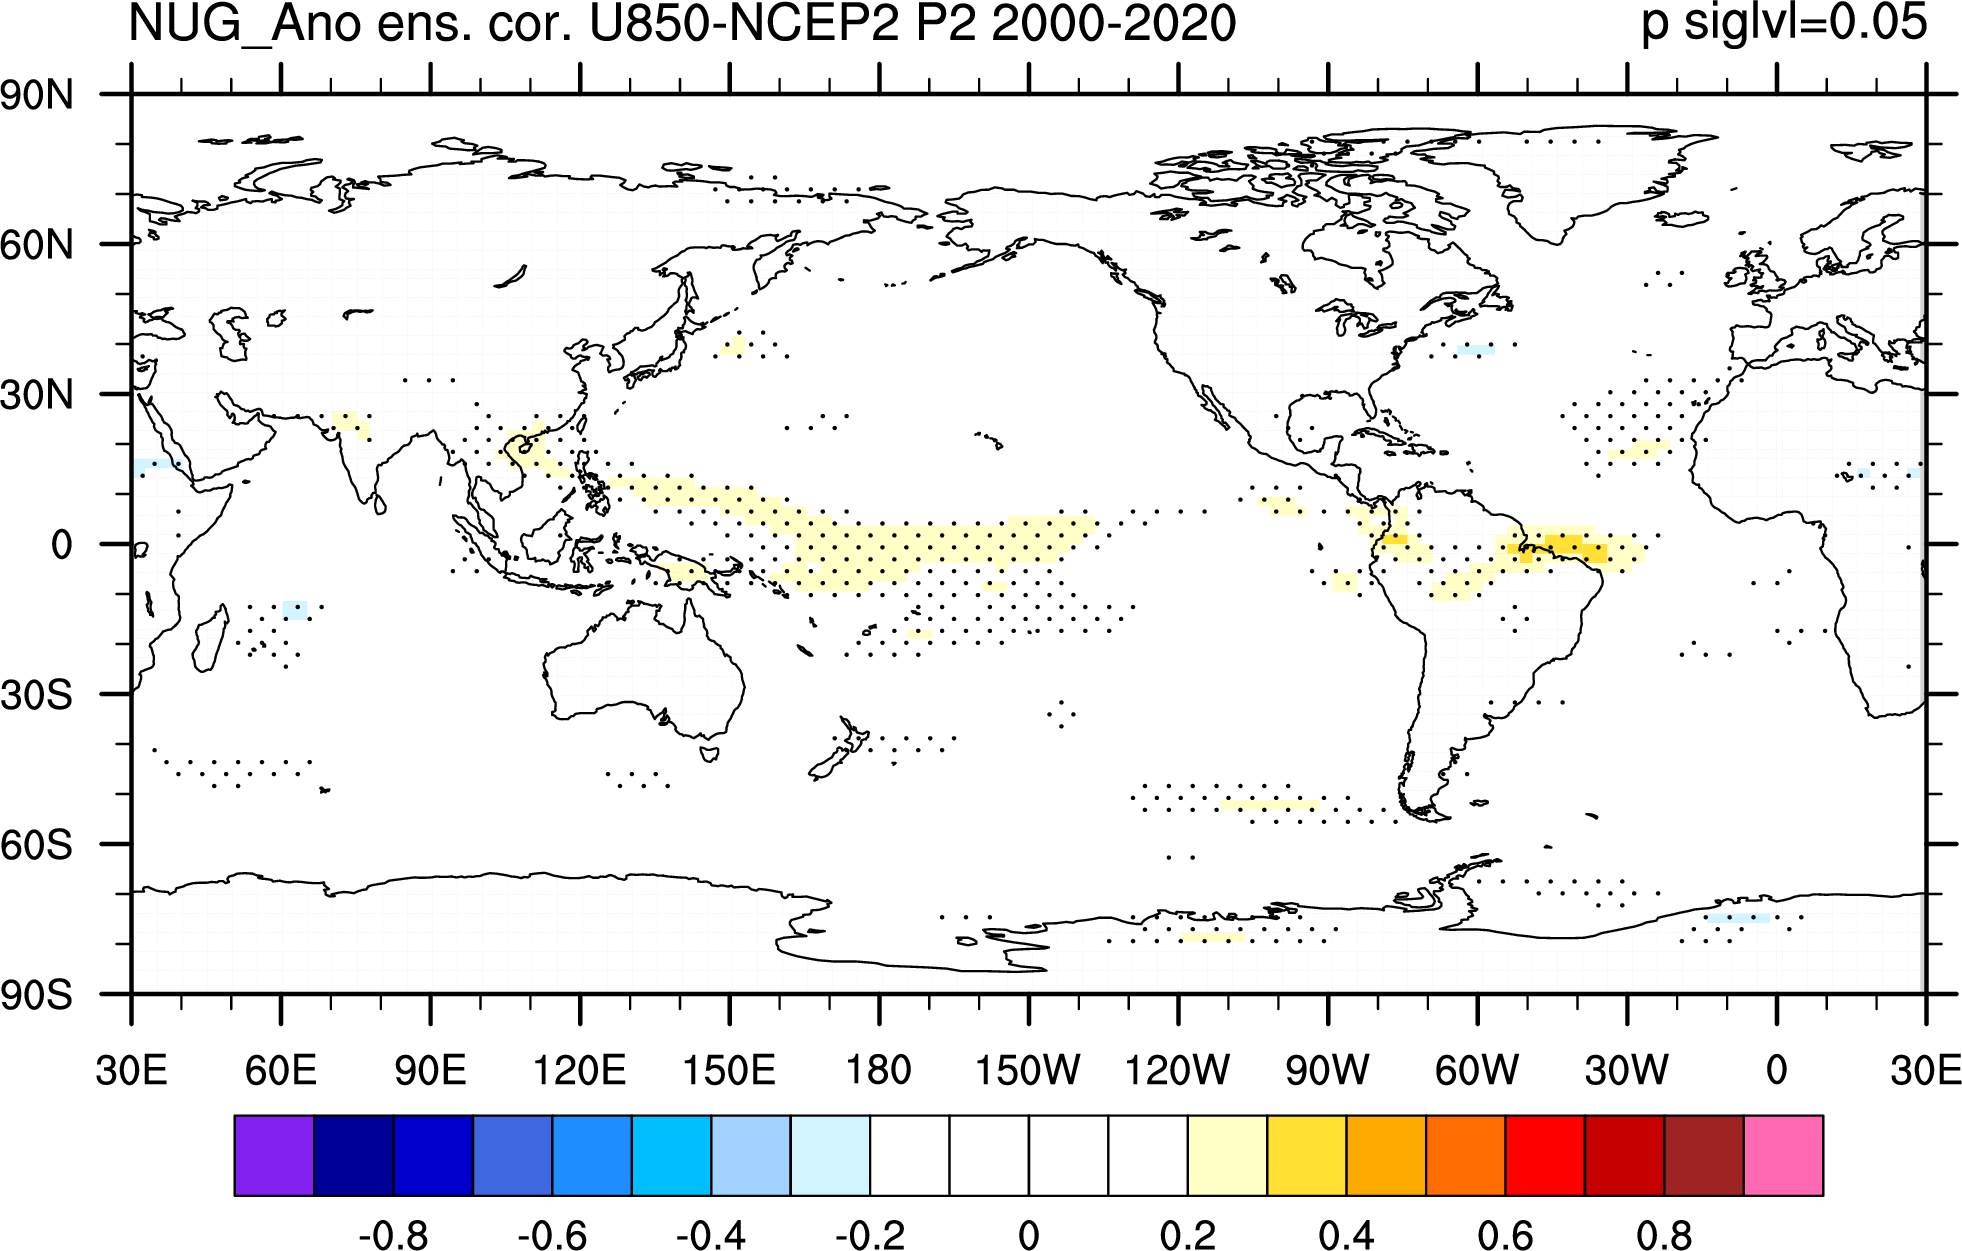
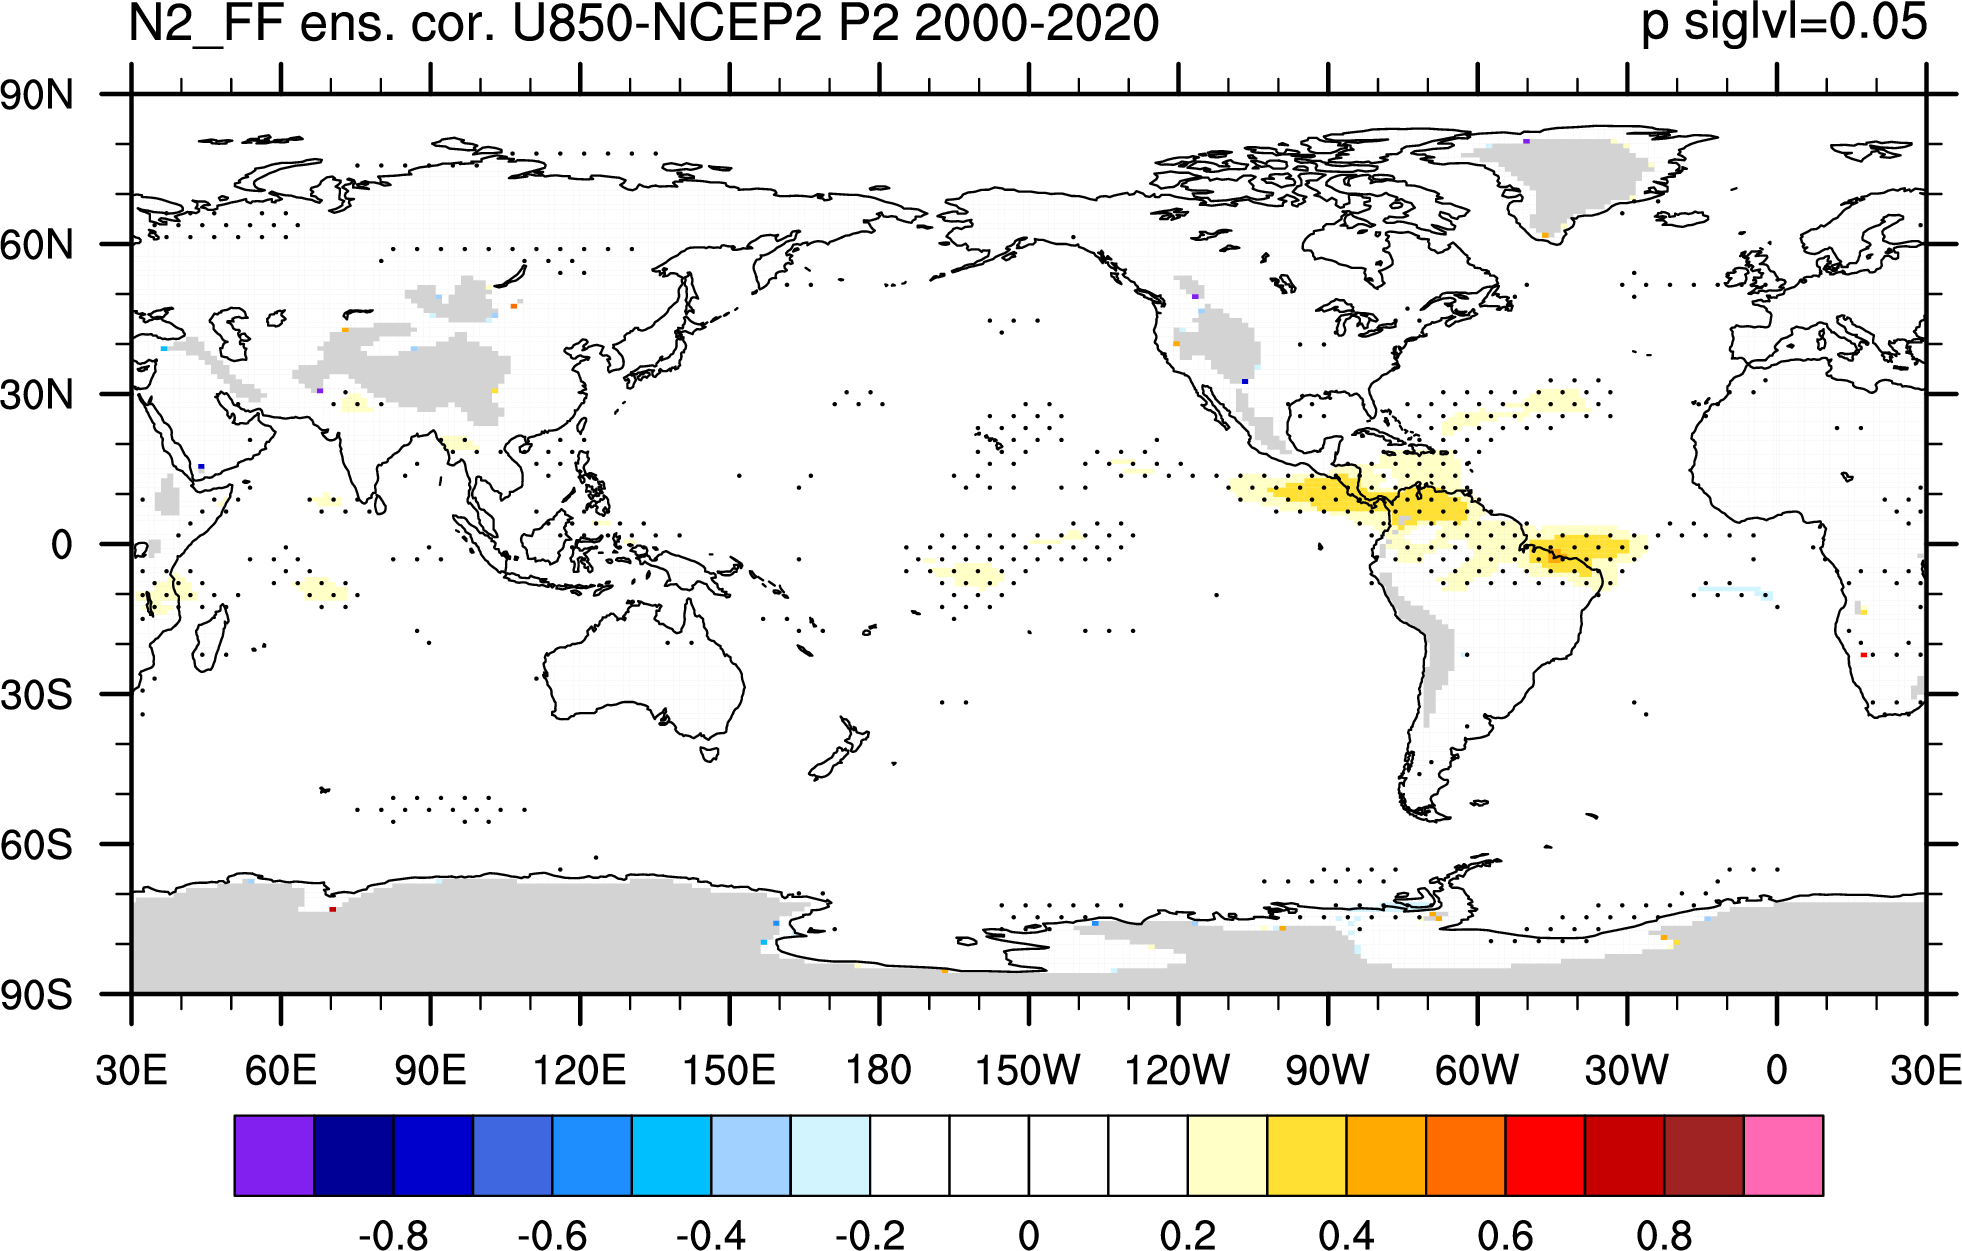
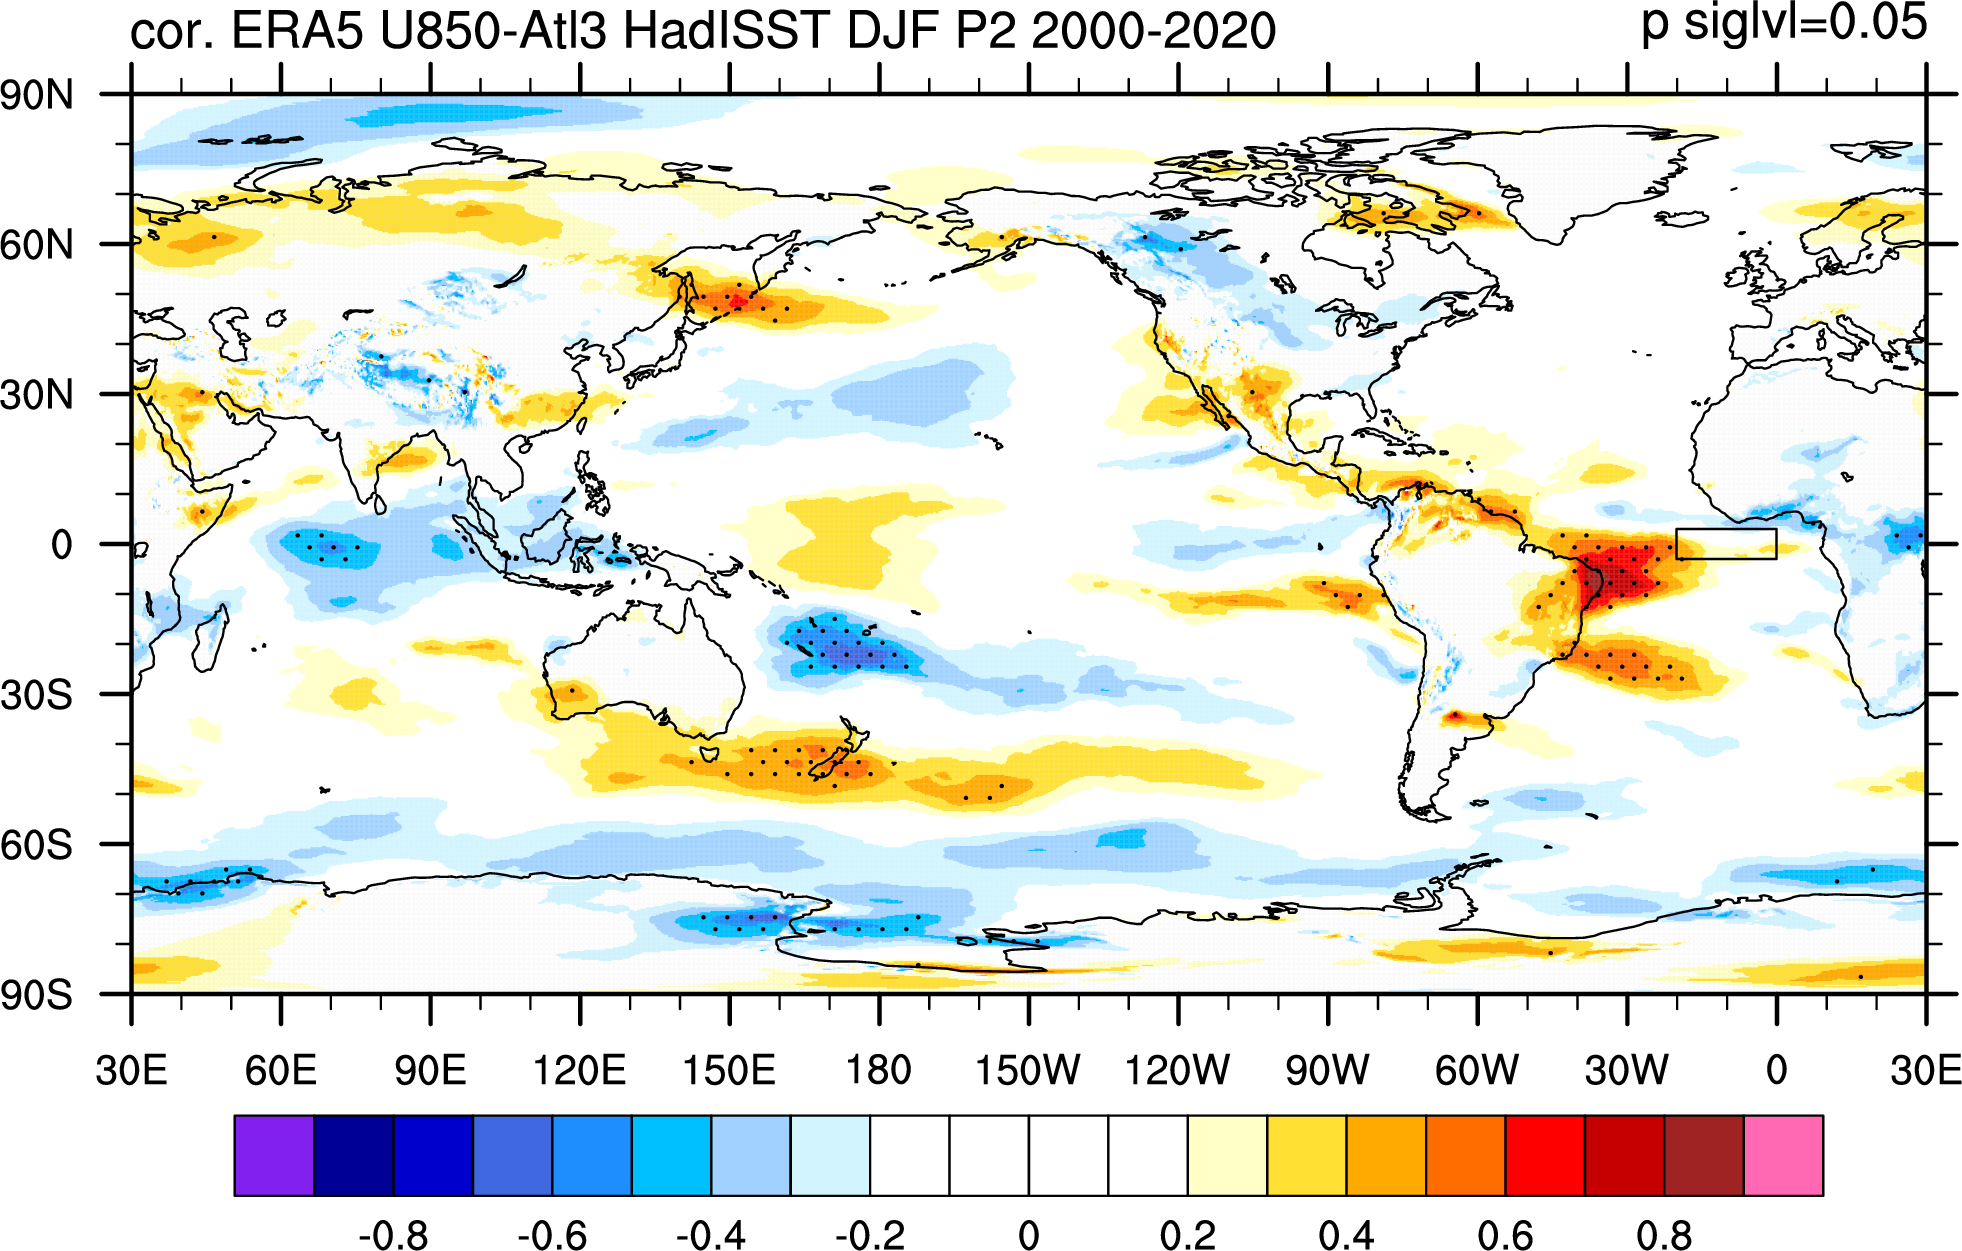
 This connection does not singificant at 2000-2020 850hPa:
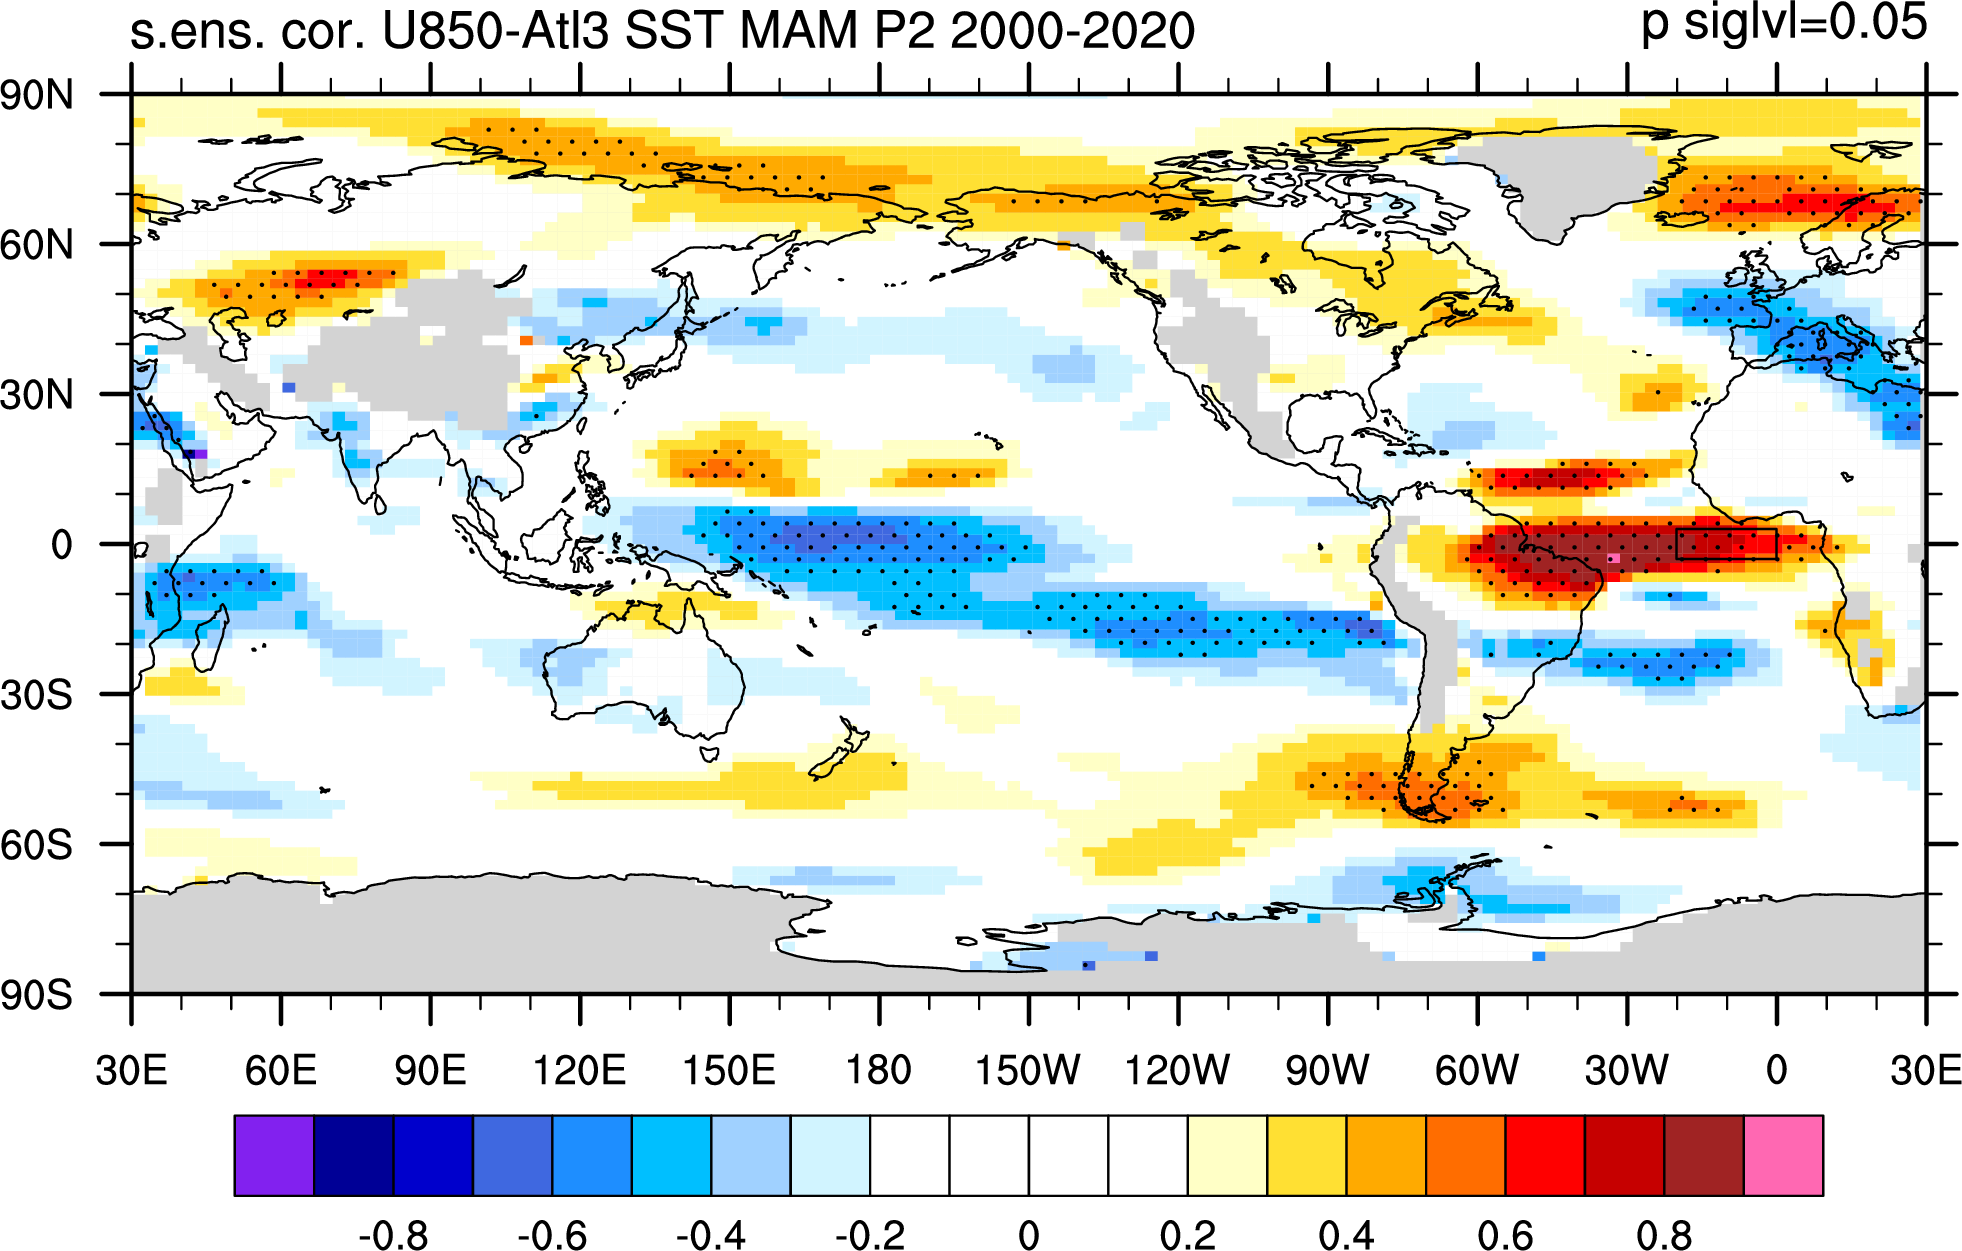


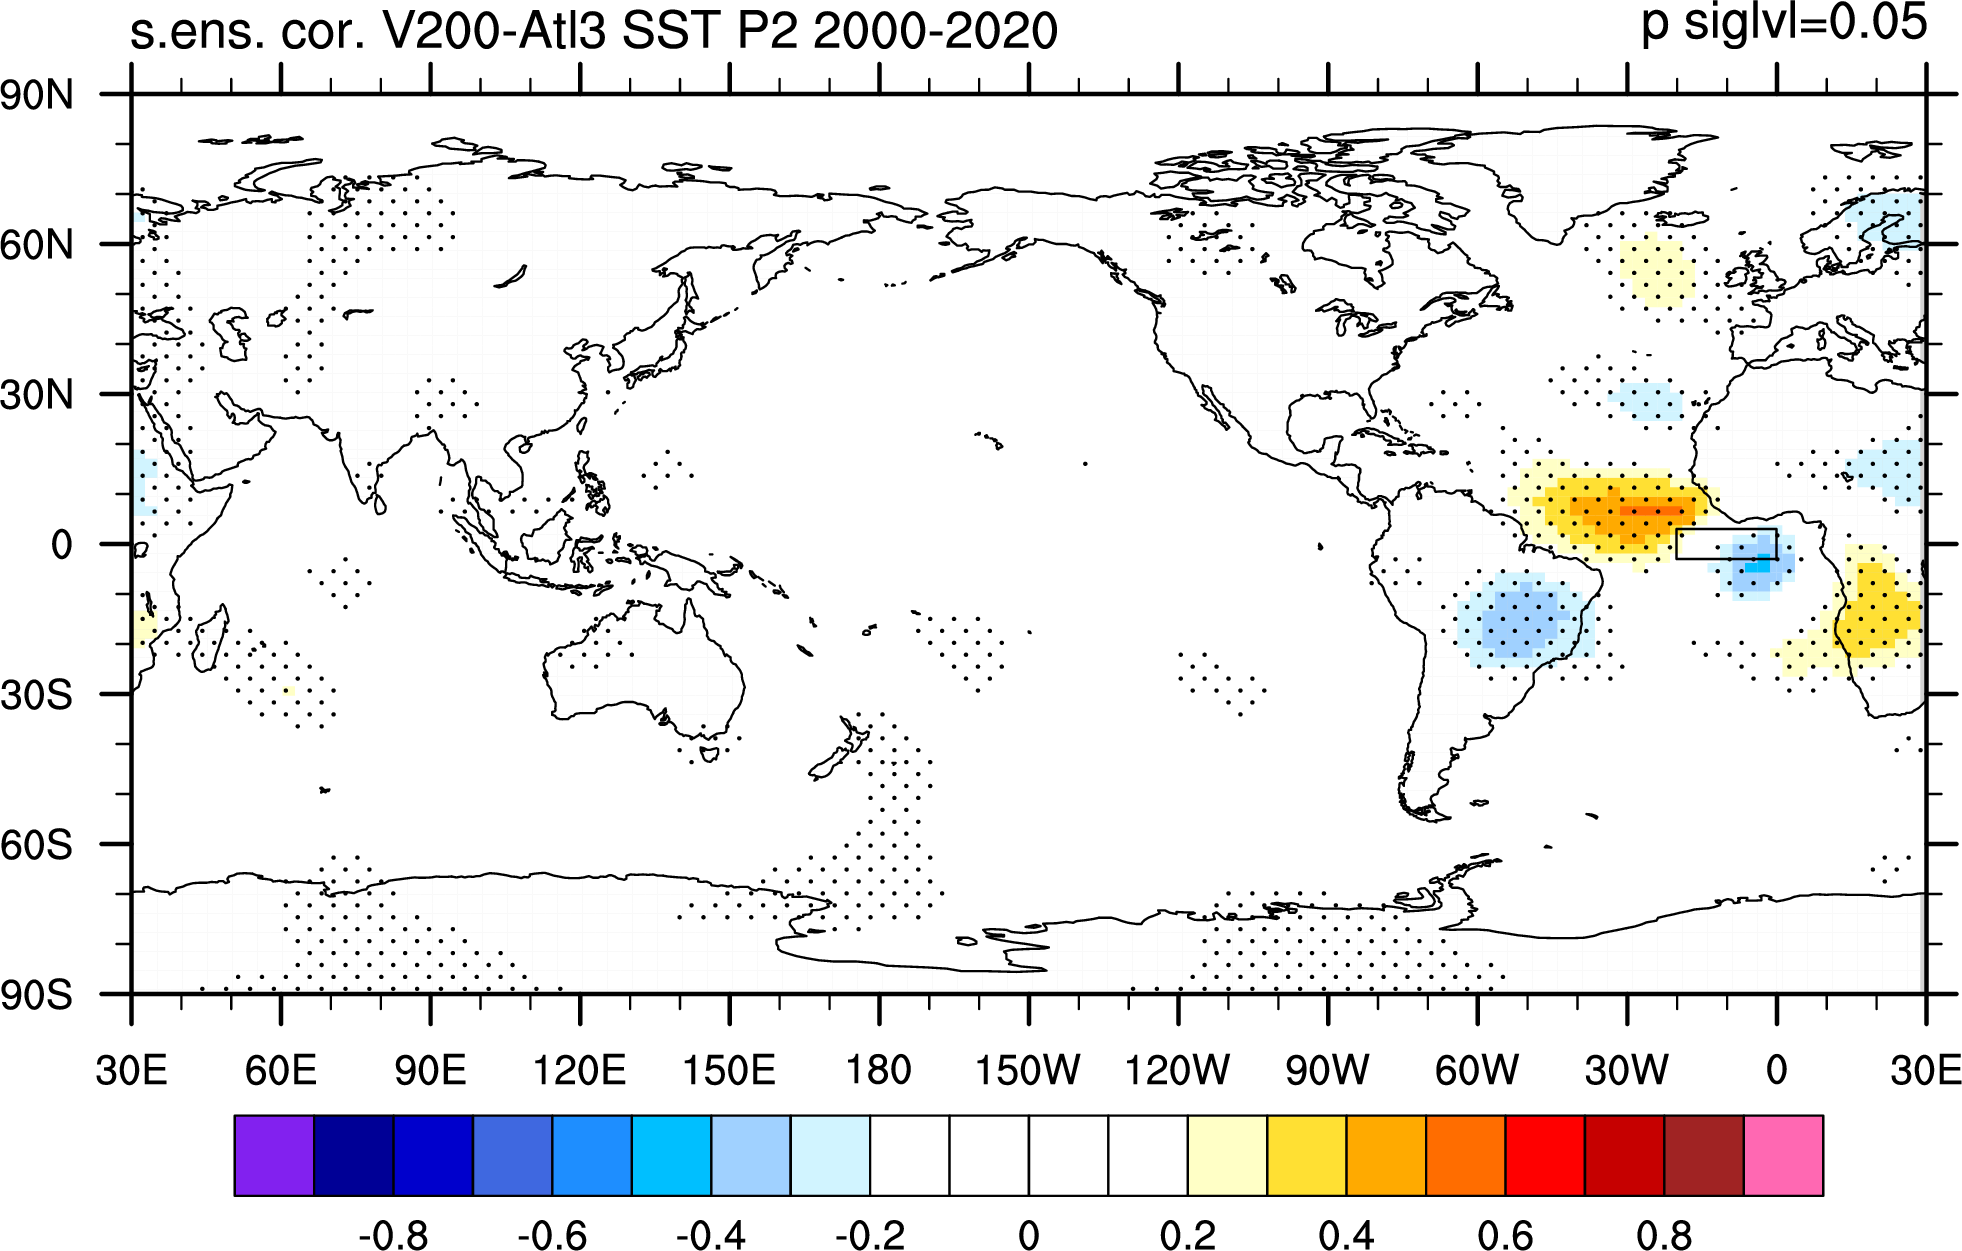
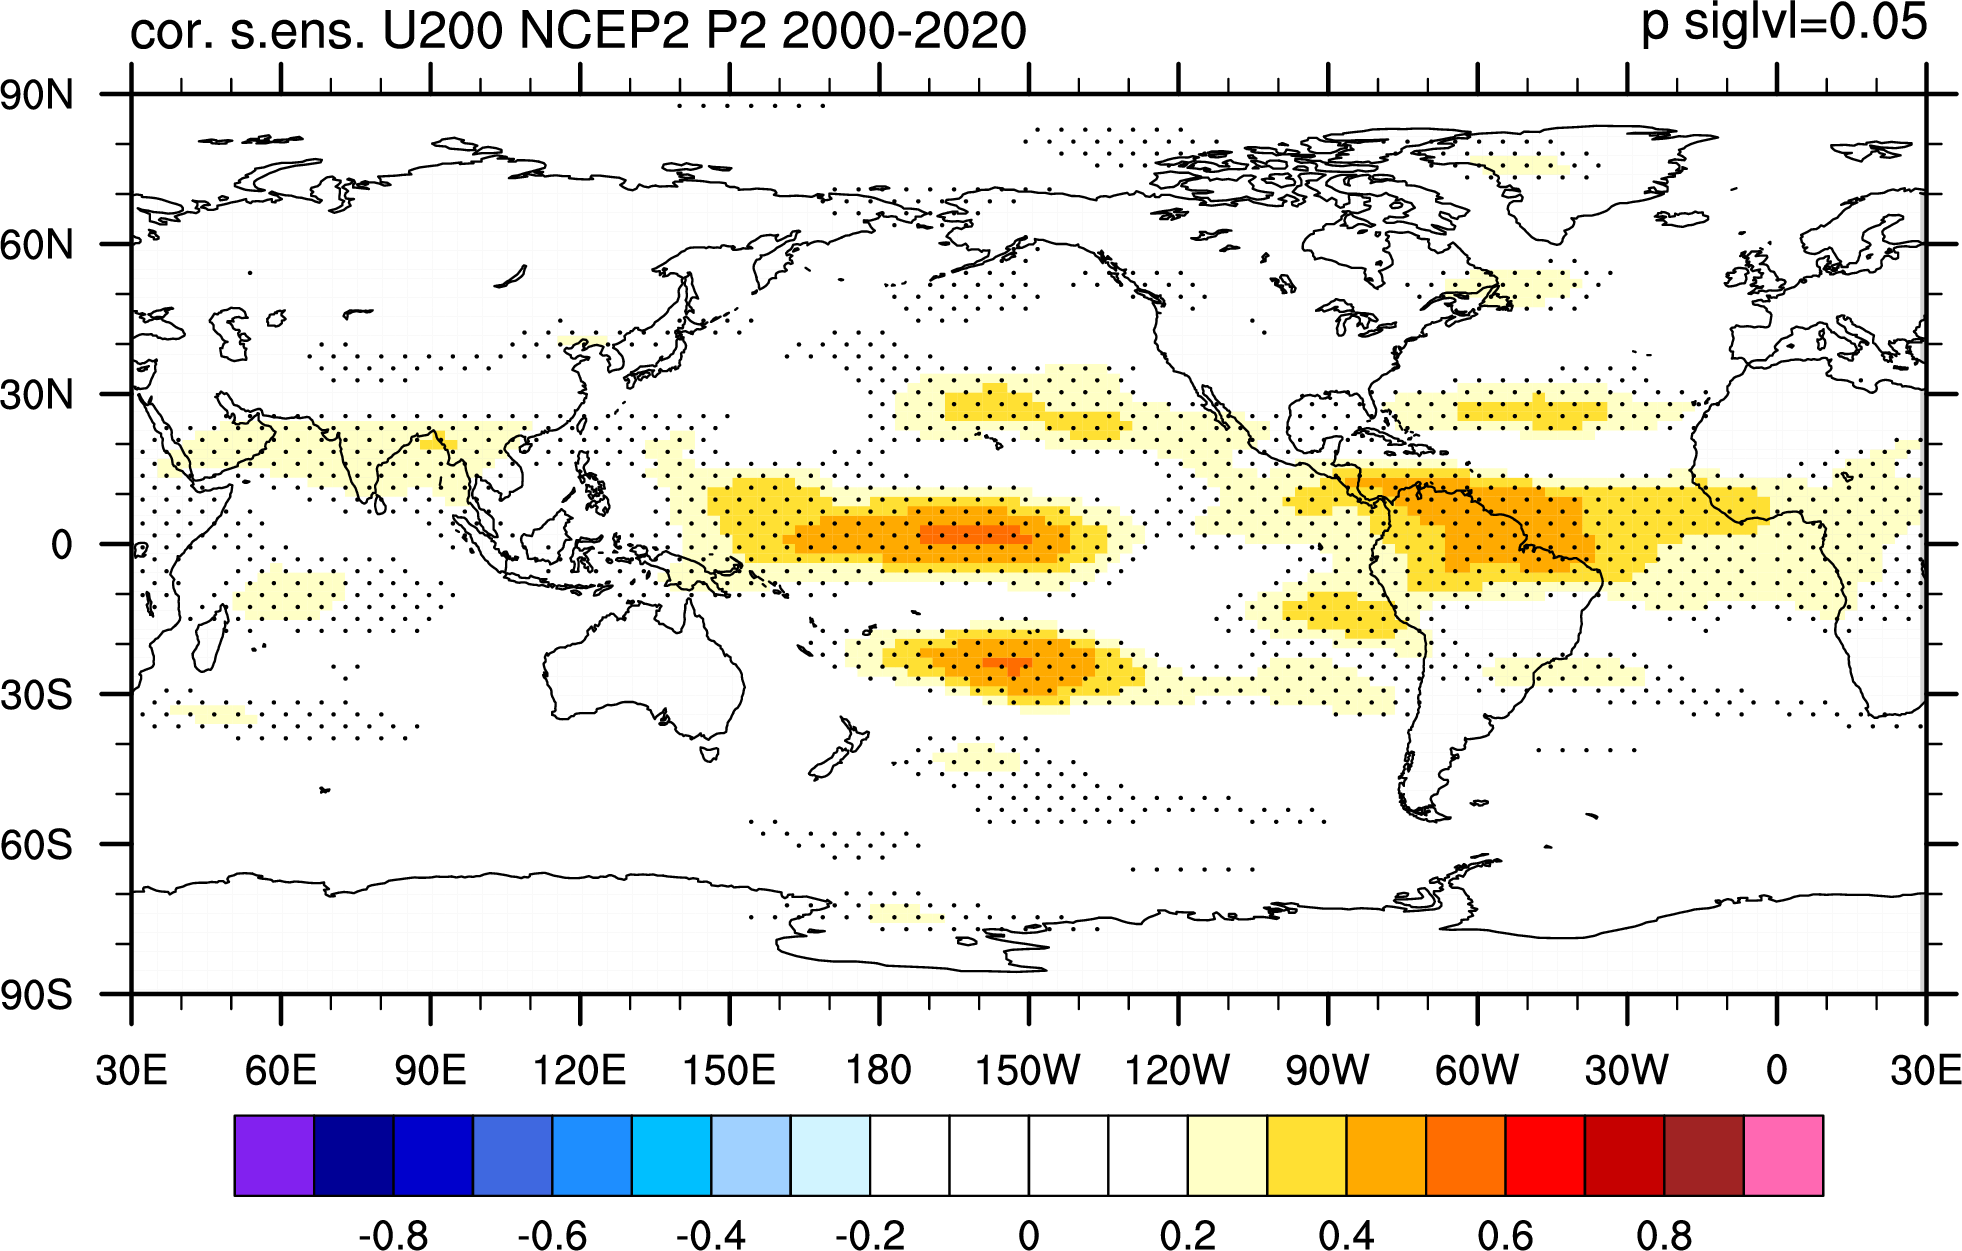
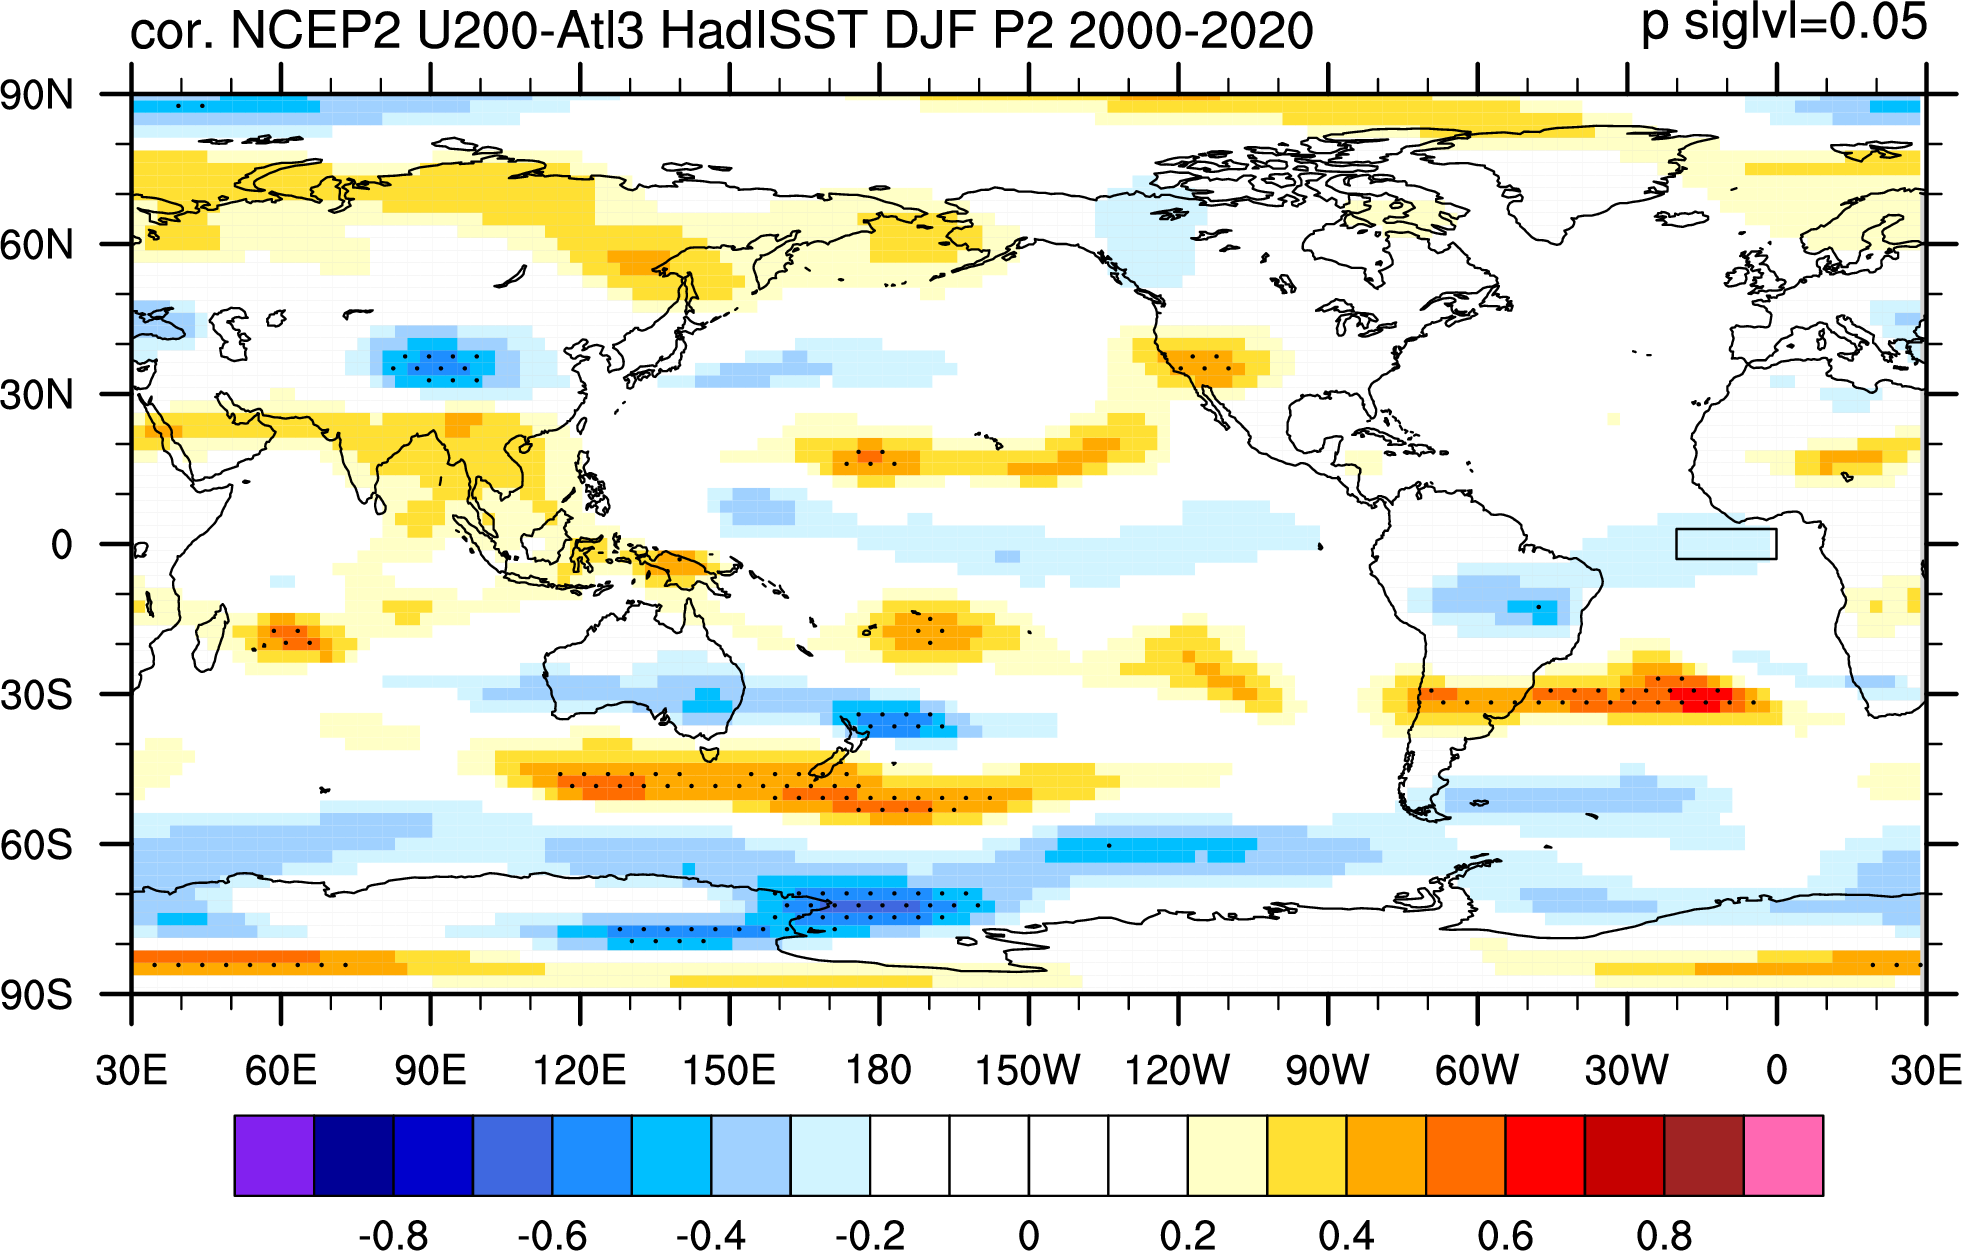
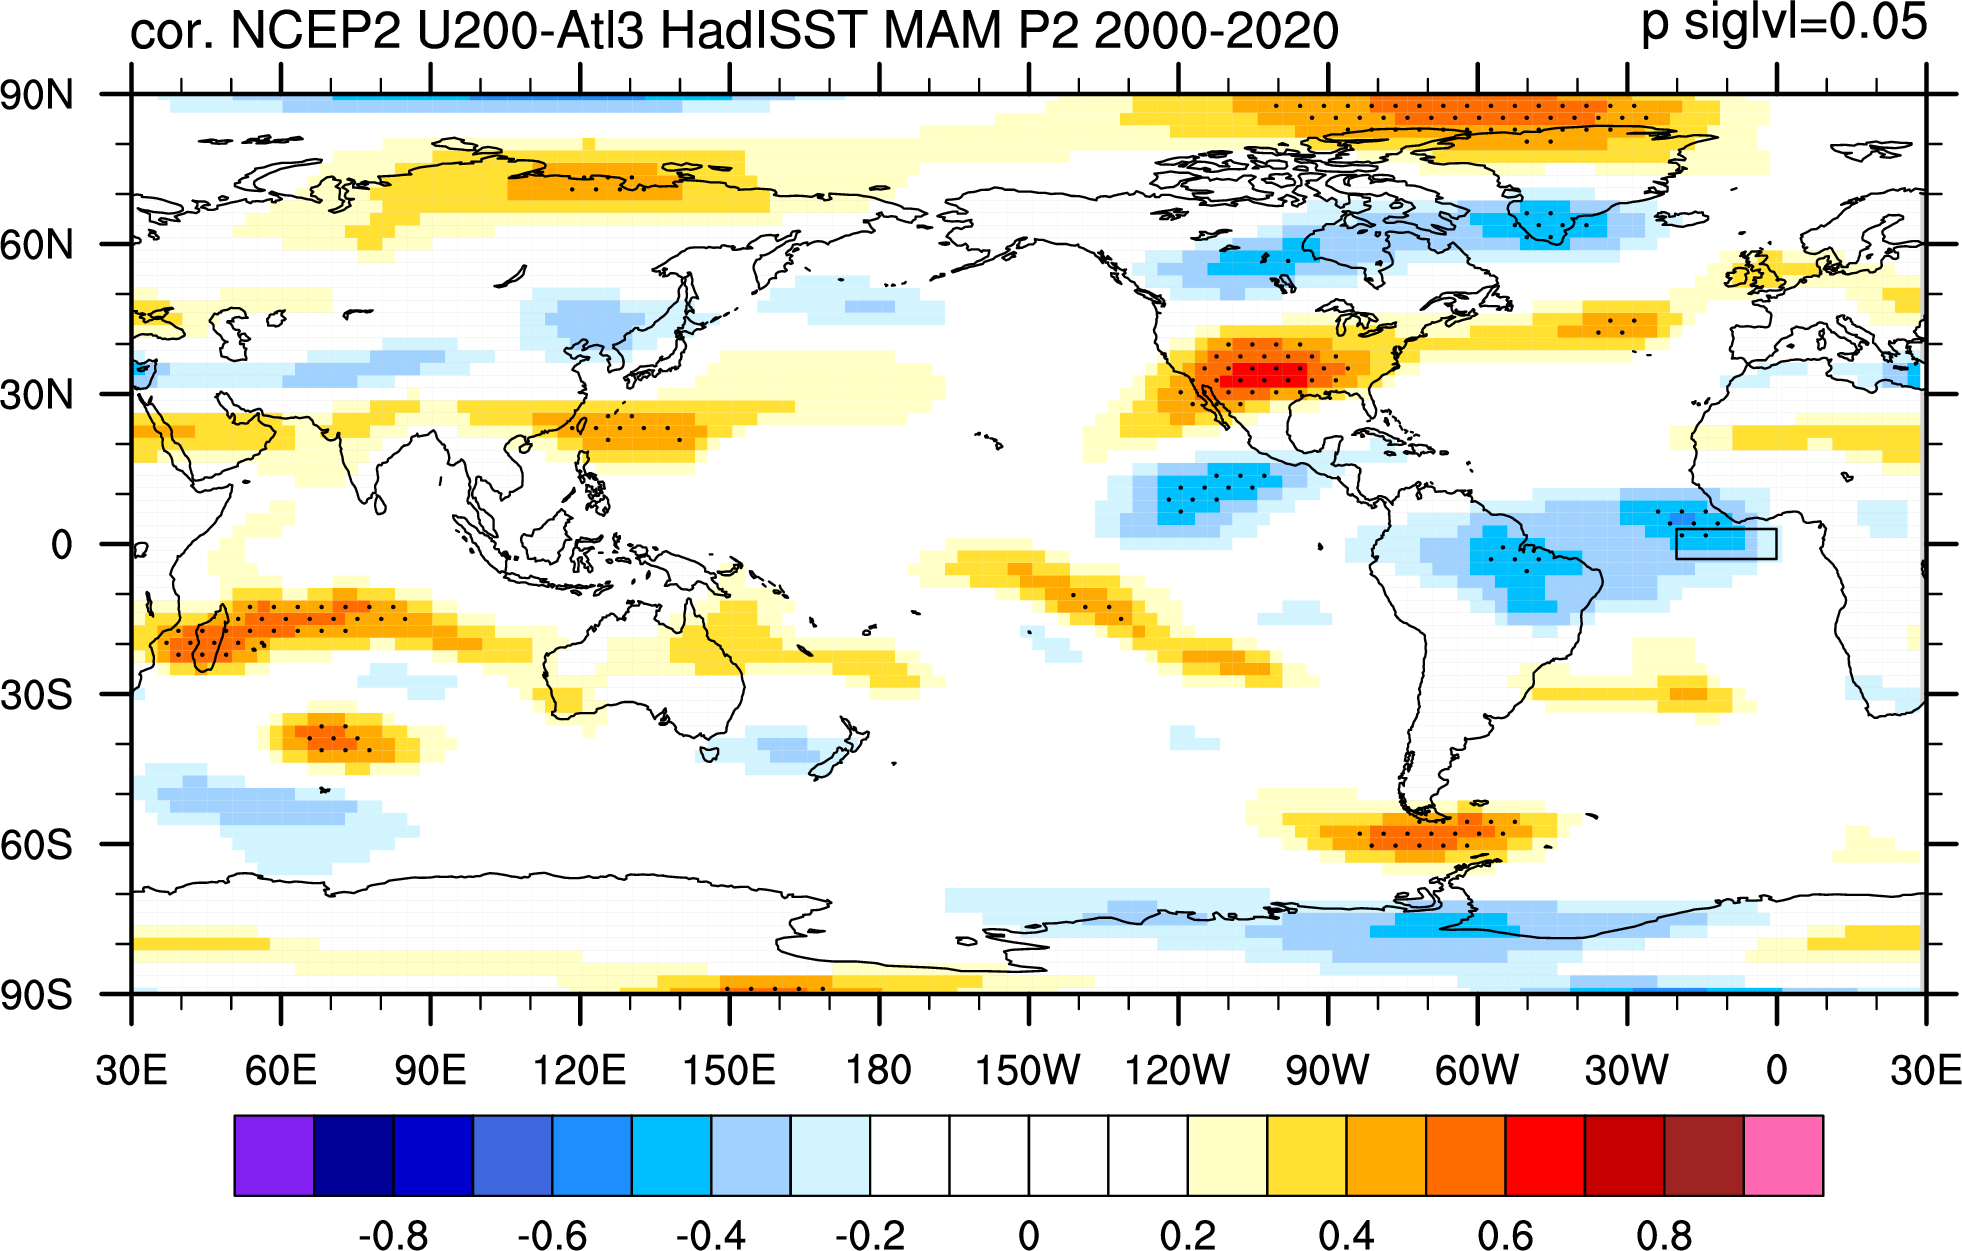
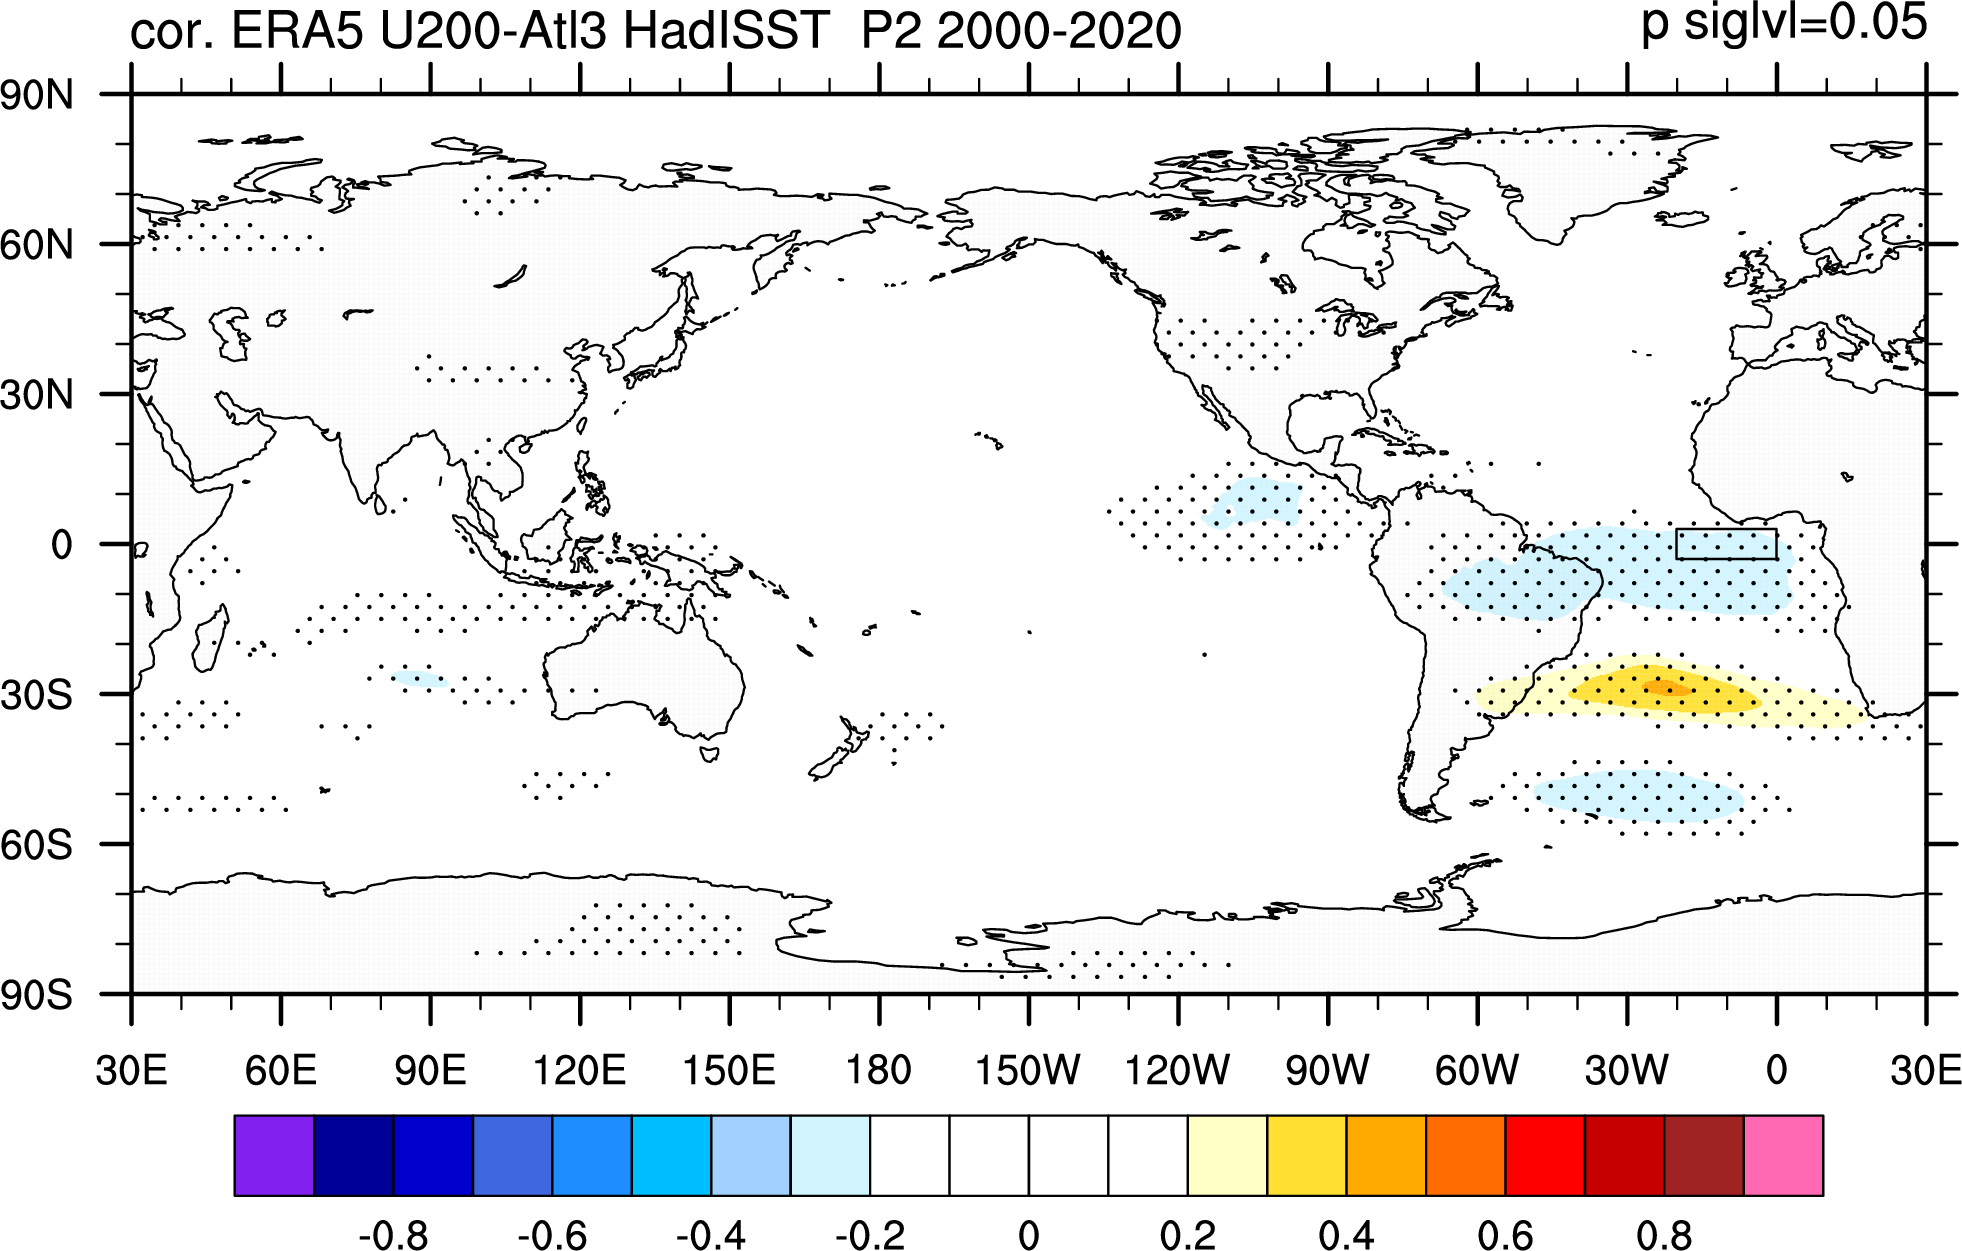
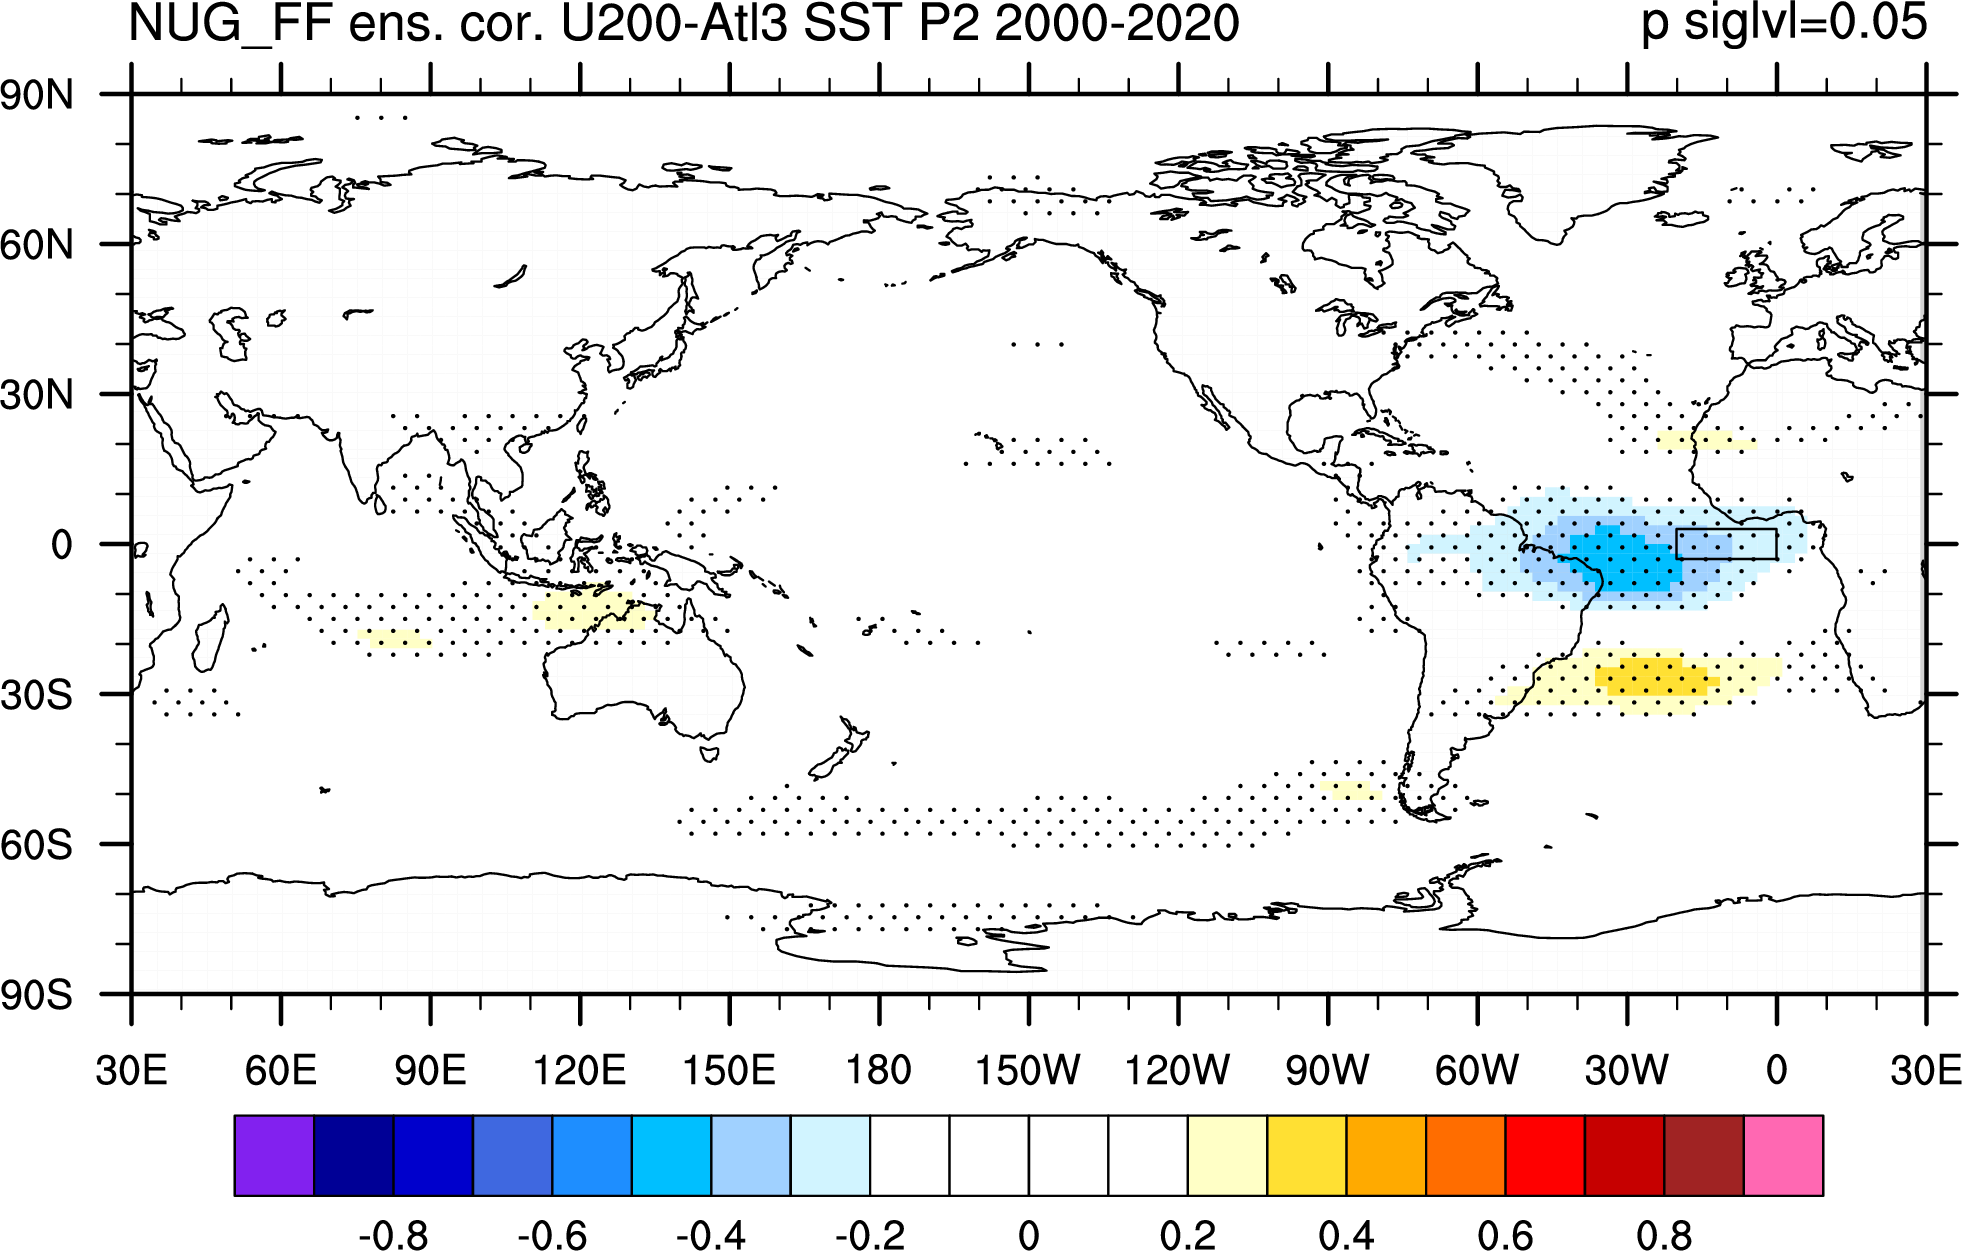
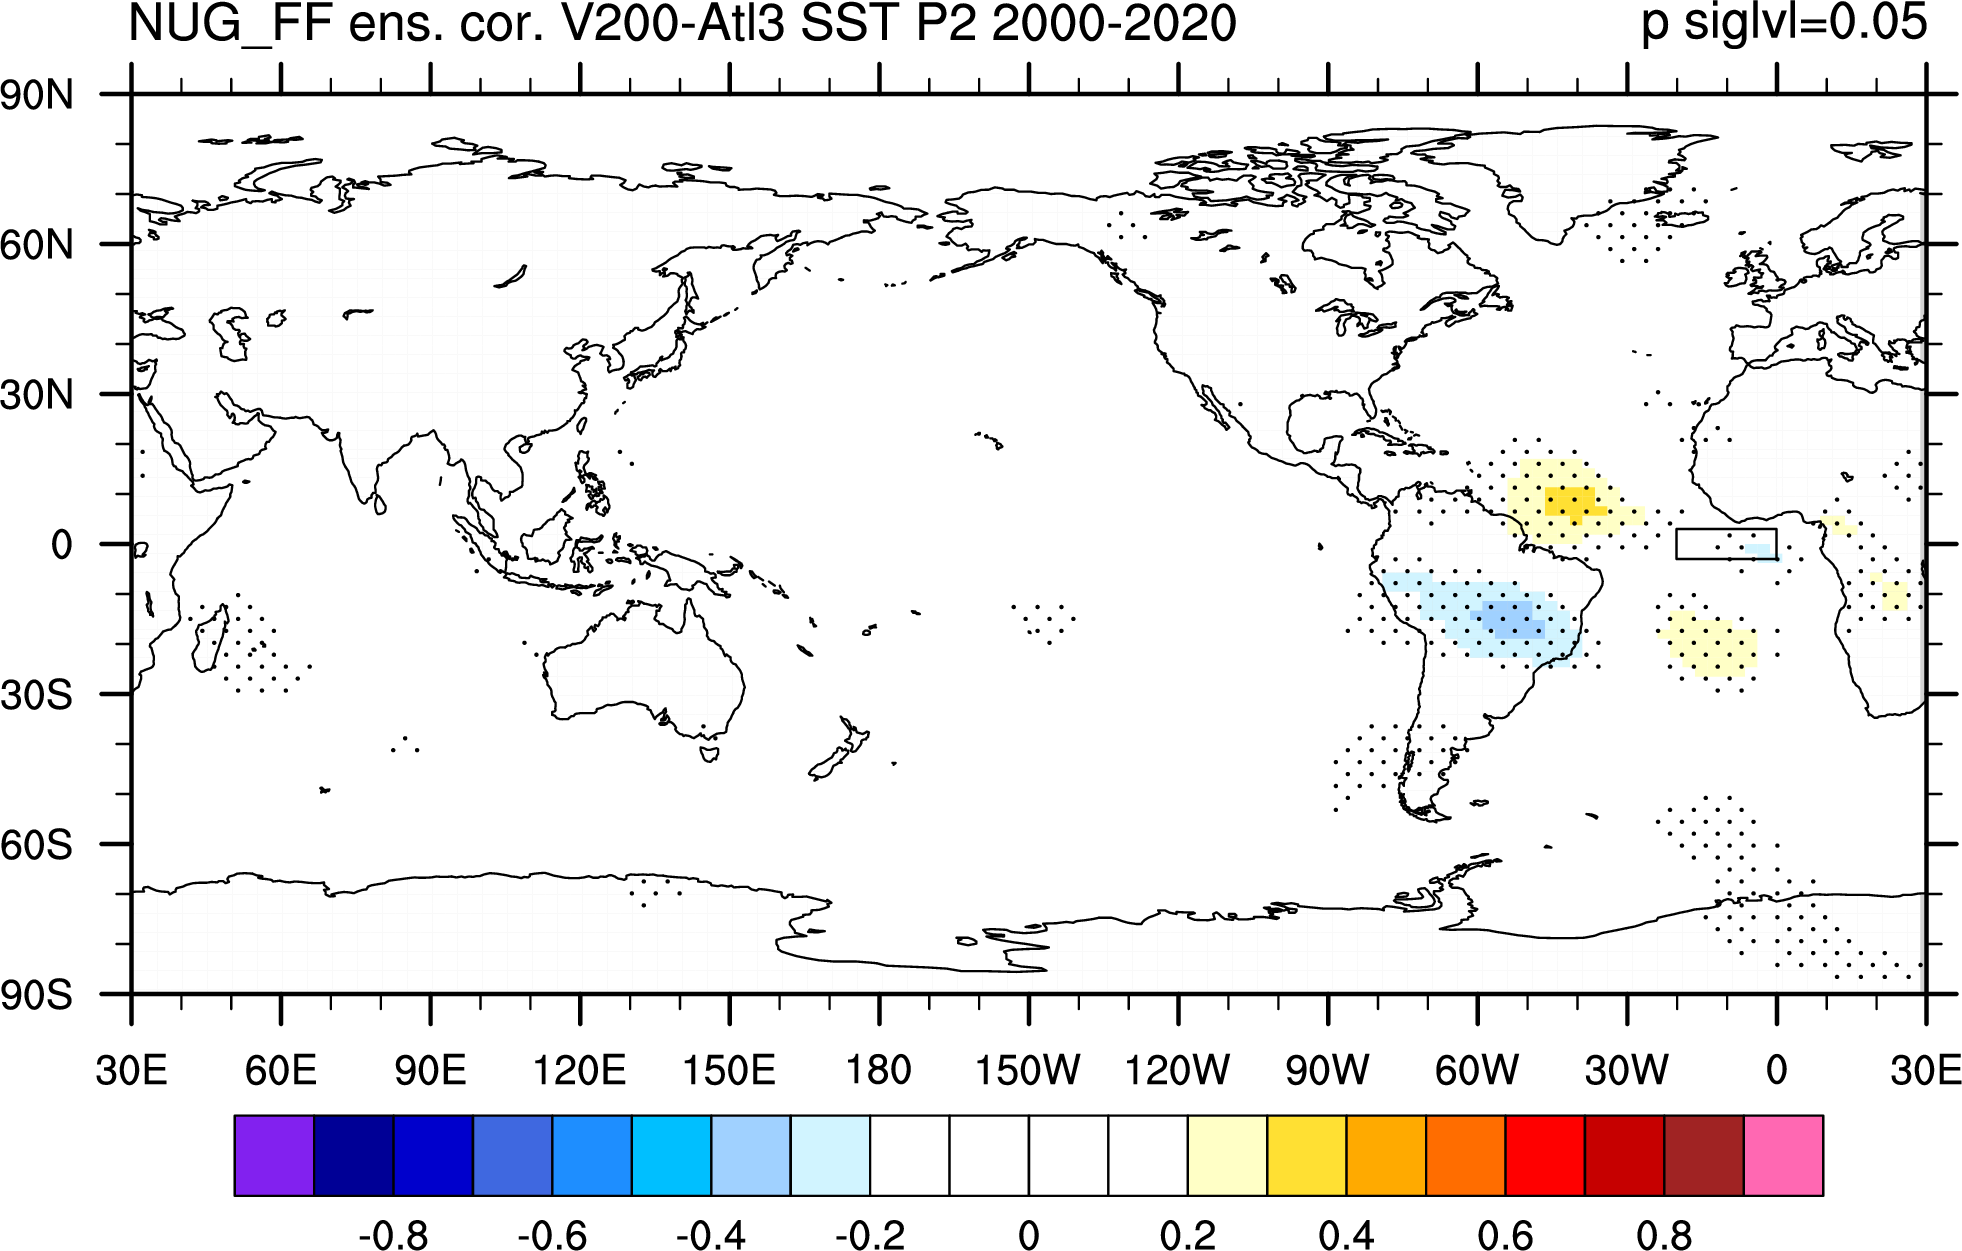
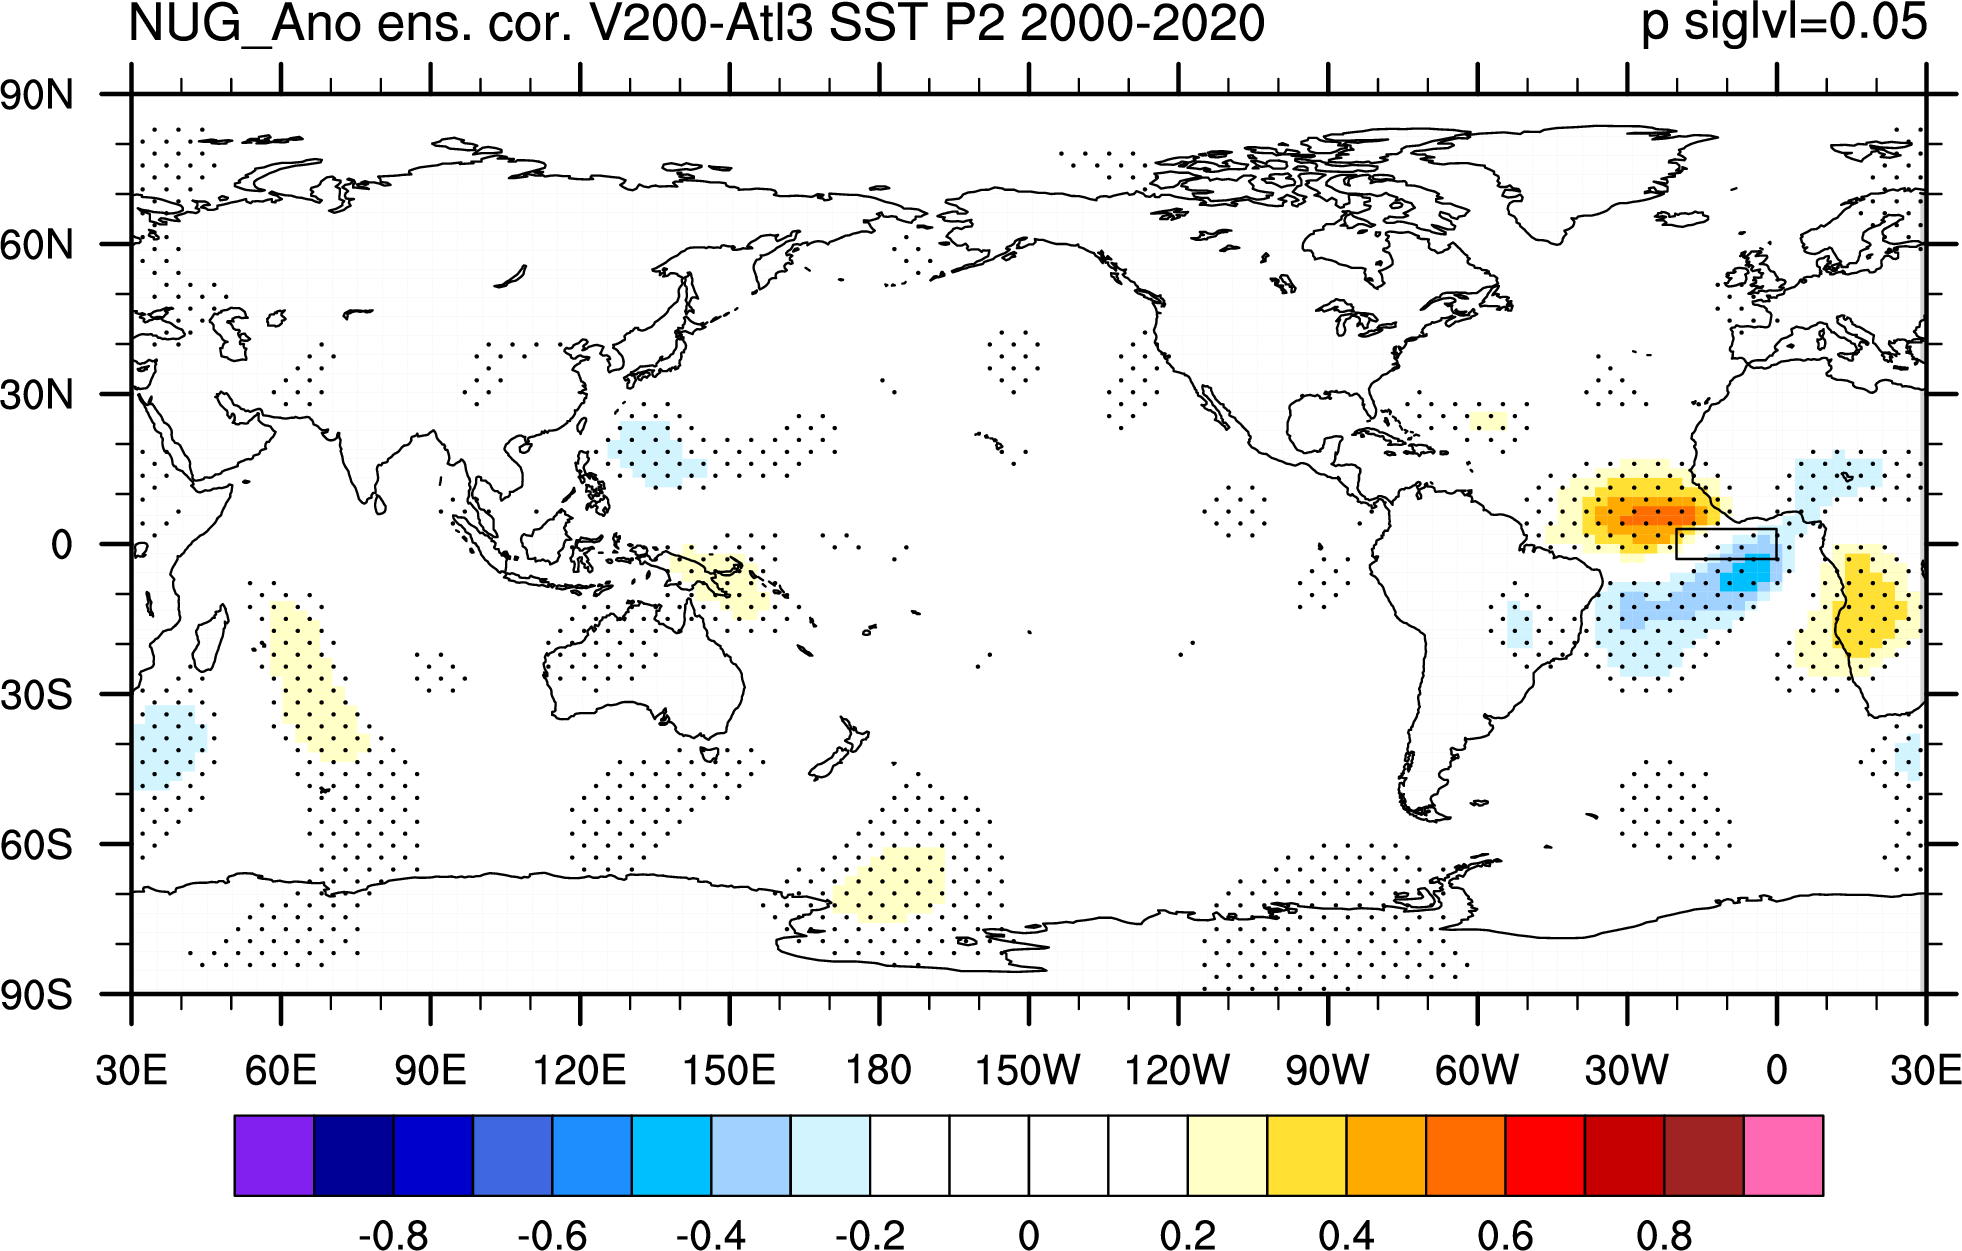
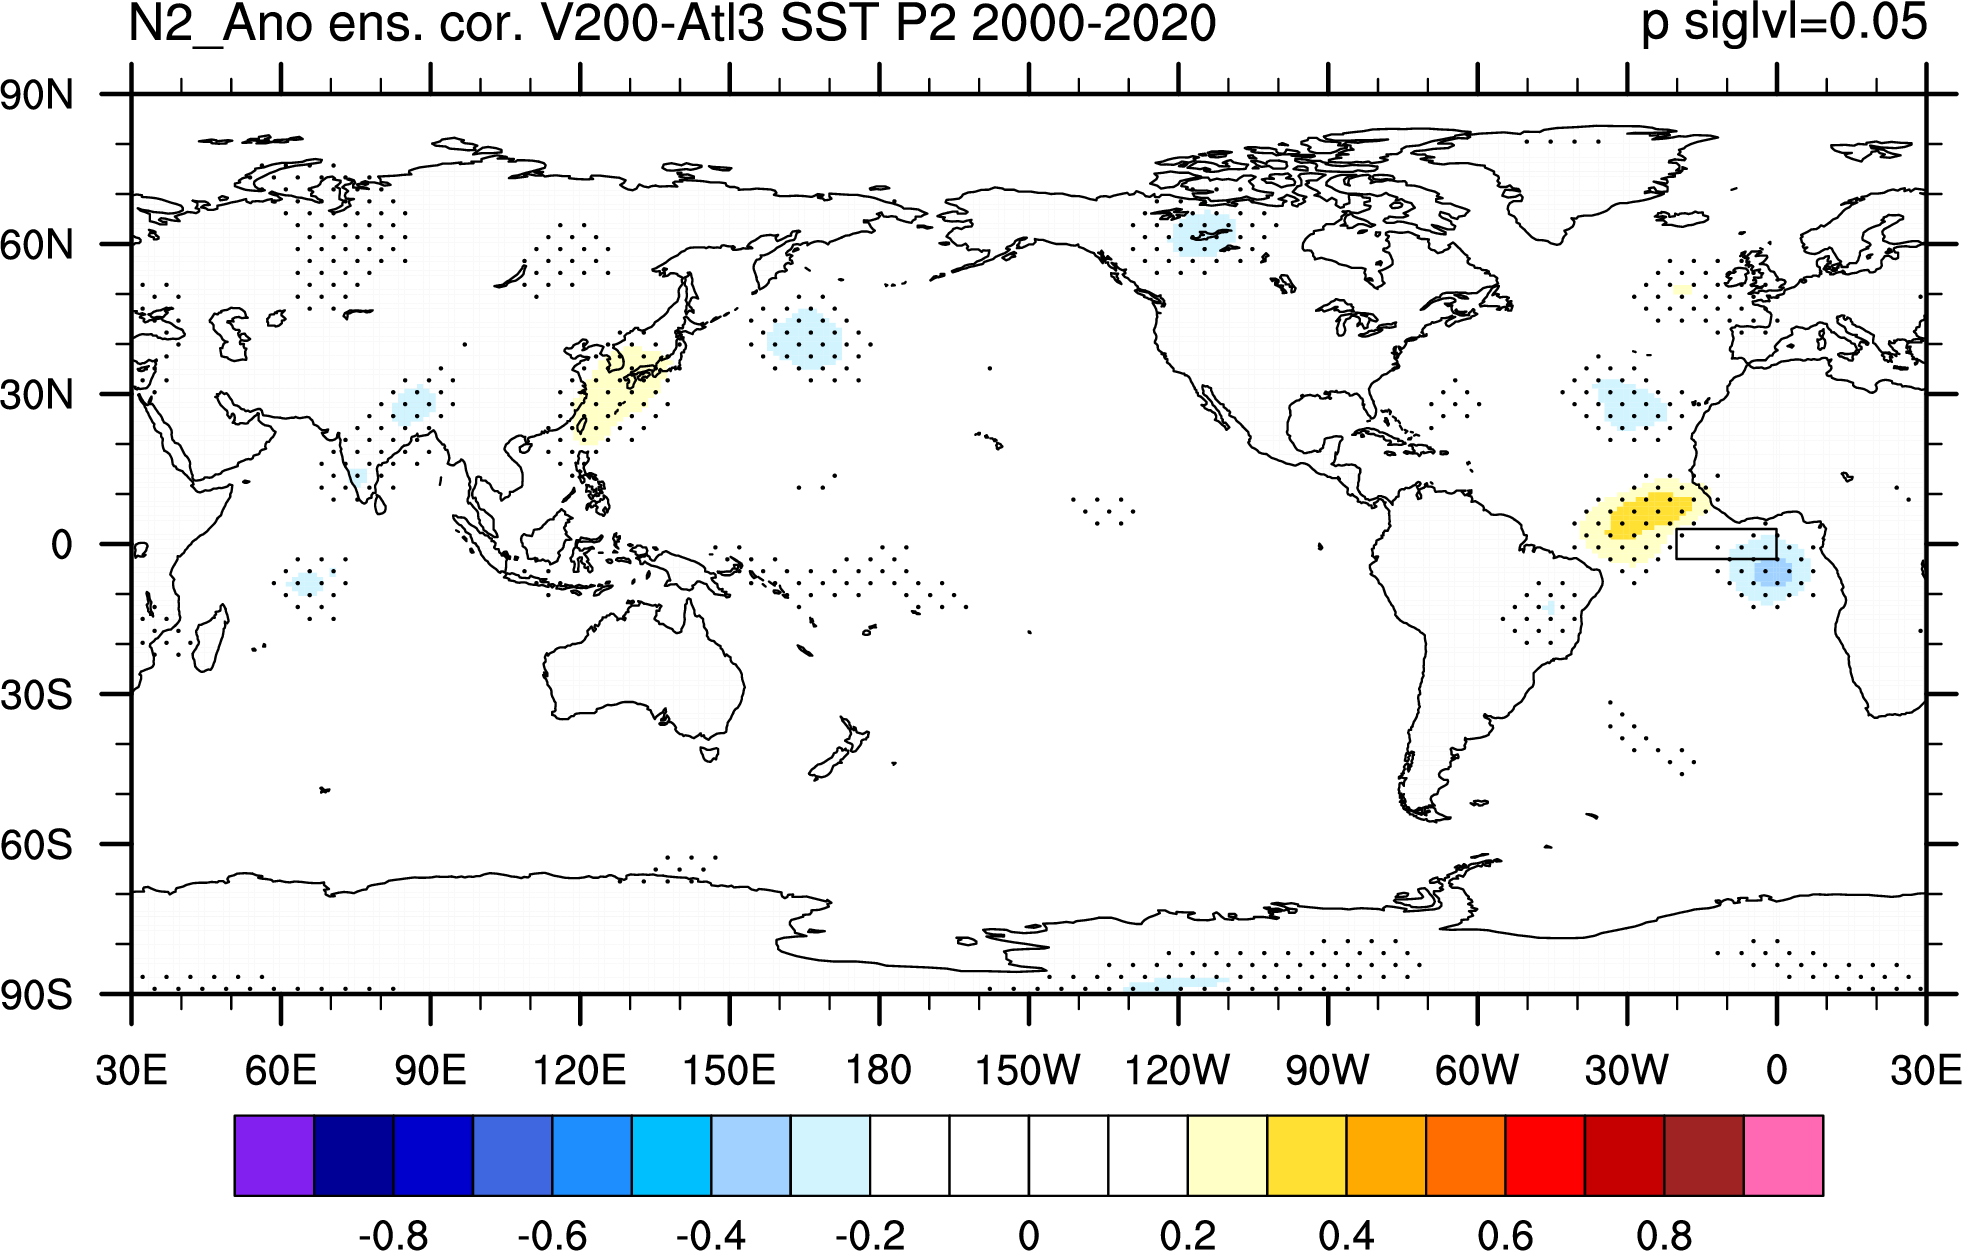
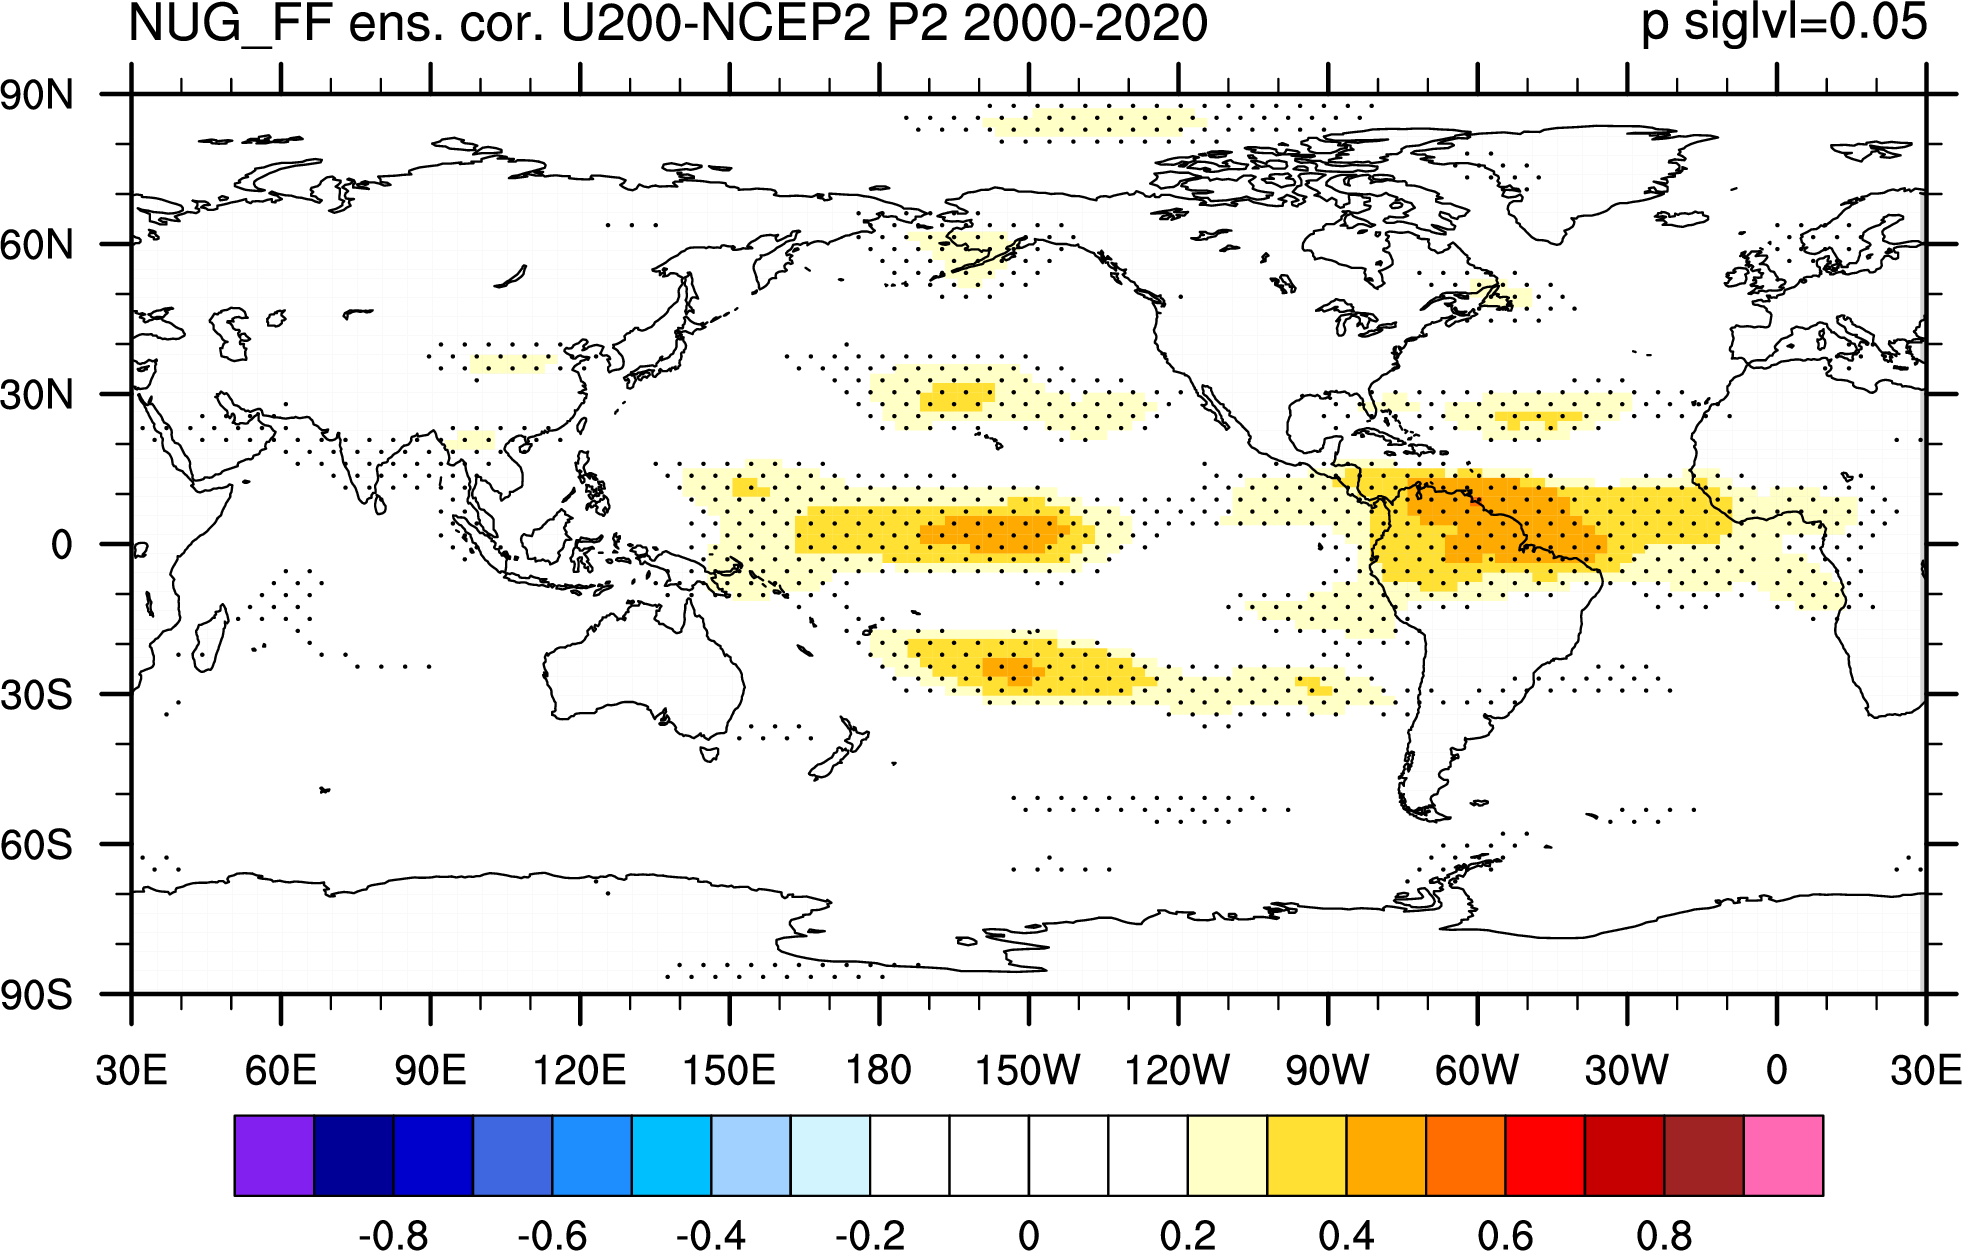
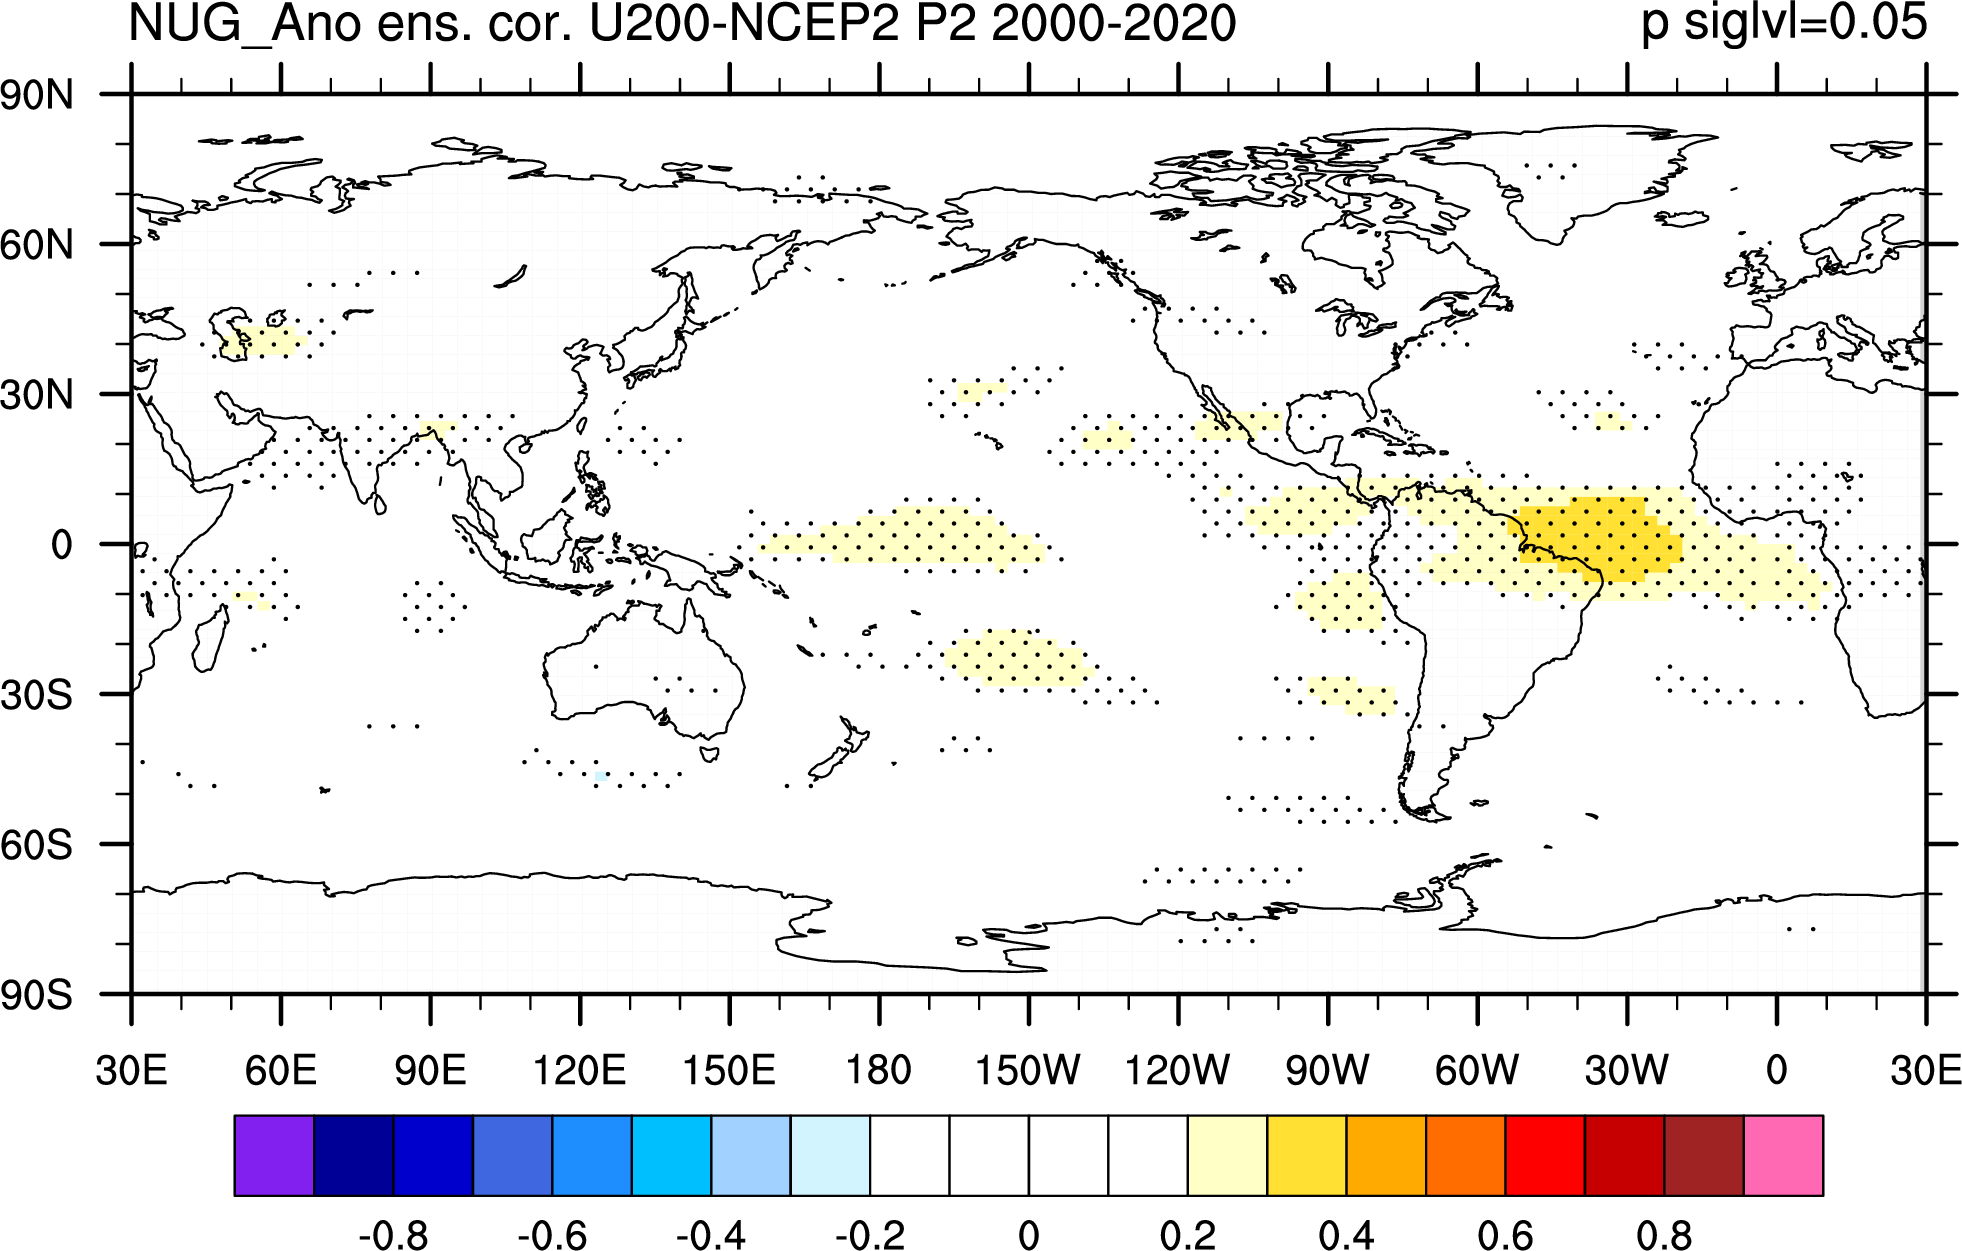
 It does propergated vertically and southward at 2000-2020 200hPa: