| Most of the figs are use 1st member |
|
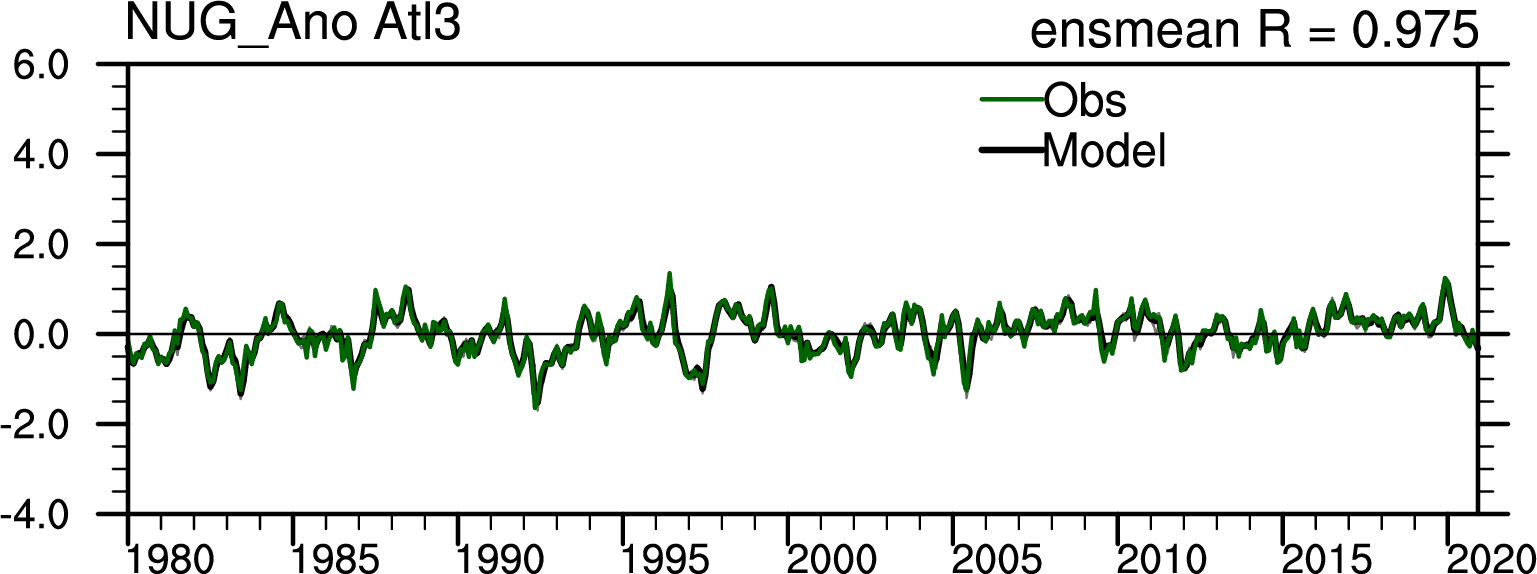
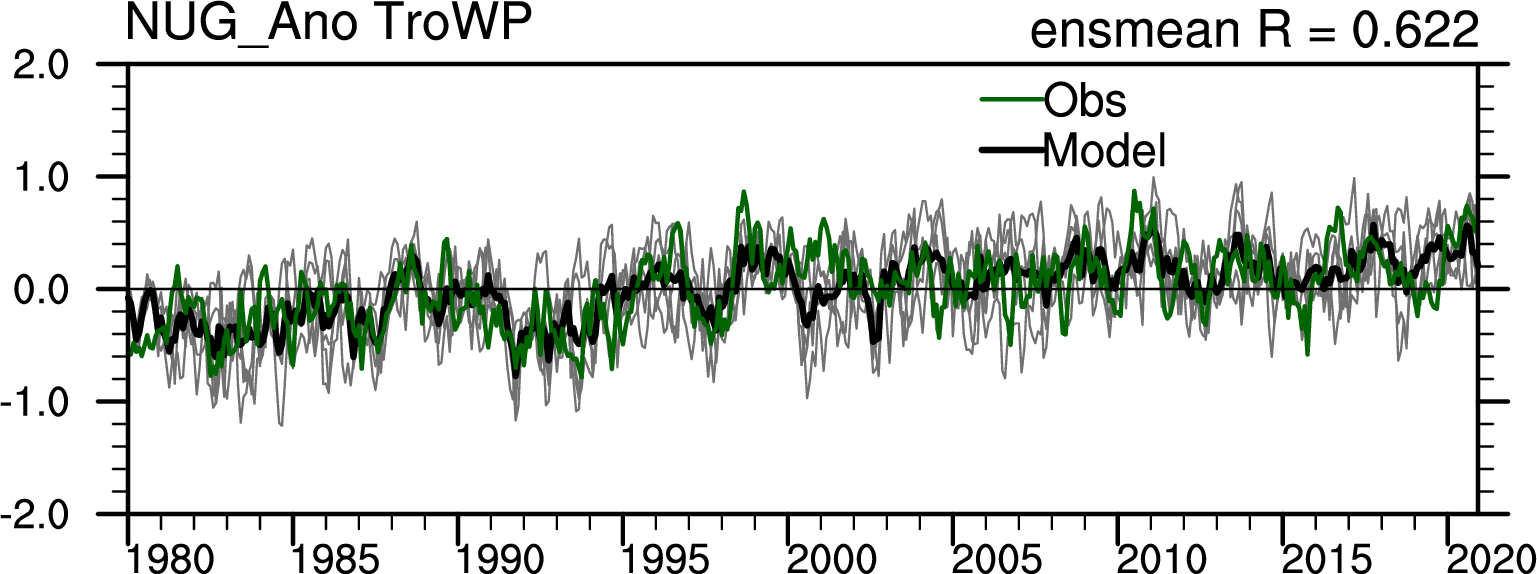
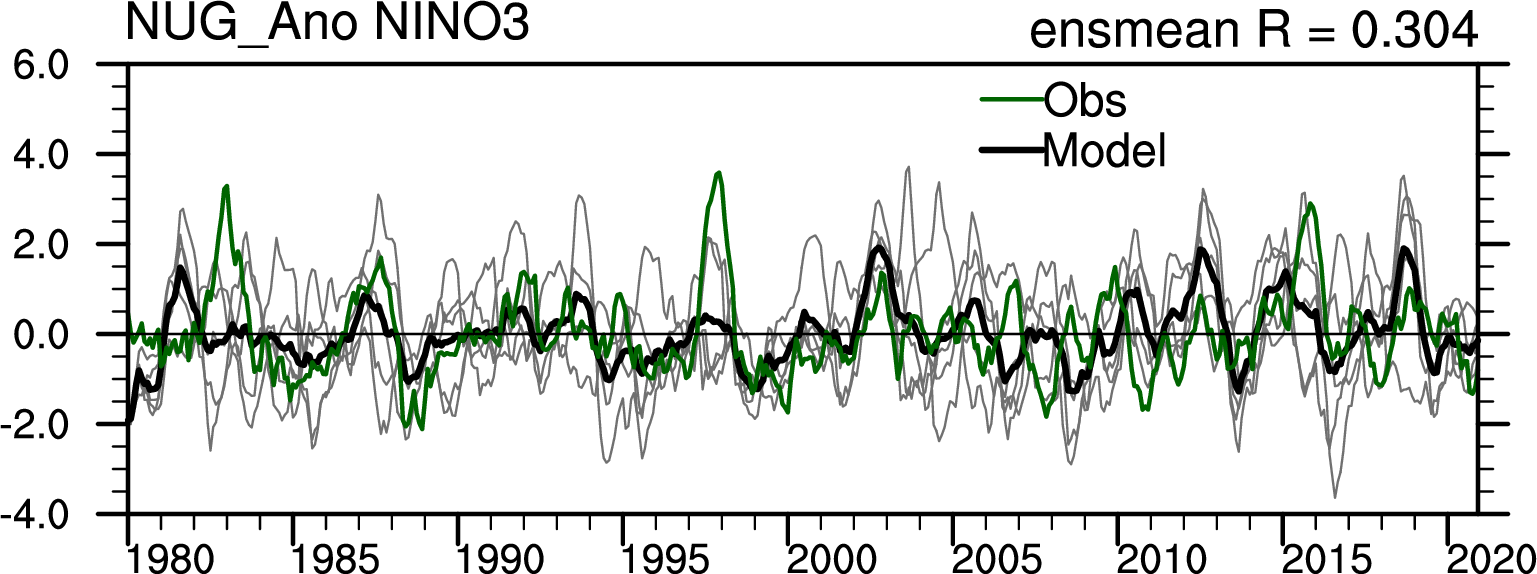
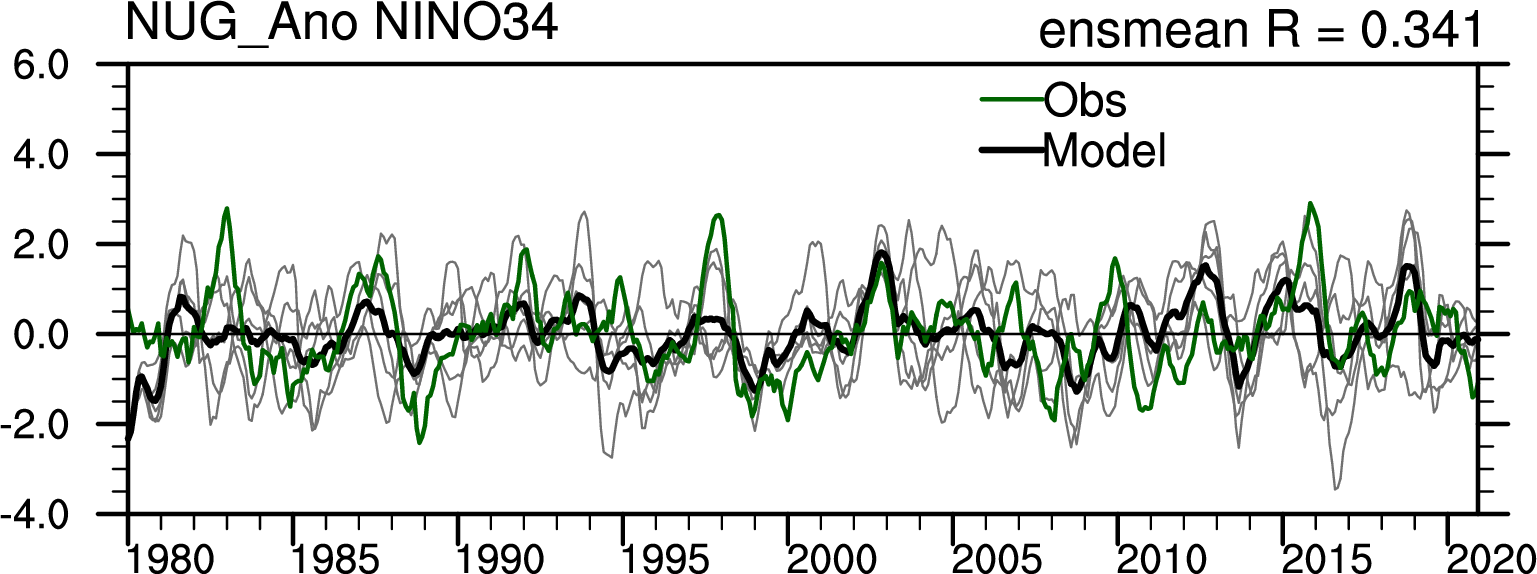
| Correlation of global and regional mean |
|
| Atl3 |
TroWP |
|
 |
 |
|
| seasonal |
seasonal remove |
|
 |
 |
|
| JJA |
|
 |
|
| Monthly Lag-Cor. of Atl3 vs. |
|
| NINO3 |
NINO3.4 |
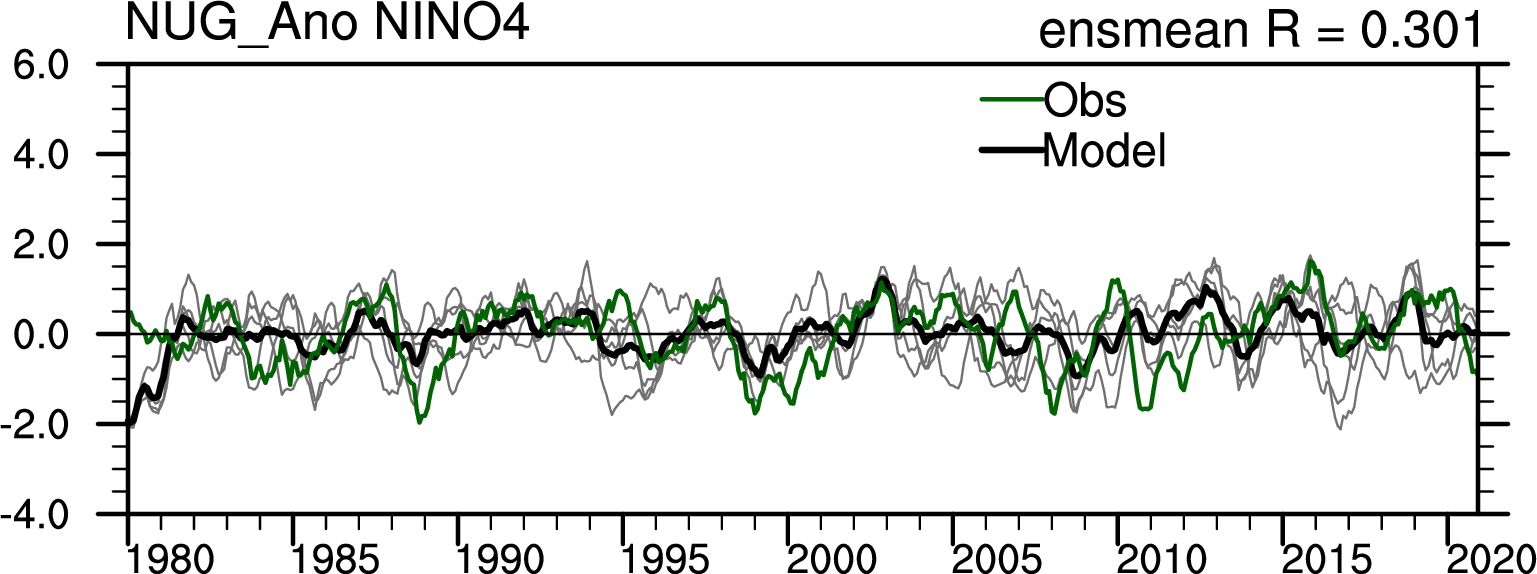
NINO4 |
|
 |
 |
 |
|
| P1: 1980-2000 |
|
 |
 |
 |
|
| P2: 2000-2020 |
|
 |
 |
 |
|
| P1.5: 1990-2010 |
|
 |
 |
 |
|
| Monthly Lag-Cor. of WAtl vs. |
|
| NINO3 |
NINO3.4 |
NINO4 |
|
 |
 |
 |
|
| P1: 1980-2000 |
|
 |
 |
 |
|
| P2: 2000-2020 |
|
 |
 |
 |
|
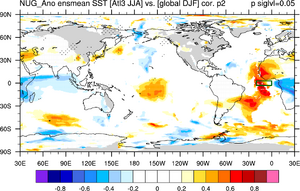
| Atl3 JJA vs. Global DJF (Atl3 lead) |
WTAtl JJA vs. Global DJF (WTAtl lead) |
Detrended, Atl3 |
Detrended, Atl3 |
|
 |
 |
 |
 |
|
| P1: 1980-2000 |
|
 |
 |
 |
 |
|
| P2: 2000-2020 |
|
 |
 |
 |
 |
|
| NINO3 |
NINO34 |
NINO4 |
|
 |
 |
 |
|
 |
 |
 |
|
| Western North Atl |
JJA |
WAtl JJA cor. DJF |
|
| acorens_WAtl |
corens_WAtl_JJA |
corens_WAtlJJA-DJF |
|
| Atl3 SST ts cor. Omega 500 map |
|
| omega500-sst_ens_Atl3 |
omega500JJA-sstJJA-lead_ens_Atl3 |
omega500DJF-sstDJF-lead_ens_Atl3 |
omega500DJF-sstJJA-lead_ens_Atl3 |
|
| Atl3 SST ts cor. prect map |
|
 |
 |
 |
 |
|