TITLE here
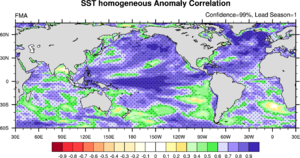
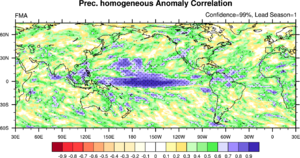
Following Becker et al. 2014 approach ( 10.1175/JCLI-D-13-00597.1 ) 1-4 lead seasonal forecast correlation.

The correlation is between 1st member and ensemble mean of rest of members.
Following Becker et al. 2014 approach ( 10.1175/JCLI-D-13-00597.1 ) 1-4 lead seasonal forecast correlation. The correlation is between 1st member and ensemble mean of rest of members.
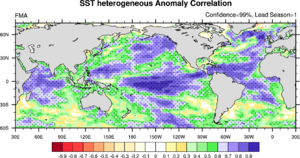
Following Becker et al. 2014 approach ( 10.1175/JCLI-D-13-00597.1 ) 1-4 lead seasonal forecast correlation.

The correlation is between HadISST and ensemble mean of simulation members.
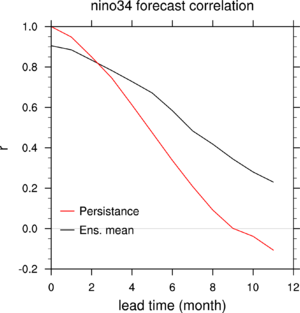
nino3.4 prediction skill, compare with persistence prediction.
SST Rank histogram at global, NAtl(20-70N, 110W-40E) and WNPac(20-70N, 110E-180)
HadISST as observation data.
Rank histogram is ranking frequency of observation data with ensemble members. ie.
Histogram all flat -> good ensemble
Large at most right bin -> model members are overestimate.
Large at most left bin  -> model members are underestimate.
Bell shape -> model simulation is too diverse.
Inverted bell shape -> model simulation is too concentrated.
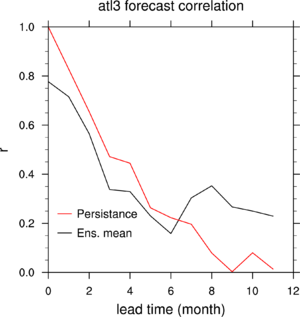
Atlantic-3 (20W-0, 3S-3N) prediction skill, compare with persistence prediction.
From Becker etal 2014. ( 10.1175/JCLI-D-13-00597.1 ) 1-4 lead seasonal forecast correlation.

The correlation is between 1st member and ensemble mean of rest of members.
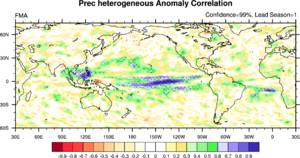
Following Becker et al. 2014 approach ( 10.1175/JCLI-D-13-00597.1 ) 1-4 lead seasonal forecast correlation.

The correlation is between GPCP and ensemble mean of simulation members.
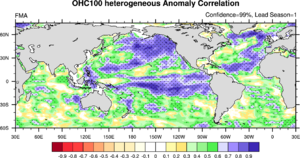
Following Becker et al. 2014 approach ( 10.1175/JCLI-D-13-00597.1 ) 1-4 lead seasonal forecast correlation.

The correlation is 100m OHC between EN4 4.2.1 analysis and ensemble mean of simulation members.
SST anomaly Rank histogram at global, NAtl(20-70N, 110W-40E) and WNPac(20-70N, 110E-180)
HadISST as observation data.
Rank histogram is ranking frequency of observation data with ensemble members.
Histogram all flat -> good ensemble distribution.
Large at most right bin -> model members are overestimate.
Large at most left bin  -> model members are underestimate.
Bell shape -> model simulation is too diverse.
Inverted bell shape -> model simulation is too concentrated.
Tsfc anomaly Rank histogram at global, NAtl(20-70N, 110W-40E) and WNPac(20-70N, 110E-180)
GISS as observation data.
Rank histogram is ranking frequency of observation data with ensemble members.
Histogram all flat -> good ensemble distribution.
Large at most right bin -> model members are overestimate.
Large at most left bin  -> model members are underestimate.
Bell shape -> model simulation is too diverse.
Inverted bell shape -> model simulation is too concentrated.
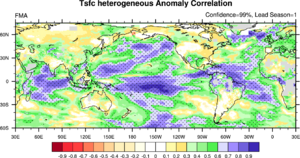
Following Becker et al. 2014 approach ( 10.1175/JCLI-D-13-00597.1 ) 1-4 lead seasonal forecast correlation.

The correlation is between GISS and ensemble mean of simulation members.
contact: pgchiu (Ping-Gin.Chiu_at_uib.no)