ENSO predictionskill
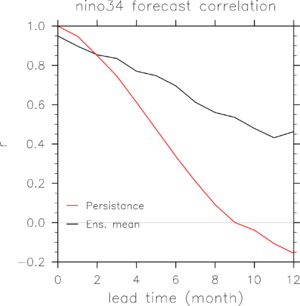
Correlation and RMSE of Nino3.4, compare with HadISST.
Correlation and RMSE of Nino3.4, compare with HadISST.
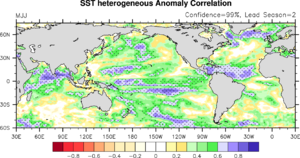
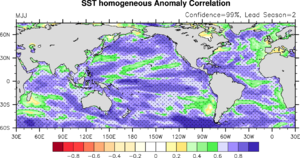
Following Becker et al. 2014 approach, 1-4 lead seasonal forecast correlation. The correlation is between HadISST and ensemble mean.
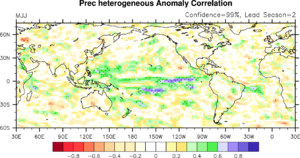
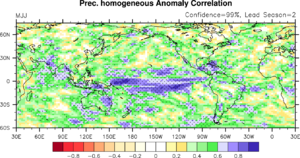
Following Becker et al. 2014 approach, 1-4 lead seasonal forecast correlation. The correlation is between GPCP and ensemble mean.
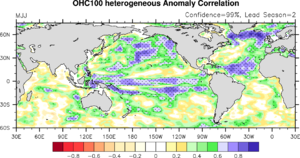
Following Becker et al. 2014 approach, 1-4 lead seasonal forecast correlation. The correlation is 100m OHC100 between EN4 4.2.1 and ensemble mean.
Following Becker et al. 2014. approach, 1-4 lead seasonal forecast correlation. The correlation is between 1st member and ensemble mean of rest of members.
Following Becker et al, 2014. approach, 1-4 lead seasonal forecast correlation. The correlation is between 1st member and ensemble mean of rest of members.
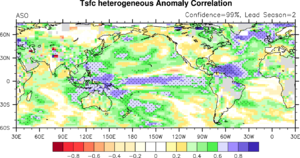
Following Becker et al. 2014 approach, 1-4 lead seasonal forecast correlation. The correlation is between GISS and ensemble mean.
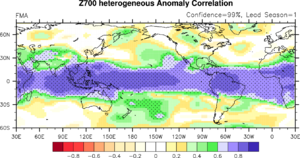
Following Becker et al. 2014 approach, 1-4 lead seasonal forecast correlation. The correlation is between ERA5 reanalysis and ensemble mean.
This is a test for rank histogram. Use 1st member as proxy observation.
SST rank histogram. Use HadISST as observation data.
SST anomaly prediction rank histogram. Use HadISST as observation data.
Tsfc anomaly prediction rank histogram. Use GISS as observation data.
Z700 anomaly prediction rank histogram. Use GISS as observation data.
contact: pgchiu (Ping-Gin.Chiu_at_uib.no)